|
|
市場調査レポート
商品コード
1347955
OTTデバイス・サービスの世界市場-2023年~2030年Global OTT Devices and Services Market - 2023-2030 |
||||||
|
|
|||||||
カスタマイズ可能
適宜更新あり
|
|||||||


| OTTデバイス・サービスの世界市場-2023年~2030年 |
|
出版日: 2023年09月11日
発行: DataM Intelligence
ページ情報: 英文 203 Pages
納期: 即日から翌営業日
|

- 全表示
- 概要
- 目次
概要
世界のOTTデバイス・サービス市場は、2022年に1,905億米ドルに達し、2023-2030年の予測期間中にCAGR 24.7%で成長し、2030年には4,824億米ドルに達すると予測されています。
全国的に高速インターネット接続、特にブロードバンド接続と4G/5Gネットワークが拡大し、様々なデバイスでOTTコンテンツのシームレスなストリーミングと消費が可能になっています。タブレットやスマートフォンの普及はOTTコンテンツへの容易なアクセスを提供し、ユーザーは安定したインターネット接続があればどこからでもビデオや映画を視聴できます。
2021年1月、Netflixは他の上位5つのストリーミング・サービスの中で35.1%という最も高いシェアを獲得しました。スマートTVや、セットトップボックス、メディアプレーヤー、ゲームウィンドウなどの様々な接続機器が簡単に利用できるようになったことで、ユーザーはテレビ画面から直接OTTサービスにアクセスできるようになり、便利になっています。OTTプラットフォームは、映画やオリジナルシリーズ、テレビ番組など幅広いコンテンツを提供しています。
アジア太平洋は、世界のOTT機器・サービス市場の1/3以上を占める成長地域のひとつであり、インターネット普及率の急速な上昇により、多くの人口が高速インターネットにアクセスできるようになり、この広範な接続性により、より多くの人々がOTT機器やコンテンツにアクセスできるようになっています。インターネット接続の普及は、OTT機器とプラットフォームの人気を著しく高めています。
ダイナミクス
企業間のパートナーシップの拡大
OTTプラットフォームとコンテンツ・プロバイダー間のパートナーシップは、視聴者に幅広いコンテンツを提供することを可能にします。複数のソースからコンテンツを集約することで、プラットフォームは多様な視聴者の嗜好に対応し、ユーザーのエンゲージメントを高めることができます。OTTプロバイダーと機器メーカーや通信事業者とのコラボレーションは、サービスのリーチを新たな市場に広げることができます。
例えば、2023年12月15日、デジタルトランスフォーメーションとプロダクトエンジニアリングのサービスプロバイダーであるトゥ・ザ・ニューは、IL Globo TVとパートナーシップを締結しました。この提携は、トゥ・ザ・ニューのOTTサービスとデジタルソリューションの専門知識を活用し、IL Globo TVのOTTサービスを世界な視聴者向けに設計・開発することを目的としています。この提携により、トゥザニューはその技術力とイノベーション・エコシステムを活用し、IL Globo TVのOTTプラットフォームを構築します。
技術進歩
技術の進歩は、4Kや8Kのような高解像度のコンテンツ配信を可能にし、ユーザーの視覚体験を向上させます。また、スマートTVやスマートフォンなど様々なデバイスから様々なOTTコンテンツへのシームレスなアクセスも可能になります。クラウド・ソリューションは、物理的なハードウェアやメンテナンス・コストの必要性を低減し、新興企業にとっても既存プレーヤーにとっても費用対効果が高くなります。
例えば、2023年8月8日、動画技術のスペシャリストであるMediaKind社は、Microsoft Azure上に構築された完全なストリーミング・ソリューションであるMK/IOを発表しました。MK/IOは、動画品質、高い信頼性、スケーラビリティを組み合わせることで、動画ストリーミング体験を向上させることを目的としています。このソリューションは、ビデオ・オン・デマンド(VOD)およびライブ・ストリーミング、ファイルとライブ動画ストリームの両方に対するエンコーディングおよびパッケージング・サービスを提供します。
デジタルプラットフォームの普及
デジタル・プラットフォームの普及が進むにつれ、OTTデバイス・サービス産業は大きく成長しています。人口の増加とコンテンツ消費のためのデジタル・プラットフォームの利用が市場を押し上げます。デジタル・プラットフォームは、ユーザーがいつでもどこからでも、スマートフォン、タブレット、スマートTVなどの複数のデバイスでコンテンツにアクセスできるようにすることで、利便性を提供します。これらのプラットフォームでは、ユーザーはコンテンツを視聴するためのプランを自分で選択することができます。
例えば、2022年12月26日、インドの著名なデジタルケーブルTVプラットフォームおよびブロードバンド・サービス・プロバイダーであるGTPL Hathway Limitedは、革新的なOver-The-Topアプリ・アグリゲーション製品である「GTPL Genie+」を発表しました。GTPL Genie+プラットフォームはOTTアプリのセレクションを集約し、加入者はブロードバンド接続に関係なく、Androidセットトップボックス、モバイルデバイス、ラップトップ、タブレット、スマートテレビなど様々なデバイスでコンテンツにアクセスできます。
貧弱なインターネット接続と地域ライセンス契約
OTTサービスは、シームレスなストリーミングのために安定した高速インターネット接続を必要とします。低速または信頼性の低いインターネット接続は、バッファリング、動画品質の低下、中断の原因となります。動画コンテンツのストリーミングは大量のデータを消費するため、データプランが限られているユーザーにとってはデータ使用量が多くなります。帯域幅の制約により、同じネットワーク上の複数のユーザーがストリーミングの速度低下や画質劣化を経験する可能性があります。
OTTプラットフォーム上のコンテンツには、地域ライセンス契約の対象となるものがあり、アクセスに地理的制約が生じる場合があります。特定の地理的地域の消費者は、他の地域で視聴可能な特定の番組、映画、ライブ・イベントにアクセスできない可能性があります。OTTプラットフォームで利用可能なコンテンツの量が増えるにつれ、ユーザーは新しく関連性の高いコンテンツを発見する上で課題に直面する可能性があります。コンテンツ推薦のアルゴリズムに過度に依存すると、多様なコンテンツへの接触が制限される可能性があります。
目次
第1章 調査手法と調査範囲
第2章 定義と概要
第3章 エグゼクティブサマリー
第4章 市場力学
- 影響要因
- 促進要因
- 企業間のパートナーシップの拡大
- 技術進歩
- デジタルプラットフォームの普及
- 抑制要因
- 貧弱なインターネット接続と地域ライセンス契約
- 機会
- 影響分析
- 促進要因
第5章 産業分析
- ポーターのファイブフォース分析
- サプライチェーン分析
- 価格分析
- 規制分析
- ロシア・ウクライナ戦争の影響分析
- DMIの見解
第6章 COVID-19分析
第7章 コンポーネント別
- ゲームストリーミング
- 音声ストリーミング
- 動画ストリーミング
- 通信
第8章 ストリーミングデバイス別
- スマートフォン・タブレット
- デスクトップ/ノートPC
- IPTV・ゲーム機
第9章 マネタイズモデル別
- サブスクリプションベース
- 広告ベース
- トランザクションベース
第10章 エンドユーザー別
- メディア・エンターテインメント
- 教育・学習
- ゲーム
- サービス・ユーティリティ
第11章 地域別
- 北米
- 米国
- カナダ
- メキシコ
- 欧州
- ドイツ
- 英国
- フランス
- イタリア
- ロシア
- その他欧州
- 南米
- ブラジル
- アルゼンチン
- その他南米
- アジア太平洋
- 中国
- インド
- 日本
- オーストラリア
- その他アジア太平洋
- 中東・アフリカ
第12章 競合情勢
- 競合シナリオ
- 市況/シェア分析
- M&A分析
第13章 企業プロファイル
- Panasonic
- 企業概要
- 製品ポートフォリオと説明
- 財務概要
- 主な動向
- NXP Semiconductor
- Renesas Electronics
- Blackberry
- Visteon Corporation
- Netflix, Inc.
- Amazon
- The Walt Disney Company
- Tencent Holdings Ltd
- Roku Inc.
第14章 付録
Overview
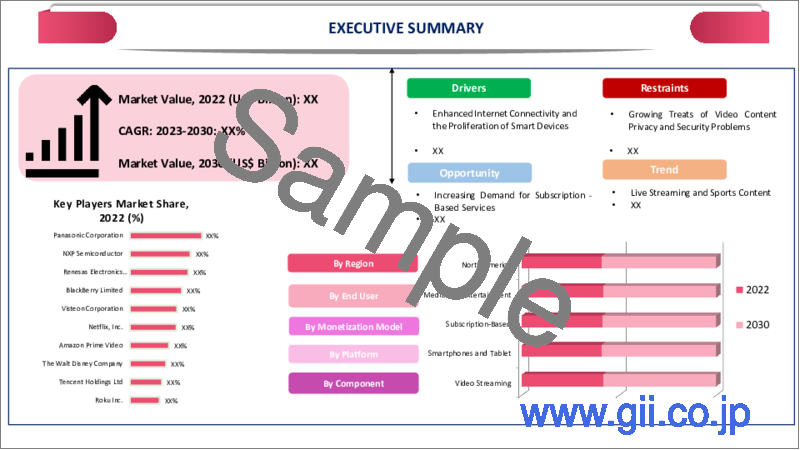
Global OTT Devices and Services Market reached US$ 190.5 billion in 2022 and is expected to reach US$ 482.4 billion by 2030, growing with a CAGR of 24.7% during the forecast period 2023-2030.
Growing high-speed internet connectivity across the country particularly broadband connection and 4G/5G networks has seamless streaming and consumption of OTT content on various devices. The widespread adoption of tablets and smartphones provides easy access to OTT content and allows users to watch videos and movies from any place with stable internet connectivity.
In January 2021, Netflix had the highest share of service that is 35.1% among other top five streaming services. The easy availability of smart TVs and various connected devices such as set-top boxes, media players and gaming windows has made it convenient for users to access OTT services directly from their television screens. OTT platforms offer a wider range of content that includes movies original series and TV shows.
Asia-Pacific is among the growing regions in the global OTT devices and services market covering more than 1/3rd of the market and the rapid increase in internet penetration, with a large population gaining access to high-speed internet and this widespread connectivity enables more people to engage with OTT devices and content. The prevalence of internet connectivity significantly rises the popularity of OTT devices and platforms.
Dynamics
Growing Partnerships Between Companies
Partnerships between OTT platforms and content providers enable a wider range of content to be offered to viewers. By aggregating content from multiple sources platforms can cater to diverse audience preferences and increase user engagement. Collaborations between OTT providers and device manufacturers or telecom operators can extend the reach of the services to new markets.
For instance, on 15 December 2023, TO THE NEW, a digital transformation and product engineering service provider, has entered into a partnership with IL Globo TV, a collaboration aimed at leveraging TO THE NEW's expertise in OTT services and digital solutions to design and develop IL Globo TV's OTT services for global audiences. Through this collaboration, TO THE NEW will utilize its technical capabilities and innovation ecosystem to create IL Globo TV's OTT platform.
Technology Advancement
Technology advancement enables the delivery of content in high resolution like 4K and 8K which enhances the visual experience for users. It also enables seamless access to various OTT content from various devices such as smart TVs and smartphones. Cloud solutions reduce the need for physical hardware and maintenance costs, making it more cost-effective for both startups and established players.
For instance, On 8 August 2023, MediaKind, a video technology specialist, has unveiled MK/IO, a complete streaming solution built on Microsoft Azure. MK/IO aims to enhance the video streaming experience by combining video quality, high reliability and scalability. The solution offers video-on-demand (VOD) and live streaming, encoding and packaging services for both files and live video streams.
Rising Adoption of Digital Platforms
The rising adoption of digital platforms significantly increases the OTT devices and service industry. The increasing population and usage of digital platforms for consuming content boost the market. Digital platforms offer convenience by allowing users to access content from anywhere at any time and on multiple devices like smartphones, tablets and smart TVs. As these platforms allow users to select their own plans for watching content.
For instance, on 26 December 2022, GTPL Hathway Limited, a prominent Digital Cable TV platform and Broadband Service provider in India, introduced "GTPL Genie + ," an innovative Over-The-Top app aggregation product. The GTPL Genie + platform aggregates a selection of OTT apps, enabling subscribers to access content on various devices such as Android Set-Top-Boxes, mobile devices, laptops, tablets and smart TVs, regardless of their broadband connection.
Poor Internet Connection and Regional License Agreement
OTT services require a stable and high-speed internet connection for seamless streaming. Slow or unreliable internet connections can result in buffering, poor video quality and interruptions. Streaming video content consumes a large amount of data, which lead to high data usage for users with limited data plans. Bandwidth constraints can cause multiple users on the same network to experience slowdowns or degradation in streaming quality.
Some content on OTT platforms may be subject to regional licensing agreements which leads to geographic restrictions on access. Consumers in specific geographic regions may not be able to access specific shows, movies or live events available in other regions. As the amount of content available on OTT platforms increases, users may face challenges in discovering new and relevant content. Overreliance on algorithms for content recommendations may lead to limited exposure to diverse content.
Segment Analysis
The global OTT devices and services market is segmented based on component, streaming devices, monetization model, end-user and region.
Streaming Game and Live Video Content
The boundaries between traditional media and gaming are reducing day by day, with many users enjoying both video content and games. OTT platforms recognize this trend and aim to provide a comprehensive entertainment experience that includes both streaming video content and interactive gaming. Game streaming on OTT platforms can offer cross-platform accessibility, allowing users to play games on various devices, such as TVs, computers, smartphones and tablets, this flexibility enhances user engagement and convenience.
For instance, on 16 August 2023, Netflix has been progressively integrating gaming into its platform, initially introducing mobile games for its members. The company has initiated game testing for TVs and PCs, coinciding with the launch of their Netflix Game Controller app. Netflix is introducing gaming to TVs on specific devices such as Amazon Fire TV and Chromecast with Google TV, this strategic move aims to enhance the accessibility of their cloud gaming concept.
Initially available on Android phones and iPhones, Netflix is now broadening its reach to encompass TVs. To play Netflix games on a TV, users must download the Netflix Game Controller app from the Google Play Store or Apple App Store.
Geographical Penetration
Rising Live Video Streaming and Partnerships
North America is among the largest regions in the global OTT devices and services market covering more than 1/3rd of the market and the region has a rise in live video streaming. Also, consumers in North America have a wide range of content that can be accessed from OTT platforms. The region has a well-developed technology infrastructure and partnerships boost the market.
For instance, on 22 August 2023, Viaplay and Roku had a multi-year partnership offering Viaplay streaming services to Roku devices in U.S., Canada and UK. As these partnerships allow users in these countries to directly subscribe to Viaplay local content which is offered by Roku. In U.S. and Canada have 15,000 hours for acclaimed series and films. The partnership aims to expand its service to a broader audience and it also provides a convenient user platform.
Competitive Landscape
The major global players in the market include: Panasonic, NXP Semiconductor, Renesas Electronics, Blackberry, Visteon Corporation, Netflix,Inc., Amazon, The Walt Disney Company, Tencent Holdings Ltd and Roku Inc.
COVID-19 Impact Analysis
With people staying at their home due to lockdowns and restrictions, there was a substantial increase in streaming viewership. People turned to OTT platforms for entertainment, leading to higher demand for streaming services and content. As adoption of remote work and online education became the norm, there was a rise in the use of OTT services for professional development, training and online learning.
According to the paper published in research gate, The COVID-19 pandemic led to a significant surge in the subscription rates of Over-The-Top platforms, particularly in the film industry and with the suspension of film theaters and shooting activities, people sought alternative ways to enjoy movies from the comfort of their homes, this resulted in a rapid increase in subscriptions to various OTT platforms, as viewers turned to these services for their entertainment needs.
The pandemic caused disruptions in content production, leading to delays in the release of new shows and movies and this impacted the availability of fresh content on OTT platforms. The surge in streaming led to increased internet traffic and potential strain on networks. Some regions experienced internet slowdowns and buffering issues as a result.
AI Impact
AI algorithms analyze viewer preferences, watching history and behavior to recommend relevant live streams and on-demand content, this enhances user engagement by tailoring content to individual preferences. AI has a market basket analysis algorithm in that works on the browsing history of users and recommends channels according to that. AI-powered tools automatically tag and categorize live streams based on their content, making it easier for viewers to discover and search for specific types of streams.
AI-driven voice recognition technology enables users to search for content using voice commands and control playback through voice interactions and this feature enhances user convenience and accessibility. AI algorithms monitor network conditions in real-time and adjust streaming quality based on factors like bandwidth and device capabilities, this ensures smooth playback without interruptions.
For instance, on 16 August 2023, Sabio Holdings Inc., a provider of connected TV and over-the-top advertising platforms, introduced a new AI feature within its App Science Insights analytics dashboard and this feature utilizes Natural Language Processing to automate the analysis of metrics within the dashboard, making it easier for media agencies and brands to interpret their data.
Russia- Ukraine War Impact
In regions directly affected by the conflict, there could be disruptions to internet infrastructure, which could lead to reduced accessibility to OTT platforms. However, since OTT services are usually accessible over the Internet, these disruptions might have a limited impact on users outside the conflict zones. OTT services rely on content delivery networks to ensure smooth streaming. Any disruptions or congestion in the internet infrastructure could result in buffering and lower-quality streaming experiences for users.
During times of conflict and uncertainty, people might turn to entertainment platforms, including OTT services, for distraction and relaxation and this could potentially lead to increased demand for OTT content. In some cases, governments involved in conflicts might increase content regulation or censorship, including online content, this could impact the availability of certain content on OTT platforms.
By Component
- Games Streaming
- Audio Streaming
- Video Streaming
- Communication
By Streaming Devices
- Smartphones and Tablets
- Desktops and Laptops
- IPTV and Consoles
By Monetization Model
- Subscription-based
- Advertising-based
- Transaction-based
By End-User
- Media and Entertainment
- Education and Learning
- Gaming
- Service Utilities
By Region
- North America
- U.S.
- Canada
- Mexico
- Europe
- Germany
- UK
- France
- Italy
- Russia
- Rest of Europe
- South America
- Brazil
- Argentina
- Rest of South America
- Asia-Pacific
- China
- India
- Japan
- Australia
- Rest of Asia-Pacific
- Middle East and Africa
Key Developments
- On 2 August 2023, Comedy-on-demand streaming service NextUp has partnered with sports and entertainment programmer EXTREME to offer its NextUp Live Comedy channel as a FAST channel on Virgin Media in the UK, this collaboration allows Virgin Media TV customers with compatible boxes to access hours of entertainment at no additional cost. NextUp plans to launch its FAST channels on more platforms in the near future.
- On 7 April 2023, Viaccess-Orca (VO), a global leader in providing OTT and TV platforms, content protection and advanced data solutions, has announced that Orange Belgium has launched its new TV service using Viaccess-Orca's Secure Video Player. The deployment of VO Player on TV decoders and mobile apps aims to ensure a high-quality experience for orange Belgium subscribers across all screens.
- On 24 July 2022, Vodafone Idea introduced a new offering called 'Vi One', which bundles fiber broadband, prepaid mobile services and OTT content services and this initiative is aimed at providing customers with a comprehensive and convenient package that covers their connectivity and entertainment needs.
Why Purchase the Report?
- To visualize the global OTT devices and services market segmentation based on component, streaming devices, monetization model, end-user and region, as well as understand key commercial assets and players.
- Identify commercial opportunities by analyzing trends and co-development.
- Excel data sheet with numerous data points of OTT devices and services market-level with all segments.
- PDF report consists of a comprehensive analysis after exhaustive qualitative interviews and an in-depth study.
- Product mapping available as excel consisting of key products of all the major players.
The global OTT devices and services market report would provide approximately 69 tables, 69 figures and 203 pages.
Target Audience 2023
- Manufacturers/ Buyers
- Industry Investors/Investment Bankers
- Research Professionals
- Emerging Companies
Table of Contents
1. Methodology and Scope
- 1.1. Research Methodology
- 1.2. Research Objective and Scope of the Report
2. Definition and Overview
3. Executive Summary
- 3.1. Snippet by Component
- 3.2. Snippet by Streaming Devices
- 3.3. Snippet by Monetization Model
- 3.4. Snippet by End-User
- 3.5. Snippet by Region
4. Dynamics
- 4.1. Impacting Factors
- 4.1.1. Drivers
- 4.1.1.1. Growing Partnerships Between Companies
- 4.1.1.2. Technology Advancement
- 4.1.1.3. Rising Adoption of Digital Platforms
- 4.1.2. Restraints
- 4.1.2.1. Poor Internet Connection and Regional License Agreement
- 4.1.3. Opportunity
- 4.1.4. Impact Analysis
- 4.1.1. Drivers
5. Industry Analysis
- 5.1. Porter's Five Force Analysis
- 5.2. Supply Chain Analysis
- 5.3. Pricing Analysis
- 5.4. Regulatory Analysis
- 5.5. Russia-Ukraine War Impact Analysis
- 5.6. DMI Opinion
6. COVID-19 Analysis
- 6.1. Analysis of COVID-19
- 6.1.1. Scenario Before COVID
- 6.1.2. Scenario During COVID
- 6.1.3. Scenario Post COVID
- 6.2. Pricing Dynamics Amid COVID-19
- 6.3. Demand-Supply Spectrum
- 6.4. Government Initiatives Related to the Market During Pandemic
- 6.5. Manufacturers Strategic Initiatives
- 6.6. Conclusion
7. By Component
- 7.1. Introduction
- 7.1.1. Market Size Analysis and Y-o-Y Growth Analysis (%), By Component
- 7.1.2. Market Attractiveness Index, By Component
- 7.2. Games Streaming*
- 7.2.1. Introduction
- 7.2.2. Market Size Analysis and Y-o-Y Growth Analysis (%)
- 7.3. Audio Streaming
- 7.4. Video Streaming
- 7.5. Communication
8. By Streaming Devices
- 8.1. Introduction
- 8.1.1. Market Size Analysis and Y-o-Y Growth Analysis (%), By Streaming Devices
- 8.1.2. Market Attractiveness Index, By Streaming Devices
- 8.2. Smartphones and Tablets*
- 8.2.1. Introduction
- 8.2.2. Market Size Analysis and Y-o-Y Growth Analysis (%)
- 8.3. Desktops and Laptops
- 8.4. IPTV and Consoles
9. By Monetization Model
- 9.1. Introduction
- 9.1.1. Market Size Analysis and Y-o-Y Growth Analysis (%), By Monetization Model
- 9.1.2. Market Attractiveness Index, By Monetization Model
- 9.2. Subscription-Based*
- 9.2.1. Introduction
- 9.2.2. Market Size Analysis and Y-o-Y Growth Analysis (%)
- 9.3. Advertising-based
- 9.4. Transaction-based
10. By End-User
- 10.1. Introduction
- 10.1.1. Market Size Analysis and Y-o-Y Growth Analysis (%), By End-User
- 10.1.2. Market Attractiveness Index, By End-User
- 10.2. Media and Entertainment*
- 10.2.1. Introduction
- 10.2.2. Market Size Analysis and Y-o-Y Growth Analysis (%)
- 10.3. Education and Learning
- 10.4. Gaming
- 10.5. Service Utilities
11. By Region
- 11.1. Introduction
- 11.1.1. Market Size Analysis and Y-o-Y Growth Analysis (%), By Region
- 11.1.2. Market Attractiveness Index, By Region
- 11.2. North America
- 11.2.1. Introduction
- 11.2.2. Key Region-Specific Dynamics
- 11.2.3. Market Size Analysis and Y-o-Y Growth Analysis (%), By Component
- 11.2.4. Market Size Analysis and Y-o-Y Growth Analysis (%), By Streaming Devices
- 11.2.5. Market Size Analysis and Y-o-Y Growth Analysis (%), By Monetization Model
- 11.2.6. Market Size Analysis and Y-o-Y Growth Analysis (%), By End-User
- 11.2.7. Market Size Analysis and Y-o-Y Growth Analysis (%), By Country
- 11.2.7.1. U.S.
- 11.2.7.2. Canada
- 11.2.7.3. Mexico
- 11.3. Europe
- 11.3.1. Introduction
- 11.3.2. Key Region-Specific Dynamics
- 11.3.3. Market Size Analysis and Y-o-Y Growth Analysis (%), By Component
- 11.3.4. Market Size Analysis and Y-o-Y Growth Analysis (%), By Streaming Devices
- 11.3.5. Market Size Analysis and Y-o-Y Growth Analysis (%), By Monetization Model
- 11.3.6. Market Size Analysis and Y-o-Y Growth Analysis (%), By End-User
- 11.3.6.1. Market Size Analysis and Y-o-Y Growth Analysis (%), By Country
- 11.3.6.2. Germany
- 11.3.6.3. UK
- 11.3.6.4. France
- 11.3.6.5. Italy
- 11.3.6.6. Russia
- 11.3.6.7. Rest of Europe
- 11.4. South America
- 11.4.1. Introduction
- 11.4.2. Introduction
- 11.4.3. Key Region-Specific Dynamics
- 11.4.4. Market Size Analysis and Y-o-Y Growth Analysis (%), By Component
- 11.4.5. Market Size Analysis and Y-o-Y Growth Analysis (%), By Streaming Devices
- 11.4.6. Market Size Analysis and Y-o-Y Growth Analysis (%), By Monetization Model
- 11.4.7. Market Size Analysis and Y-o-Y Growth Analysis (%), By End-User
- 11.4.8. Market Size Analysis and Y-o-Y Growth Analysis (%), By Country
- 11.4.8.1. Brazil
- 11.4.8.2. Argentina
- 11.4.8.3. Rest of South America
- 11.5. Asia-Pacific
- 11.5.1. Introduction
- 11.5.2. Key Region-Specific Dynamics
- 11.5.3. Market Size Analysis and Y-o-Y Growth Analysis (%), By Component
- 11.5.4. Market Size Analysis and Y-o-Y Growth Analysis (%), By Streaming Devices
- 11.5.5. Market Size Analysis and Y-o-Y Growth Analysis (%), By Monetization Model
- 11.5.6. Market Size Analysis and Y-o-Y Growth Analysis (%), By End-User
- 11.5.7. Market Size Analysis and Y-o-Y Growth Analysis (%), By Country
- 11.5.7.1. China
- 11.5.7.2. India
- 11.5.7.3. Japan
- 11.5.7.4. Australia
- 11.5.7.5. Rest of Asia-Pacific
- 11.6. Middle East and Africa
- 11.6.1. Introduction
- 11.6.2. Key Region-Specific Dynamics
- 11.6.3. Market Size Analysis and Y-o-Y Growth Analysis (%), By Component
- 11.6.4. Market Size Analysis and Y-o-Y Growth Analysis (%), By Streaming Devices
- 11.6.5. Market Size Analysis and Y-o-Y Growth Analysis (%), By Monetization Model
- 11.6.6. Market Size Analysis and Y-o-Y Growth Analysis (%), By End-User
12. Competitive Landscape
- 12.1. Competitive Scenario
- 12.2. Market Positioning/Share Analysis
- 12.3. Mergers and Acquisitions Analysis
13. Company Profiles
- 13.1. Panasonic*
- 13.1.1. Company Overview
- 13.1.2. Product Portfolio and Description
- 13.1.3. Financial Overview
- 13.1.4. Key Developments
- 13.2. NXP Semiconductor
- 13.3. Renesas Electronics
- 13.4. Blackberry
- 13.5. Visteon Corporation
- 13.6. Netflix, Inc.
- 13.7. Amazon
- 13.8. The Walt Disney Company
- 13.9. Tencent Holdings Ltd
- 13.10. Roku Inc.
LIST NOT EXHAUSTIVE
14. Appendix
- 14.1. About Us and Services
- 14.2. Contact Us
