|
|
市場調査レポート
商品コード
1336732
非破壊検査の世界市場-2023年~2030年Global Non Destructive Testing Market - 2023-2030 |
||||||
|
|
|||||||
カスタマイズ可能
適宜更新あり
|
|||||||


| 非破壊検査の世界市場-2023年~2030年 |
|
出版日: 2023年08月22日
発行: DataM Intelligence
ページ情報: 英文 181 Pages
納期: 即日から翌営業日
|

- 全表示
- 概要
- 目次
市場概要
世界の非破壊検査市場は、2022年に99億米ドルに達し、2023~2030年の予測期間中にCAGR 10.1%で成長し、2030年には192億米ドルに達すると予測されています。非破壊検査は、製造工程の初期段階で欠陥や不具合を特定するのに役立ち、高価な修理や交換の必要性を減らすことにつながります。コスト削減の利点から、予防保全ツールとして非破壊検査の採用が増加しています。
北米は、米国、カナダ、メキシコのような国々の存在により、最も高いCAGRで成長しています。この地域は、自動車、航空宇宙、エレクトロニクスを含む様々な産業の製造拠点です。非破壊検査は、製造された部品や材料の品質を検査・評価するために、これらの分野で広く利用されています。特に放射線を用いた非破壊検査技術は、公共建築物、橋梁、公共パイプラインの建設において非常に有用であることが証明されています。
市場力学
石油・ガス産業からの高い市場需要
石油・ガス産業は、厳しい安全・環境規制にさらされています。非破壊検査は、設備やインフラが規制基準を満たしていることを確認し、企業がコンプライアンスを維持し、罰則や法的責任を回避するのに役立ちます。非破壊検査法は、機器やインフラの状態に関する正確で詳細なデータを提供します。
石油・ガス産業における致命的な故障の結果は、人命と環境への影響の両面で深刻なものとなる可能性があります。非破壊検査は、欠陥を早期に検出し、タイムリーな介入を促進することで、このような故障を防ぐのに役立ちます。石油・ガス製品の需要が高まるにつれて、品質保証がより重視されるようになっています。非破壊検査は、業界で使用される製品や材料が要求される規格や仕様を満たしていることを保証します。
電力・エネルギー産業における非破壊検査の採用増加
電力・エネルギー産業は、高価で複雑な資産に大きく依存しています。非破壊検査は、修理、交換、改修計画を含む貴重な洞察と管理戦略を提供します。電力・エネルギー設備には複雑な構造や材料が含まれるため、従来の検査方法では課題がありました。PAUTやデジタル・ラジオグラフィなどの非破壊検査技術は、汎用性と柔軟性を提供します。
例えば、2022年9月6日、ALEIAとLAUMの共同プロジェクトであるAUTENDは、人工知能(AI)を用いて原子力発電所の検査を加速することを目的としています。このプロジェクトは、渦電流検査や超音波検査を含む原子力インフラにおける非破壊検査にAIを利用することに焦点を当てています。AIを応用することで、検査が必要な箇所を自動的に特定し、現場のアナリストの効率と対応力を向上させることを目指しています。
環境条件への影響
検査の効果は、結果の解釈や適切な検査技術の選択など、技術者の熟練度に大きく左右されます。非破壊検査は時間がかかることがあり、特に大型部品や複雑な部品では、場合によっては生産や操業の遅れにつながることがあります。
極端な温度、湿気、磁気干渉などの特定の環境条件は、非破壊検査機器の性能に影響を与え、検査精度に影響を与える可能性があります。異なる非破壊検査方法は、特定の材料や形状に対して最適に機能します。複合材料や複雑な構造のように、特定の非破壊検査技術に課題をもたらす材料もあるため、代替の方法や技術の組み合わせが必要となります。
COVID-19影響分析
移動制限の影響を軽減し、人的交流を削減するために、遠隔非破壊検査技術を導入する傾向が強まっています。企業は、ロボット工学、ドローン、最先端のセンサーベースのシステムを活用し、離れた場所で検査を実施するようになっています。遠隔検査の採用が増加していることが、この技術を推進し、このアプローチを採用する方向にシフトしています。
全体として、パンデミックの初期段階における産業活動の低下とサプライチェーンの中断により、非破壊検査市場は大幅に減速しました。それにもかかわらず、遠隔検査技術が採用され、産業活動が徐々に再開されるにつれて、市場は復活の兆しを見せ始めました。
AIの影響
多数の非破壊検査方法とセンサーからのデータの統合は、AIによって可能になります。検査員は、多くの情報源からの情報を組み合わせることによって、検査対象物や資産の状態を完全に把握することができます。非破壊検査業界は、AI技術の発展とともにさらなる発展を遂げ、多数の業界にわたる検査能力の継続的な進歩につながると予測されます。
AIを活用した画像・信号処理技術は、非破壊検査データの精度を向上させることができます。検査データの識別と分析の精度が向上し、可視化と解釈能力が強化されることで、非破壊検査市場の成長に大きく貢献します。
ロシア・ウクライナ戦争の影響
物流の問題と政治的な予測不可能性により、非破壊検査機器や部品が被災地で製造された場合、サプライチェーンが中断する可能性があります。これは、国を超えて非破壊検査製品の価格と入手可能性に影響を与える可能性があります。
重要なインフラや産業施設は、戦争の影響を直に受けた地域において、安全性を確保し損害を評価するために、より多くの非破壊検査が必要になる可能性があります。地域の非破壊検査組織と企業間の協力が紛争によって妨げられたり影響を受けたりする可能性があり、これは知識の移転と技術の進歩に影響を及ぼすであろう。
目次
第1章 調査手法と調査範囲
第2章 定義と概要
第3章 エグゼクティブサマリー
第4章 市場力学
- 影響要因
- 促進要因
- 石油・ガス産業からの高い市場需要
- 電力・エネルギー産業における非破壊検査の採用増加
- 抑制要因
- 環境条件への影響
- 必要なスキル
- 機会
- 影響分析
- 促進要因
第5章 産業分析
- ポーターのファイブフォース分析
- サプライチェーン分析
- 価格分析
- 規制分析
第6章 COVID-19分析
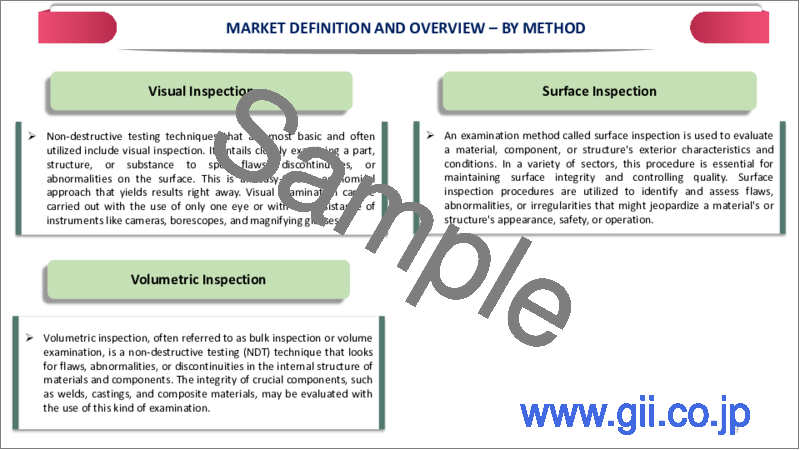
第7章 技術別
- 超音波検査
- 目視検査
- 磁粉探傷検査
- 液体浸透探傷試験
- 渦電流試験
- X線透視試験
- アコースティックエミッション試験
- その他
第8章 エンドユーザー別
- 航空宇宙・防衛
- 石油・ガス
- 製造業
- 建設
- 自動車
- 発電
- その他
第9章 地域別
- 北米
- 米国
- カナダ
- メキシコ
- 欧州
- ドイツ
- 英国
- フランス
- イタリア
- ロシア
- その他欧州
- 南米
- ブラジル
- アルゼンチン
- その他南米
- アジア太平洋
- 中国
- インド
- 日本
- オーストラリア
- その他アジア太平洋
- 中東・アフリカ
第10章 競合情勢
- 競合シナリオ
- 市況/シェア分析
- M&A分析
第11章 企業プロファイル
- Olympus Corporation
- 会社概要
- 製品ポートフォリオと説明
- 財務概要
- 主な動向
- GE Measurement and Control Solutions
- Team Inc
- Applus Services
- Mistras Group Inc
- SGS Group
- Fujifilm Corporation
- Bureau Veritas SA
- Nikon Metrology NV
- Intertek Group PLC
第12章 付録
Market Overview
Global Non-Destructive Testing Market reached US$ 9.9 billion in 2022 and is expected to reach US$ 19.2 billion by 2030, growing with a CAGR of 10.1% during the forecast period 2023-2030. Non-destructive testing helps to identify flaws and defects in the early stage of the production process leads to reducing the need for expensive repairs and replacements. The cost-saving advantage has led to the increasing adoption of non-destructive testing as a preventive maintenance tool.
North America is growing at the highest CAGR owing to the presence of countries like U.S., Canada and Mexico. The region is a manufacturing hub for various industries, which include automotive, aerospace and electronics. Non-destructive testing is widely used in these sectors to inspect and assess the quality of manufactured components and materials. Non-destructive testing techniques, particularly those involving radiation, have proven to be highly valuable in the construction of public buildings, bridges and utility pipelines.
Market Dynamics
High Market Demand from Oil and Gas Industry
The oil and gas industry is subjected to strict safety and environmental regulations. Non-destructive testing inspections ensure that equipment and infrastructure meet regulatory standards, helping companies maintain compliance and avoid penalties or legal liabilities. Non-destructive testing methods provide accurate and detailed data on the condition of equipment and infrastructure.
The consequences of a catastrophic failure in the oil and gas industry can be severe, both in terms of human lives and environmental impact. Non-destructive testing helps prevent such failures by detecting defects early and facilitating timely interventions. The demand for oil and gas products rises there is a greater emphasis on quality assurance. Non-destructive testing ensures that products and materials used in the industry meet the required standards and specifications.
Increasing Adoption of Non-Destructive Testing in Power and Energy Industries
The power and energy industry relies heavily on expensive and complex assets. Non-destructive testing provides valuable insights and management strategies that include repair, replacement or refurbishment plans. Power and energy installations involve complex structures and materials, making traditional inspection methods challenging. Non-destructive testing techniques, such as PAUT and digital radiography, offers versatility and flexibility.
For instance, on 6 September 2022, the AUTEND project, a collaboration between ALEIA , and LAUM aims to accelerate the inspection of nuclear power plants using Artificial Intelligence (AI). The project focuses on using AI for non-destructive testing in nuclear infrastructures, which involves eddy current or ultrasound inspections. By applying AI, the project aims to automatically identify areas that need inspection, improving the efficiency and responsiveness of analysts in the field.
Impact on Environmental Conditions
The effectiveness of the inspection is highly dependent on the proficiency of the technician in interpreting results and selecting the appropriate inspection techniques. Non-destructive testing inspections can be time-consuming, especially for large or intricate components which may lead to production or operational delays in certain cases.
Certain environmental conditions, such as extreme temperatures, moisture or magnetic interference, can affect the performance of non-destructive testing equipment and impact inspection accuracy. Different non-destructive testing methods work optimally with specific materials and geometries. Some materials, like composites or complex structures, create challenges for certain non-destructive testing techniques, necessitating alternative methods or combinations of techniques.
COVID-19 Impact Analysis
There was an increasing tendency towards implementing remote non-destructive testing technology in order to lessen the effects of travel restrictions and cut down on human interactions. Companies began utilizing robotics, drones and cutting-edge sensor-based systems to conduct inspections at a distance. The increasing adoption of remote inspection is driving the technology and making a shift towards adopting this approach.
Overall, due to decreased industrial activity and supply chain interruptions during the early phases of the pandemic, the non-destructive testing market slowed substantially. The market began to show indications of revival, nevertheless, as remote inspection technologies were adopted and industrial activities were gradually resumed.
AI Impact
The integration of data from numerous non-destructive testing methods and sensors is made possible by AI. Inspectors can gain a complete view of the state of the object or asset under examination by combining information from many sources. The non-destructive testing industry is projected to experience additional developments as AI technology develops, leading to continued advancements in inspection capabilities across numerous industries.
Techniques for image and signal processing powered by AI can improve the caliber of non-destructive testing data. Easier precision for identifying and analyzing inspection data is coupled with enhanced visualization and interpretation capabilities that significantly contribute to the growth of the non-destructive testing market.
Russia-Ukraine War Impact
Due to logistical issues and political unpredictability, there may be possible supply chain interruptions if non-destructive testing equipment or components are made in the affected areas. It potentially impacts the price and accessibility of non-destructive testing products across countries.
Critical infrastructure and industrial facilities may require more non-destructive testing inspections to ensure safety and assess damage in areas immediately impacted by the war. Collaborations between non-destructive testing organizations and enterprises in the region may be hampered or affected by the conflict, which would have an impact on knowledge transfer and technological advancement.
Segment Analysis
The global non-destructive testing market is segmented based on technique, end-user and region.
Aerospace Industry Boosts the Demand for Non-Destructive Testing Market
During the forecast period, aerospace is expected to grow with a significant CAGR in the global non-destructive testing market. The aerospace maintenance sector heavily relies on non-destructive testing for inspection. As the aerospace industry addresses environmental concerns, non-destructive testing plays a significant role in optimizing aircraft and spacecraft designs to reduce fuel consumption and emissions, contributing to sustainability efforts.
For example, Nasmyth TMF, a leading player in metal finishing, painting, and NDT testing for the aerospace and defense industries, gained NADCAP accreditation for its NDT services in March 2022. As a result of the company's continued complete Nadcap accreditation, the company is in a position to keep serving the aerospace and defense supply chains in U.S. and Canada.
Geographical Penetration
Asia-Pacific Witnessed Various Advancements in Non-Destructive Testing Technologies
Asia-Pacific is expected to hold around 1/4th of the global non-destructive testing market in 2022. Countries like China, Japan and India witnessed major advancements in non-destructive testing technologies which include advanced imaging techniques, robotics and data analytics, these features made the inspection process more efficient, accurate and cost-effective which leads to increased adoption of non-destructive testing.
For instance, on 15 April 2023, Mumbai-based TCR Engineering opened a new material testing and non-destructive testing center at Bhubaneswar, Odisha. The center provides equipment with various state-of-the-art equipment and hired highly skilled staff and technicians which offers comprehensive testing and analysis services to clients. The services provided at the new center include a wide range of materials testing, such as mechanical testing, chemical analysis and metallurgical testing.
Competitive Landscape
The major global players include Olympus Corporation, GE Measurement and Control Solutions, Team Inc, Applus Services, Mistras Group Inc, SGS Group, Fujifilm Corporation, Bureau Veritas SA, Nikon Metrology NV and Intertek Group PLC.
Why Purchase the Report?
- To visualize the global non-destructive testing market segmentation based on technique, end-user and region, as well as understand key commercial assets and players.
- Identify commercial opportunities by analyzing trends and co-development.
- Excel data sheet with numerous data points of non-destructive testing market-level with all segments.
- PDF report consists of a comprehensive analysis after exhaustive qualitative interviews and an in-depth study.
- Product mapping available as Excel consisting of key products of all the major players.
The global non-destructive testing market report would provide approximately 53 tables, 56 figures and 181 Pages.
Target Audience 2023
- Manufacturers/ Buyers
- Industry Investors/Investment Bankers
- Research Professionals
- Emerging Companies
Table of Contents
1. Methodology and Scope
- 1.1. Research Methodology
- 1.2. Research Objective and Scope of the Report
2. Definition and Overview
3. Executive Summary
- 3.1. Snippet by Technique
- 3.2. Snippet by End-User
- 3.3. Snippet by Region
4. Dynamics
- 4.1. Impacting Factors
- 4.1.1. Drivers
- 4.1.1.1. High Market Demand from Oil and Gas Industry
- 4.1.1.2. Increasing Adoption of Non-Destructive Testing in Power and Energy Industries
- 4.1.2. Restraints
- 4.1.2.1. Impact on Environmental Conditions
- 4.1.2.2. Required Skill People
- 4.1.3. Opportunity
- 4.1.4. Impact Analysis
- 4.1.1. Drivers
5. Industry Analysis
- 5.1. Porter's Five Force Analysis
- 5.2. Supply Chain Analysis
- 5.3. Pricing Analysis
- 5.4. Regulatory Analysis
6. COVID-19 Analysis
- 6.1. Analysis of COVID-19
- 6.1.1. Scenario Before COVID
- 6.1.2. Scenario During COVID
- 6.1.3. Scenario Post COVID
- 6.2. Pricing Dynamics Amid COVID-19
- 6.3. Demand-Supply Spectrum
- 6.4. Government Initiatives Related to the Market During Pandemic
- 6.5. Manufacturers Strategic Initiatives
- 6.6. Conclusion
7. By Technique
- 7.1. Introduction
- 7.1.1. Market Size Analysis and Y-o-Y Growth Analysis (%), By Technique
- 7.1.2. Market Attractiveness Index, By Technique
- 7.2. Ultrasonic Testing *
- 7.2.1. Introduction
- 7.2.2. Market Size Analysis and Y-o-Y Growth Analysis (%)
- 7.3. Visual Inspection Testing
- 7.4. Magnetic Particle Testing
- 7.5. Liquid Penetrant Testing
- 7.6. Eddy Current Testing
- 7.7. Radiographic Testing
- 7.8. Acoustic Emission Testing
- 7.9. Others
8. By End-User
- 8.1. Introduction
- 8.1.1. Market Size Analysis and Y-o-Y Growth Analysis (%), By End-User
- 8.1.2. Market Attractiveness Index, By End-User
- 8.2. Aerospace and Defense *
- 8.2.1. Introduction
- 8.2.2. Market Size Analysis and Y-o-Y Growth Analysis (%)
- 8.3. Oil and Gas
- 8.4. Manufacturing
- 8.5. Construction
- 8.6. Automotive
- 8.7. Power Generation
- 8.8. Others
9. By Region
- 9.1. Introduction
- 9.1.1. Market Size Analysis and Y-o-Y Growth Analysis (%), By Region
- 9.1.2. Market Attractiveness Index, By Region
- 9.2. North America
- 9.2.1. Introduction
- 9.2.2. Key Region-Specific Dynamics
- 9.2.3. Market Size Analysis and Y-o-Y Growth Analysis (%), By Technique
- 9.2.4. Market Size Analysis and Y-o-Y Growth Analysis (%), By End-User
- 9.2.5. Market Size Analysis and Y-o-Y Growth Analysis (%), By Country
- 9.2.5.1. U.S.
- 9.2.5.2. Canada
- 9.2.5.3. Mexico
- 9.3. Europe
- 9.3.1. Introduction
- 9.3.2. Key Region-Specific Dynamics
- 9.3.3. Market Size Analysis and Y-o-Y Growth Analysis (%), By Technique
- 9.3.4. Market Size Analysis and Y-o-Y Growth Analysis (%), By End-User
- 9.3.5. Market Size Analysis and Y-o-Y Growth Analysis (%), By Country
- 9.3.5.1. Germany
- 9.3.5.2. UK
- 9.3.5.3. France
- 9.3.5.4. Italy
- 9.3.5.5. Russia
- 9.3.5.6. Rest of Europe
- 9.4. South America
- 9.4.1. Introduction
- 9.4.2. Key Region-Specific Dynamics
- 9.4.3. Market Size Analysis and Y-o-Y Growth Analysis (%), By Technique
- 9.4.4. Market Size Analysis and Y-o-Y Growth Analysis (%), By End-User
- 9.4.5. Market Size Analysis and Y-o-Y Growth Analysis (%), By Country
- 9.4.5.1. Brazil
- 9.4.5.2. Argentina
- 9.4.5.3. Rest of South America
- 9.5. Asia-Pacific
- 9.5.1. Introduction
- 9.5.2. Key Region-Specific Dynamics
- 9.5.3. Market Size Analysis and Y-o-Y Growth Analysis (%), By Technique
- 9.5.4. Market Size Analysis and Y-o-Y Growth Analysis (%), By End-User
- 9.5.5. Market Size Analysis and Y-o-Y Growth Analysis (%), By Country
- 9.5.5.1. China
- 9.5.5.2. India
- 9.5.5.3. Japan
- 9.5.5.4. Australia
- 9.5.5.5. Rest of Asia-Pacific
- 9.6. Middle East and Africa
- 9.6.1. Introduction
- 9.6.2. Key Region-Specific Dynamics
- 9.6.3. Market Size Analysis and Y-o-Y Growth Analysis (%), By Technique
- 9.6.4. Market Size Analysis and Y-o-Y Growth Analysis (%), By End-User
10. Competitive Landscape
- 10.1. Competitive Scenario
- 10.2. Market Positioning/Share Analysis
- 10.3. Mergers and Acquisitions Analysis
11. Company Profiles
- 11.1. Olympus Corporation*
- 11.1.1. Company Overview
- 11.1.2. Product Portfolio and Description
- 11.1.3. Financial Overview
- 11.1.4. Key Developments
- 11.2. GE Measurement and Control Solutions
- 11.3. Team Inc
- 11.4. Applus Services
- 11.5. Mistras Group Inc
- 11.6. SGS Group
- 11.7. Fujifilm Corporation
- 11.8. Bureau Veritas SA
- 11.9. Nikon Metrology NV
- 11.10. Intertek Group PLC
LIST NOT EXHAUSTIVE
12. Appendix
- 12.1. About Us and Services
- 12.2. Contact Us
