|
|
市場調査レポート
商品コード
1336686
教育テクノロジー(EdTech)の世界市場-2023年~2030年Global Education Technology (EdTech) Market - 2023-2030 |
||||||
|
|
|||||||
カスタマイズ可能
適宜更新あり
|
|||||||


| 教育テクノロジー(EdTech)の世界市場-2023年~2030年 |
|
出版日: 2023年08月22日
発行: DataM Intelligence
ページ情報: 英文 203 Pages
納期: 即日から翌営業日
|

- 全表示
- 概要
- 目次
市場概要
世界の教育テクノロジー(EdTech)市場は、2022年に1,254億1,000万米ドルに達し、2030年には4,046億米ドルに達すると予測され、予測期間2023-2030年のCAGRは13.7%で成長する見込みです。個別化されたeラーニング体験を開発するための人工知能(Al)や機械学習(ML)技術の採用が増加していることが、市場の成長を促進しています。さらに、高速インターネットの普及が進んでいることと、スマートデバイスの販売台数が増加していることが、市場を牽引しています。
オンライン学習や遠隔学習プログラムへの投資の増加も、その柔軟性とリアルタイムのフィードバックにより、市場に好影響を与えています。クラウド展開は、予測期間中、世界の教育テクノロジー(EdTech)市場の約39.3%を占めると予測されています。クラウド展開は、定期的なデータバックアップ、運用コストの削減、低資本、高セキュリティ、常時オン機能のための迅速な展開特性を提供するため、あらゆる規模の企業を牽引しています。
市場力学
デジタル学習への嗜好の高まり
EdTechソリューションは、IoT、AI、AR/VRなどの革新的技術の進歩と並行して進化し、市場成長に大きく貢献する可能性が高いです。EdTechソリューションにおけるARとVRの組み合わせは、学習者に魅力的な体験を提供する上でメリットがあります。生徒が抽象的な概念を調べたり、結びつけたりすることを可能にし、生徒のエンゲージメントを高めます。
例えば、ハイブリッド学習や遠隔学習を提供する米国のEdTech企業であるzSpace, Inc.は、2022年1月に新しいAR/VR学習デバイスを発表しました。一方、ブロックチェーン技術の利用は、エンドユーザーが生徒や学習者の記録を保持・保護することを可能にし、教育者が学習者に提供されたコンテンツの消費パターンを調査し、データに基づいた意思決定を行うことを可能にします。
拡大するスマート教室の概念
アニメーション、マルチメディア、オーディオ、ビデオ、グラフィックスを統合し、教師や生徒の教育・学習プロセスを強化するハイテクを駆使した教室を提供することで、スマート教室はEdTech市場の成長を牽引しています。バンガロールのBruhat Bengaluru Mahangara Palike(BBMP)Schoolは、2022年3月に60のデジタル教室と、それぞれ20台のコンピュータを備えた7つのコンピュータラボを建設しました。これは、教師が3Dデジタルモデルを使って生徒を指導することで、教育を改善し、概念についてより深い知識を得ることを目的としています。
遠隔学習や数多くのマルチメディア・ツールを活用することで、スマート教室は、生徒が自宅にいながらにして教育課題をこなすことを可能にしました。また、生徒が教室のどこにいても、一緒にプロジェクトに取り組むことができます。例えば、2021年11月、ベンガル州政府はEdTech企業のSchoolnet India Limitedと協力し、専門家育成プログラムを支援し、デジタル学習を推進しました。
高いコストとデータ・プライバシーの懸念
生徒独自の要求に的を絞った質の高い教材を作成するにはコストがかかります。魅力的で成功するコンテンツを生み出すには、教育者、教科の専門家、教育デザイナーが協力しなければならないです。さらに、サードパーティの教育コンテンツを採用するためのライセンス料が、教育機関の財政負担を増大させる可能性があります。
政府、営利企業、非営利団体が協力し、リソースを結集してEdtechの取り組みに資金を提供することも考えられます。デジタルギャップを埋め、Edtechをより身近なものにするために、官民パートナーシップは経験、資金、技術を活用することができます。Edtechのサプライヤーは、サブスクリプション型サービスやライセンス契約など、柔軟な価格体系を検討することで、教育機関の支出を抑制することができます。
COVID-19影響分析
オンラインプラットフォーム、研究機関、コースの増加に伴い、COVID-19の流行は、教育におけるテクノロジーの応用の拡大に好影響を与えています。教師、教授、学生は、COVID-19の流行の結果、学校が閉鎖され、大学がバーチャル学習に移行するなど、新たな状況で作業することになっています。
現在、多くの大学や教育機関が、オープン・オンラインコースや遠隔学位を提供しています。遠隔教育における機械学習やテレプレゼンスといったテクノロジーの活用による学習効果の向上に焦点を当てた取り組みも増えています。さらに、データの重要性が、プログラムの内容や学習の改善方法の両面から、教育界で注目を集めています。
AIの影響
AIを活用したテクノロジーは、多くの子どもたちがバーチャルと対面での学習を切り替えているCOVID後の環境に、切望されていた安定性をもたらしました。生徒のアイコンタクト、キーボードやマウスの使用状況、参加状況、その他の学習意欲を示すシグナルを追跡することで、AIは生徒がバーチャル・クラスルームにどのように反応するかを特定することができます。生徒のデータをAIが分析することで、仕事の習慣、学習スタイル、その他の資質や欠点に関する重要な情報が教師や学者に提供されます。
AIは、強化された学習ツールのイントロダクションとともに、オンラインと世界中の実際の教室の両方で、教育に新たな機会をもたらします。例えば、Squirrel AI Squirrel AIは中国の大手オンライン学習スタートアップで、AIを活用したアルゴリズムでオーダーメイドのバーチャル家庭教師体験を提供しています。中国全土で1,700以上の学校に導入され、国境を越えて広がり始めています。
ロシア・ウクライナ戦争の影響
COVID-19が大流行している最中、ウクライナの都市が攻撃された結果、さらに学校が閉鎖されました。「セーブ・ザ・チルドレン」によると、ウクライナへの攻撃により、750万人の子どもたちの命と将来が危険にさらされ、最大10人の子どもたちが戦闘で殺害され、教育施設が各地で爆撃されました。多くの学生が安全な場所に逃げるために学業を中断せざるを得なかっています。国外に出ることができない者は、屋内にとどまるか、18歳の若者の場合はウクライナ軍に入隊しています。
また、2,400校以上の学校がロシア軍によって損壊または破壊され、建設負担に拍車をかけています。新学期が始まり、政府のデータによると、ウクライナ全土にある学校のうち、フルタイムの対面式教育を提供できるのは4分の1程度だっています。学校に防空壕を作るという大々的な取り組みにもかかわらず、多くは土間の地下室です。さらに、ロシアによるウクライナの電気系統と民間インフラへの意図的な侵攻は、子どもたちの健康と教育に重大なリスクをもたらしています。
目次
第1章 調査手法と調査範囲
第2章 定義と概要
第3章 エグゼクティブサマリー
第4章 市場力学
- 影響要因
- 促進要因
- デジタル学習への嗜好の高まり
- EduTechセクターへの投資の増加
- スマート教室の概念の高まり
- 抑制要因
- 高いコストとデータプライバシーへの懸念
- 機会
- 影響分析
- 促進要因
第5章 業界分析
- ポーターのファイブフォース分析
- サプライチェーン分析
- 価格分析
- 規制分析
第6章 COVID-19分析
第7章 タイプ別
- ハードウェア
- ソフトウェア
- コンテンツ
第8章 分野別
- 幼稚園
- K-12
- 高等教育
- その他
第9章 展開方式別
- クラウド
- オンプレミス
第10章 エンドユーザー別
- ビジネス
- コンシューマー
- その他
第11章 地域別
- 北米
- 米国
- カナダ
- メキシコ
- 欧州
- ドイツ
- 英国
- フランス
- イタリア
- ロシア
- その他欧州
- 南米
- ブラジル
- アルゼンチン
- その他南米
- アジア太平洋
- 中国
- インド
- 日本
- オーストラリア
- その他アジア太平洋
- 中東・アフリカ
第12章 競合情勢
- 競合シナリオ
- 市況/シェア分析
- M&A分析
第13章 企業プロファイル
- Blackboard Inc.
- 会社概要
- 製品ポートフォリオと説明
- 財務概要
- 最近の動向
- Byju's
- Chegg, Inc.
- Coursera, Inc.
- Edutech
- Edx, Inc.
- Google Llc
- Microsoft
- Instructure, Inc.
- Udacity
第14章 付録
Market Overview
Global Education Technology (EdTech) Market reached US$ 125.41 billion in 2022 and is expected to reach US$ 404.6 billion by 2030, growing with a CAGR of 13.7% during the forecast period 2023-2030. The rising adoption of artificial intelligence (Al) and machine learning (ML) technology for developing individualized eLearning experiences is driving market growth. Furthermore, the growing prevalence of high-speed internet, combined with rising sales of smart devices, is driving the market forward.
Increased investments in online learning and remote learning programs are also having a favorable impact on the market due to their flexibility and real-time feedback. Cloud deployment is estimated to account for around 39.3% of the global education technology (EdTech) market during the forecast period. Cloud deployment is driving the businesses of all sizes because it provides regular data backup, lower operational costs, lower capital, high security and rapid deployment characteristics for always-on functioning.
Market Dynamics
The Growing Preference of Digital Learning
EdTech solutions will likely evolve in parallel with advances in innovative technologies such as IoT, AI and AR/VR and to significantly contribute to market growth. The combination of AR and VR in EdTech solutions benefits in providing learners with an engaging experience. It enables students to investigate and connect with abstract concepts, which increases student engagement.
For example, zSpace, Inc., a U.S.-based EdTech company that provides hybrid or remote learning, introduced a new AR/VR learning device in January 2022 that would assist engage students with multidimensional information in a virtual world without the need for glasses. The use of blockchain technology, on the other hand, enables end-users to keep and protect records of students and learners, allowing educators to study the consumption patterns of the content supplied to the learners and make data-driven decisions.
The Growing Concept of Smart Classrooms
By providing tech-savvy classrooms that integrate animations, multimedia, audio, video and graphics to enhance teachers' and students' teaching and learning processes, smart classrooms are driving the growth of the EdTech market. Bruhat Bengaluru Mahangara Palike (BBMP) School in Bangalore built 60 digital classrooms and seven computer labs having 20 computers each in March 2022. The idea is to help teachers in teaching students using 3D digital models, thereby improving education and gaining a deeper knowledge of the concepts.
By utilizing remote learning and numerous multimedia tools, smart classrooms have enabled students to complete their educational tasks from the comfort of their own homes. It also enables students to work together on projects from wherever in the classroom. For example, in November 2021, the Bengal Government collaborated with EdTech company Schoolnet India Limited to support the professional development program and promote digital learning.
High Costs and Data Privacy Concerns
Creating high-quality educational material that is targeted to students unique requirements can be costly. To generate attractive and successful content, educators, subject matter experts and instructional designers must work together. Furthermore, licensing fees for employing third-party educational content might add to educational institutions' financial burden.
Collaborations between governments, for-profit businesses and nonprofit organizations may combine resources to fund edtech initiatives. To bridge the digital gap and make edtech more accessible, public-private partnerships can harness experience, finance and technology. Edtech suppliers can investigate flexible pricing structures, such as subscription-based services or license agreements, to help educational institutions control their expenditures.
COVID-19 Impact Analysis
With an increase in online platforms, institutes and courses, the COVID-19 pandemic has a favorable impact on the growing application of technology in education. Teachers, professors and students have found themselves working in new circumstances as a result of the COVID-19 epidemic, with schools closing and colleges shifting to virtual learning.
Many colleges and educational organizations now offer open online courses and distant degrees. There has been an increase in the number of efforts focused on improving learning effectiveness via the use of technology such as machine learning in remote education and telepresence. Furthermore, the significance of data was gaining traction in education, both in terms of program content and how it may improve learning.
AI Impact
AI-powered technology has brought much-needed stability to the post-COVID environment, where many children switch between virtual and in-person learning. By tracking students' eye contact, keyboard/mouse activity, participation and other signals of engagement, AI can identify how they respond to virtual classrooms. AI analysis of student data provides critical information to teachers and academics about work habits, learning styles and other qualities and drawbacks.
AI, with the introduction of enhanced learning tools, brings new opportunities into education both online and in real classrooms around the world. For example, Squirrel AI Squirrel AI is a major online learning startup in China that provides tailored virtual tutoring experiences with AI-powered algorithms. It has touched over 1,700 schools across the country and has begun to spread beyond its borders.
Russia- Ukraine War Impact
In the midst of the COVID-19 pandemic, the attacks on Ukrainian cities resulted in additional school closures. According to "Save the Children," the attacks on Ukraine put at risk the lives and futures of 7.5 million children, with up to ten children murdered in battle and educational facilities bombed around the country. Many students had to interrupt their studies in order to flee to safety. Individuals who are unable to leave have either remained indoors or, in the case of those as young as 18, have joined the Ukrainian army.
Over 2,400 schools have also been damaged or destroyed by the Russian military, adding to the construction burden. As the school year began, government data showed that only about a quarter of Ukrainian schools across the state could provide full-time, in-person education. Despite major initiatives to create bomb shelters for schools, many are plain, dirt-floor basements. Furthermore, Russia's intentional invasion of Ukraine's electrical system and civilian infrastructure poses significant risks to children's health and education.
Segment Analysis
The global education technology (EdTech) market is segmented based on type, sector, deployment, end-user and region.
The Rising Partnerships in Business Sector
Business end-user is expected to hold more than 65.3% of the global education technology (EdTech) market during the forecast period 2023-2030. The high share is attributed to an increase in partnerships between EdTech enterprises, educational institutions and content providers to create major prospects for the digital education sector. Therefore, partnerships and collaborations are becoming an increasingly important aspect of the emerging ecosystem.
In February 2022, GCC-Greenfield Community College along with the partnership with Upright Education is offering new skills in software development and technology, like user experience design (UX) and user interface (UI). The partnership will enable GCC students to focus on self-employment while also creating a center for a career in technology training. Incorporating technologies in the business sector also allows for immersive material and experiences, such as virtual field trips and complicated lab-based experiments, leading to an engaging learning experience.
Geographical Analysis
The Rising Internet Connectivity Drives Education Technology in Asia-Pacific
Asia-Pacific is anticipated to have a significant growth holding around 1/4th of the global education technology (EdTech) market during the forecast period 2023-2030. Developing countries such as India have seen an increase in cost-effective broadband connectivity, resulting in a rise of businesses reaching out to the public. The trend is expected to allow consumers to engage in educational learning with the help of internet access.
Furthermore, stakeholders in education in developing nations are increasingly looking to technology to fill the gap between educational infrastructure and instructional resources. For example, Teevra Edutech Pvt Ltd, an EdTech platform in India that provides personalized education with individualized courses to each student, is expanding its business in January 2022 by leveraging AI-powered tools like a recommendation engine, analytical dashboard and personalized improvement plan to bridge the gap between teacher and students.
Competitive Landscape
The major global players include Blackboard Inc., Byju's, Chegg, Inc., Coursera, Inc., Edutech, Edx, Inc., Google Llc, Microsoft, Instructure, Inc. and Udacity.
Why Purchase the Report?
- To visualize the global education technology (EdTech) market segmentation based on type, sector, deployment, end-user and region, as well as understand key commercial assets and players.
- Identify commercial opportunities by analyzing trends and co-development.
- Excel data sheet with numerous data points of education technology (EdTech) market-level with all segments.
- PDF report consists of a comprehensive analysis after exhaustive qualitative interviews and an in-depth study.
- Product mapping available as Excel consisting of key products of all the major players.
The global education technology (EdTech) market report would provide approximately 69 tables, 67 figures and 203 Pages.
Target Audience 2023
- Manufacturers/ Buyers
- Industry Investors/Investment Bankers
- Research Professionals
- Emerging Companies
Table of Contents
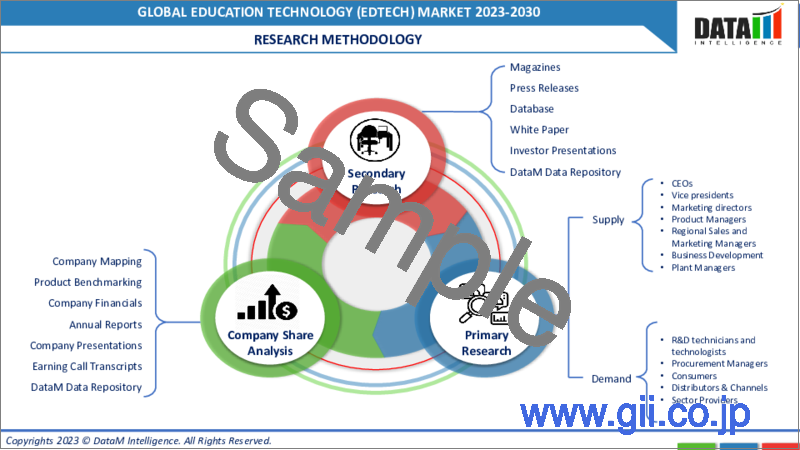
1. Methodology and Scope
- 1.1. Research Methodology
- 1.2. Research Objective and Scope of the Report
2. Definition and Overview
3. Executive Summary
- 3.1. Snippet by Type
- 3.2. Snippet by Sector
- 3.3. Snippet by Deployment
- 3.4. Snippet by End-User
- 3.5. Snippet by Region
4. Dynamics
- 4.1. Impacting Factors
- 4.1.1. Drivers
- 4.1.1.1. The Growing Preference of Digital Learning
- 4.1.1.2. The Rising Investments in EduTech Sector
- 4.1.1.3. The Growing Concept of Smart Classrooms
- 4.1.2. Restraints
- 4.1.2.1. High Costs and Data Privacy Concerns
- 4.1.3. Opportunity
- 4.1.4. Impact Analysis
- 4.1.1. Drivers
5. Industry Analysis
- 5.1. Porter's Five Force Analysis
- 5.2. Supply Chain Analysis
- 5.3. Pricing Analysis
- 5.4. Regulatory Analysis
6. COVID-19 Analysis
- 6.1. Analysis of COVID-19
- 6.1.1. Scenario Before COVID
- 6.1.2. Scenario During COVID
- 6.1.3. Scenario Post COVID
- 6.2. Pricing Dynamics Amid COVID-19
- 6.3. Demand-Supply Spectrum
- 6.4. Government Initiatives Related to the Market During Pandemic
- 6.5. Manufacturers Strategic Initiatives
- 6.6. Conclusion
7. By Type
- 7.1. Introduction
- 7.1.1. Market Size Analysis and Y-o-Y Growth Analysis (%), By Type
- 7.1.2. Market Attractiveness Index, By Type
- 7.2. Hardware*
- 7.2.1. Introduction
- 7.2.2. Market Size Analysis and Y-o-Y Growth Analysis (%)
- 7.3. Software
- 7.4. Content
8. By Sector
- 8.1. Introduction
- 8.1.1. Market Size Analysis and Y-o-Y Growth Analysis (%), By Sector
- 8.1.2. Market Attractiveness Index, By Sector
- 8.2. Preschool*
- 8.2.1. Introduction
- 8.2.2. Market Size Analysis and Y-o-Y Growth Analysis (%)
- 8.3. K-12
- 8.4. Higher Education
- 8.5. Others
9. By Deployment
- 9.1. Introduction
- 9.1.1. Market Size Analysis and Y-o-Y Growth Analysis (%), By Deployment
- 9.1.2. Market Attractiveness Index, By Deployment
- 9.2. Cloud*
- 9.2.1. Introduction
- 9.2.2. Market Size Analysis and Y-o-Y Growth Analysis (%)
- 9.3. On-Premises
10. By End-User
- 10.1. Introduction
- 10.1.1. Market Size Analysis and Y-o-Y Growth Analysis (%), By End-User
- 10.1.2. Market Attractiveness Index, By End-User
- 10.2. Business*
- 10.2.1. Introduction
- 10.2.2. Market Size Analysis and Y-o-Y Growth Analysis (%)
- 10.3. Consumer
- 10.4. Others
11. By Region
- 11.1. Introduction
- 11.1.1. Market Size Analysis and Y-o-Y Growth Analysis (%), By Region
- 11.1.2. Market Attractiveness Index, By Region
- 11.2. North America
- 11.2.1. Introduction
- 11.2.2. Key Region-Specific Dynamics
- 11.2.3. Market Size Analysis and Y-o-Y Growth Analysis (%), By Type
- 11.2.4. Market Size Analysis and Y-o-Y Growth Analysis (%), By Sector
- 11.2.5. Market Size Analysis and Y-o-Y Growth Analysis (%), By Deployment
- 11.2.6. Market Size Analysis and Y-o-Y Growth Analysis (%), By End-User
- 11.2.7. Market Size Analysis and Y-o-Y Growth Analysis (%), By Country
- 11.2.7.1. U.S.
- 11.2.7.2. Canada
- 11.2.7.3. Mexico
- 11.3. Europe
- 11.3.1. Introduction
- 11.3.2. Key Region-Specific Dynamics
- 11.3.3. Market Size Analysis and Y-o-Y Growth Analysis (%), By Type
- 11.3.4. Market Size Analysis and Y-o-Y Growth Analysis (%), By Sector
- 11.3.5. Market Size Analysis and Y-o-Y Growth Analysis (%), By Deployment
- 11.3.6. Market Size Analysis and Y-o-Y Growth Analysis (%), By End-User
- 11.3.7. Market Size Analysis and Y-o-Y Growth Analysis (%), By Country
- 11.3.7.1. Germany
- 11.3.7.2. UK
- 11.3.7.3. France
- 11.3.7.4. Italy
- 11.3.7.5. Russia
- 11.3.7.6. Rest of Europe
- 11.4. South America
- 11.4.1. Introduction
- 11.4.2. Key Region-Specific Dynamics
- 11.4.3. Market Size Analysis and Y-o-Y Growth Analysis (%), By Type
- 11.4.4. Market Size Analysis and Y-o-Y Growth Analysis (%), By Sector
- 11.4.5. Market Size Analysis and Y-o-Y Growth Analysis (%), By Deployment
- 11.4.6. Market Size Analysis and Y-o-Y Growth Analysis (%), By End-User
- 11.4.7. Market Size Analysis and Y-o-Y Growth Analysis (%), By Country
- 11.4.7.1. Brazil
- 11.4.7.2. Argentina
- 11.4.7.3. Rest of South America
- 11.5. Asia-Pacific
- 11.5.1. Introduction
- 11.5.2. Key Region-Specific Dynamics
- 11.5.3. Market Size Analysis and Y-o-Y Growth Analysis (%), By Type
- 11.5.4. Market Size Analysis and Y-o-Y Growth Analysis (%), By Sector
- 11.5.5. Market Size Analysis and Y-o-Y Growth Analysis (%), By Deployment
- 11.5.6. Market Size Analysis and Y-o-Y Growth Analysis (%), By End-User
- 11.5.7. Market Size Analysis and Y-o-Y Growth Analysis (%), By Country
- 11.5.7.1. China
- 11.5.7.2. India
- 11.5.7.3. Japan
- 11.5.7.4. Australia
- 11.5.7.5. Rest of Asia-Pacific
- 11.6. Middle East and Africa
- 11.6.1. Introduction
- 11.6.2. Key Region-Specific Dynamics
- 11.6.3. Market Size Analysis and Y-o-Y Growth Analysis (%), By Type
- 11.6.4. Market Size Analysis and Y-o-Y Growth Analysis (%), By Sector
- 11.6.5. Market Size Analysis and Y-o-Y Growth Analysis (%), By Deployment
- 11.6.6. Market Size Analysis and Y-o-Y Growth Analysis (%), By End-User
12. Competitive Landscape
- 12.1. Competitive Scenario
- 12.2. Market Positioning/Share Analysis
- 12.3. Mergers and Acquisitions Analysis
13. Company Profiles
- 13.1. Blackboard Inc.*
- 13.1.1. Company Overview
- 13.1.2. Product Portfolio and Description
- 13.1.3. Financial Overview
- 13.1.4. Recent Developments
- 13.2. Byju's
- 13.3. Chegg, Inc.
- 13.4. Coursera, Inc.
- 13.5. Edutech
- 13.6. Edx, Inc.
- 13.7. Google Llc
- 13.8. Microsoft
- 13.9. Instructure, Inc.
- 13.10. Udacity
LIST NOT EXHAUSTIVE
14. Appendix
- 14.1. About Us and Services
- 14.2. Contact Us
