|
|
市場調査レポート
商品コード
1290352
スイートポテトの世界市場:2023-2030Global Sweet Potatoes Market - 2023-2030 |
||||||
|
|
|||||||
カスタマイズ可能
適宜更新あり
|
|||||||


| スイートポテトの世界市場:2023-2030 |
|
出版日: 2023年06月12日
発行: DataM Intelligence
ページ情報: 英文 200 Pages
納期: 即日から翌営業日
|

- 全表示
- 概要
- 目次
市場概要
世界のスイートポテト市場規模は2022年に531億米ドルに達し、2030年には最大831億米ドルに達することで有利な成長を遂げると予測されます。予測期間2023-2030年のCAGRは5.9%で成長しています。
健康上の利点や料理における汎用性についての認識の高まりとともに、スイートポテト市場は成長しています。スイートポテトは、チップス、麺類、さらにはビールなど、ますます多様な製品に使用されるようになってきています。このような多様化が需要を喚起し、農家や食品メーカーに新たな機会を創出することで、スイートポテト市場の成長を後押ししています。
スイートポテトは、ビタミン、食物繊維、抗酸化物質が豊富に含まれていることで知られています。消費者が健康とウェルネスを重視し続ける中、スイートポテトのような栄養価の高い食品への需要が高まっています。
市場力学
スイートポテトの多様な調理法がスイートポテト市場の成長を促進する
調理における多様性が、スイートポテトの市場成長を促進する上で重要な役割を担っています。スイートポテトは幅広い料理に使える汎用性の高い食材であるため、消費者や食品メーカーにとって魅力的な選択肢となっています。例えば、Statistaによると、2021年、米国では1人当たり約6.3ポンドの生スイートポテトが消費されました。
消費者は、健康的で便利で汎用性の高い食品を求めるようになってきています。スイートポテトは、チップスや麺類、さらには焼き菓子など、幅広い食品に利用されています。
スイートポテトの健康的な利点がスイートポテト市場の成長を促進する
1食分のスイートポテトには、ビタミンA、ビタミンC、マンガンなどの健康成分が含まれています。例えば、200gmの焼き芋には、ビタミンAの1日あたりの摂取量(DV)の213%、ビタミンCのDVの44%、マンガンの43%、銅のDVの36%等が含まれています。さらに、免疫機能を高め、抗がん作用を持つなど、健康に役立つ可能性があります。
全体として、スイートポテトの健康上の利点は、健康志向の消費者の需要を満たし、食品産業における新製品の開発を促進することで、スイートポテト市場の成長を促進しています。
COVID-19インパクト分析
COVID-19分析では、COVID前シナリオ、COVIDシナリオ、COVID後シナリオに加え、価格力学(COVID前シナリオと比較したパンデミック中・後の価格変動を含む)、需要-供給スペクトラム(取引制限、ロックダウンおよびその後の問題による需要と供給のシフト)、政府の取り組み(政府機関による市場、セクター、産業の活性化に関する取り組み)、メーカー戦略的取り組み(COVID問題を軽減するためのメーカーによる取り組み)についても解説します。
目次
第1章 調査手法とスコープ
- 調査手法
- 調査目的および調査範囲
第2章 定義と概要
第3章 エグゼクティブサマリー
- 品種別スニペット
- 製品別
- 供給方法別
- 性質別
- エンドユーザー別
- 地域別
第4章 市場力学
- 影響要因
- 促進要因
- 抑制要因
- 機会
- 影響分析
第5章 産業分析
- ポーターのファイブフォース分析
- サプライチェーン分析
- 価格分析
- 法規制の分析
第6章 COVID-19の分析
- COVID-19の分析
- COVID-19の前のシナリオ
- COVID-19実施中のシナリオ
- COVID-19後のシナリオ
- COVID-19の中での価格・ダイナミクス
- 需給スペクトル
- パンデミック時の市場に関連する政府の取り組み
- メーカー別戦略的な取り組み
- サマリー
第7章 品種別
- ジュエル
- パープル
- ジャパニーズ
- ハンナ
- ガーネット
- カロライナ
- その他
第8章 製品別
- 製品全体
- 加工品
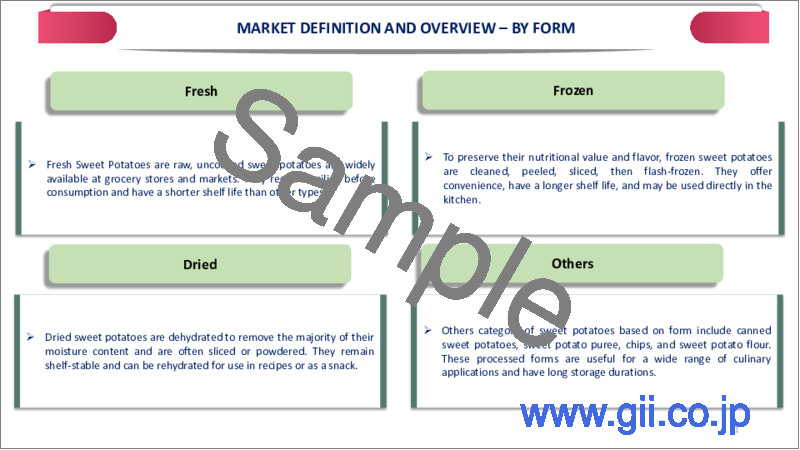
第9章 供給方法別
- 生鮮
- 冷凍
- 乾燥
- その他
第10章 性質別
- 従来型
- オーガニック
第11章 エンドユーザー別
- 家庭用
- ホテル・レストラン
- 飲食品メーカー
- その他
第12章 地域別
- 北米
- 米国
- カナダ
- メキシコ
- 欧州
- ドイツ
- 英国
- フランス
- イタリア
- スペイン
- その他欧州
- 南米
- ブラジル
- アルゼンチン
- その他南米地域
- アジア太平洋地域
- 中国
- インド
- 日本
- オーストラリア
- その他アジア太平洋地域
- 中東・アフリカ地域
第13章 競合情勢
- 競合シナリオ
- 市況ポジショニング/シェア分析
- M&A(合併・買収)分析
第14章 企業プロファイル
- Harm Farms
- 会社概要
- 製品ポートフォリオと説明
- 財務概要
- 主な発展状況
- Sweet Potato Spirit Company
- Nash Produce
- Conagra Brands, Inc.
- Dole Food Company, Inc.
- Carolina Innovative Food Ingredients
- A.V. Thomas Produce
- Jackson Farming Company
- Lamb Weston Holdings, Inc.
- J.R. Simplot Company
第15章 付録
Market Overview
The Global Sweet Potatoes Market size reached US$ 53.1 billion in 2022 and is projected to witness lucrative growth by reaching up to US$ 83.1 billion by 2030. The market is growing at a CAGR of 5.9% during the forecast period 2023-2030.
With the growing awareness of their health benefits and versatility in cooking, the sweet potato market is growing. Sweet potatoes are being used in an increasing variety of products, including chips, noodles and even beer. This diversification is driving demand and creating new opportunities for farmers and food manufacturers which boosts the sweet potato market growth.
Sweet potatoes are renowned for having a high concentration of vitamins, fiber and antioxidants. The demand for nutrient-dense foods like sweet potatoes has grown as consumers continue to place a premium on health and wellness.
Market Dynamics
Versatility in Cooking Sweet Potatoes is Driving the Growth of the Sweet Potatoes Market
Versatility in cooking has played a significant role in driving the market growth of sweet potatoes. Sweet potatoes are a versatile ingredient that can be used in a wide range of dishes, making them an attractive option for consumers and food manufacturers alike. For instance, in 2021, the U.S. consumed around 6.3 pounds of fresh sweet potatoes per person, according to Statista.
Consumers are increasingly looking for foods that are healthy, convenient and versatile. Sweet potatoes have been used in a wide range of food products, including chips, noodles and even baked goods.
The Health Benefits of Sweet Potatoes Fuel the Sweet Potato Market Growth
Each serving of sweet potatoes has a healthy dose of vitamin A, vitamin C and Manganese. For instance, 200gm of baked sweet potato offers 213% of the daily value(DV) of Vitamin A, 44% of DV of Vitamin C, 43% of manganese, 36% of DV of copper, etc. Additionally, they may boost immune function, have anti-cancer properties and provide other health advantages.
Overall, the health benefits of sweet potatoes are driving the sweet potato market growth by meeting the demand of health-conscious consumers and promoting the development of new products in the food industry.
COVID-19 Impact Analysis
The COVID-19 Analysis includes Pre-COVID Scenario, COVID Scenario and Post-COVID Scenario along with Pricing Dynamics (Including pricing change during and post-pandemic comparing it with pre-COVID scenarios), Demand-Supply Spectrum (Shift in demand and supply owing to trading restrictions, lockdown and subsequent issues), Government Initiatives (Initiatives to revive market, sector or Industry by Government Bodies) and Manufacturers Strategic Initiatives (What manufacturers did to mitigate the COVID issues will be covered here).
Segment Analysis
The global sweet potato market is segmented based on variety, product, supply method, nature, end-user and region.
Increasing Focus on Organic Farming is Expected to Drive the Segment Growth
Based on nature, sweet potato is classified into conventional and organic.
In 2022, organic sweet potatoes have a significant share of the sweet potato market. Organic farming practices are perceived as being healthier and more environmentally friendly than conventional farming methods.
For instance, The U.S. market for organic food has been expanding for over a decade and is today worth over 57 billion dollars. Consumers who prioritize health and sustainability are more likely to choose organic sweet potatoes over conventionally grown sweet potatoes. This trend is expected to continue, driving further growth in the organic sweet potato market.
Geographical Analysis
Rising Consumption of Sweet Potatoes in North America is Expected to Drive the Market Growth in this Region.
In 2022, North America has a significant share of the sweet potato market. Sweet potatoes have been a staple in traditional American cuisine for centuries, particularly in the southern United States. This has contributed to the popularity of sweet potatoes in North America, as well as the development of unique sweet potato dishes and recipes.
For instance, according to Statista, the U.S. consumed about 6.3 pounds of fresh sweet potatoes per person in 2021. North America is home to several large sweet potato growers and processors, such as the North Carolina Sweet Potato Commission and the Louisiana Sweet Potato Commission.
Competitive Landscape
The major global players in the market include: Ham Farms, Sweet Potato Spirit Company, Nash Produce, Conagra Brands, Inc., Dole Food Company, Inc., Carolina Innovative Food Ingredients, A.V. Thomas Produce and Jackson Farming Company, Lamb Weston Holdings, Inc., J.R. Simplot Company.
Why Purchase the Report?
- To visualize the Sweet Potatoes market segmentation based on variety, product, supply method, nature, end-user and region, as well as understand key commercial assets and players.
- Identify commercial opportunities by analyzing trends and co-development.
- Excel data sheet with numerous data points of sweet potatoes market-level with all segments.
- PDF report consists of a comprehensive analysis after exhaustive qualitative interviews and an in-depth study.
- Product mapping available as Excel consisting of key products of all the major players.
The Sweet Potatoes Market Report Would Provide Approximately 77 Tables, 81 Figures and 200 pages.
Target Audience 2023
- Manufacturers / Buyers
- Industry Investors/Investment Bankers
- Research Professionals
- Emerging Companies
Table of Contents
1. Methodology and Scope
- 1.1. Research Methodology
- 1.2. Research Objective and Scope of the Report
2. Definition and Overview
3. Executive Summary
- 3.1. Snippet by Variety
- 3.2. Snippet by Product
- 3.3. Snippet by Supply Method
- 3.4. Snippet by Nature
- 3.5. Snippet by End-User
- 3.6. Snippet by Region
4. Dynamics
- 4.1. Impacting Factors
- 4.1.1. Drivers
- 4.1.2. Restraints
- 4.1.3. Opportunity
- 4.1.4. Impact Analysis
5. Industry Analysis
- 5.1. Porter's Five Force Analysis
- 5.2. Supply Chain Analysis
- 5.3. Pricing Analysis
- 5.4. Regulatory Analysis
6. COVID-19 Analysis
- 6.1. Analysis of COVID-19
- 6.1.1. Scenario Before COVID-19
- 6.1.2. Scenario During COVID-19
- 6.1.3. Scenario Post COVID-19
- 6.2. Pricing Dynamics Amid COVID-19
- 6.3. Demand-Supply Spectrum
- 6.4. Government Initiatives Related to the Market During the Pandemic
- 6.5. Manufacturers' Strategic Initiatives
- 6.6. Conclusion
7. By Variety
- 7.1. Introduction
- 7.1.1. Market Size Analysis and Y-o-Y Growth Analysis (%), By Variety
- 7.1.2. Market Attractiveness Index, By Variety
- 7.2. Jewel*
- 7.2.1. Introduction
- 7.2.2. Market Size Analysis and Y-o-Y Growth Analysis (%)
- 7.2.3. Purple
- 7.3. Japanese
- 7.4. Hannah
- 7.5. Garnet
- 7.6. Carolina
- 7.7. Others
8. By Product
- 8.1. Introduction
- 8.1.1. Market Size Analysis and Y-o-Y Growth Analysis (%), By Product
- 8.1.2. Market Attractiveness Index, By Product
- 8.2. Whole Product*
- 8.2.1. Introduction
- 8.2.2. Market Size Analysis and Y-o-Y Growth Analysis (%)
- 8.3. Processed
9. By Supply Method
- 9.1. Introduction
- 9.1.1. Market Size Analysis and Y-o-Y Growth Analysis (%), By Supply Method
- 9.1.2. Market Attractiveness Index, By Supply Method
- 9.2. Fresh*
- 9.2.1. Introduction
- 9.2.2. Market Size Analysis and Y-o-Y Growth Analysis (%)
- 9.3. Frozen
- 9.4. Dried
- 9.5. Others
10. By Nature
- 10.1. Introduction
- 10.1.1. Market Size Analysis and Y-o-Y Growth Analysis (%), By Nature
- 10.1.2. Market Attractiveness Index, By Nature
- 10.2. Conventional*
- 10.2.1. Introduction
- 10.2.2. Market Size Analysis and Y-o-Y Growth Analysis (%)
- 10.3. Organic
11. By End-User
- 11.1. Introduction
- 11.1.1. Market Size Analysis and Y-o-Y Growth Analysis (%), By End-User
- 11.1.2. Market Attractiveness Index, By End-User
- 11.1.3. Household*
- 11.1.4. Introduction
- 11.1.5. Market Size Analysis and Y-o-Y Growth Analysis (%)
- 11.2. Hotel & Restaurants
- 11.3. Food & Beverage Manufacturers
- 11.4. Others
12. By Region
- 12.1. Introduction
- 12.1.1. Market Size Analysis and Y-o-Y Growth Analysis (%), By Region
- 12.1.2. Market Attractiveness Index, By Region
- 12.2. North America
- 12.2.1. Introduction
- 12.2.2. Key Region-Specific Dynamics
- 12.2.3. Market Size Analysis and Y-o-Y Growth Analysis (%), By Variety
- 12.2.4. Market Size Analysis and Y-o-Y Growth Analysis (%), By Product
- 12.3. Market Size Analysis and Y-o-Y Growth Analysis (%), By Supply Method
- 12.4. Market Size Analysis and Y-o-Y Growth Analysis (%), By Nature
- 12.5. Market Size Analysis and Y-o-Y Growth Analysis (%), By End-User
- 12.5.1. Market Size Analysis and Y-o-Y Growth Analysis (%), By Country
- 12.5.1.1.1. The U.S.
- 12.5.1.1.2. Canada
- 12.5.1.1.3. Mexico
- 12.5.1. Market Size Analysis and Y-o-Y Growth Analysis (%), By Country
- 12.6. Europe
- 12.6.1. Introduction
- 12.6.2. Key Region-Specific Dynamics
- 12.6.3. Market Size Analysis and Y-o-Y Growth Analysis (%), By Variety
- 12.6.4. Market Size Analysis and Y-o-Y Growth Analysis (%), By Product
- 12.7. Market Size Analysis and Y-o-Y Growth Analysis (%), By Supply Method
- 12.8. Market Size Analysis and Y-o-Y Growth Analysis (%), By Nature
- 12.9. Market Size Analysis and Y-o-Y Growth Analysis (%), By End-User
- 12.9.1. Market Size Analysis and Y-o-Y Growth Analysis (%), By Country
- 12.9.1.1.1. Germany
- 12.9.1.1.2. The UK
- 12.9.1.1.3. France
- 12.9.1.1.4. Italy
- 12.9.1.1.5. Spain
- 12.9.1.1.6. Rest of Europe
- 12.9.1. Market Size Analysis and Y-o-Y Growth Analysis (%), By Country
- 12.10. South America
- 12.10.1. Introduction
- 12.10.2. Key Region-Specific Dynamics
- 12.10.3. Market Size Analysis and Y-o-Y Growth Analysis (%), By Variety
- 12.10.4. Market Size Analysis and Y-o-Y Growth Analysis (%), By Product
- 12.11. Market Size Analysis and Y-o-Y Growth Analysis (%), By Supply Method
- 12.12. Market Size Analysis and Y-o-Y Growth Analysis (%), By Nature
- 12.13. Market Size Analysis and Y-o-Y Growth Analysis (%), By End-User
- 12.13.1. Market Size Analysis and Y-o-Y Growth Analysis (%), By Country
- 12.13.1.1.1. Brazil
- 12.13.1.1.2. Argentina
- 12.13.1.1.3. Rest of South America
- 12.13.1. Market Size Analysis and Y-o-Y Growth Analysis (%), By Country
- 12.14. Asia-Pacific
- 12.14.1. Introduction
- 12.14.2. Key Region-Specific Dynamics
- 12.14.3. Market Size Analysis and Y-o-Y Growth Analysis (%), By Variety
- 12.14.4. Market Size Analysis and Y-o-Y Growth Analysis (%), By Product
- 12.15. Market Size Analysis and Y-o-Y Growth Analysis (%), By Supply Method
- 12.16. Market Size Analysis and Y-o-Y Growth Analysis (%), By Nature
- 12.17. Market Size Analysis and Y-o-Y Growth Analysis (%), By End-User
- 12.17.1. Market Size Analysis and Y-o-Y Growth Analysis (%), By Country
- 12.17.1.1.1. China
- 12.17.1.1.2. India
- 12.17.1.1.3. Japan
- 12.17.1.1.4. Australia
- 12.17.1.1.5. Rest of Asia-Pacific
- 12.17.1. Market Size Analysis and Y-o-Y Growth Analysis (%), By Country
- 12.18. Middle East and Africa
- 12.18.1. Introduction
- 12.18.2. Key Region-Specific Dynamics
- 12.18.3. Market Size Analysis and Y-o-Y Growth Analysis (%), By Variety
- 12.18.4. Market Size Analysis and Y-o-Y Growth Analysis (%), By Product
- 12.19. Market Size Analysis and Y-o-Y Growth Analysis (%), By Supply Method
- 12.20. Market Size Analysis and Y-o-Y Growth Analysis (%), By Nature
- 12.21. Market Size Analysis and Y-o-Y Growth Analysis (%), By End-User
13. Competitive Landscape
- 13.1. Competitive Scenario
- 13.2. Market Positioning/Share Analysis
- 13.3. Mergers and Acquisitions Analysis
14. Company Profiles
- 14.1. Harm Farms*
- 14.1.1. Company Overview
- 14.1.2. Product Portfolio and Description
- 14.1.3. Financial Overview
- 14.1.4. Key Developments
- 14.2. Sweet Potato Spirit Company
- 14.3. Nash Produce
- 14.4. Conagra Brands, Inc.
- 14.5. Dole Food Company, Inc.
- 14.6. Carolina Innovative Food Ingredients
- 14.7. A.V. Thomas Produce
- 14.8. Jackson Farming Company
- 14.9. Lamb Weston Holdings, Inc.
- 14.10. J.R. Simplot Company
- 14.11. LIST NOT EXHAUSTIVE
15. Appendix
- 15.1. About Us and Services
- 15.2. Contact Us