|
|
市場調査レポート
商品コード
1171657
太陽電池輸出の中国市場:2023年~2032年Research Report on China's Solar Cell Export 2023-2032 |
||||||
|
|
|||||||


| 太陽電池輸出の中国市場:2023年~2032年 |
|
出版日: 2022年12月13日
発行: China Research and Intelligence
ページ情報: 英文 50 Pages
納期: 即日から翌営業日
|
- 全表示
- 概要
- 目次
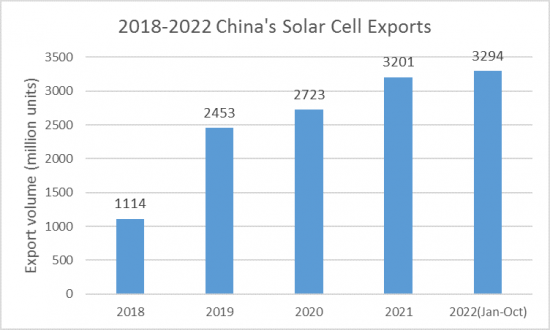
世界の電源に占める再生可能エネルギーの割合が拡大する中、太陽光発電のシェアが徐々に高まっています。中国は世界有数の太陽電池輸出国であり、毎年大量の太陽電池を輸出しています。2021年、中国は輸出数量で前年比17.56%増の32億100万枚となり、輸出金額は前年比43.79%増の284億6,000万米ドルに達しました。2022年1月~10月までの期間、輸出数量で前年比24.06%増の32億9,400万枚となり、輸出金額は前年比75.58%増の400億3,300万米ドルに達しました。
当レポートでは、中国の太陽電池輸出について調査し、中国の輸出規模、太陽電池タイプ別分析、主要輸出先分析、輸出展望等に関する情報を提供しています。
サンプルビュー
目次
第1章 中国の太陽電池輸出分析:2018年~2022年
- 中国の太陽電池輸出規模
- 中国の太陽電池輸出数量
- 中国の太陽電池輸出金額
- 中国の太陽電池輸出価格
- 中国の太陽電池の主要輸出先
- 輸出数量別
- 輸出金額別
第2章 中国の単結晶シリコン太陽電池の輸出分析:2018年~2022年
- 単結晶シリコン太陽電池の輸出数量
- 単結晶シリコン太陽電池の輸出金額
- 単結晶シリコン太陽電池の輸出価格
- 単結晶シリコン太陽電池の輸出先
- 輸出数量別
- 輸出金額別
第3章 中国の多結晶太陽電池の輸出分析:2018年~2022年
- 多結晶太陽電池の輸出数量
- 多結晶太陽電池の輸出金額
- 多結晶太陽電池の輸出価格
- 多結晶太陽電池の輸出先
- 輸出数量別
- 輸出金額別
第4章 中国のアモルファスシリコン薄膜太陽電池の輸出分析:2018年~2022年
- アモルファスシリコン薄膜太陽電池の輸出数量
- アモルファスシリコン薄膜太陽電池の輸出金額
- アモルファスシリコン薄膜太陽電池の輸出価格
- アモルファスシリコン薄膜太陽電池の輸出先
- 輸出数量別
- 輸出金額別
第5章 中国のその他の太陽電池の輸出分析:2018年~2022年
- その他の太陽電池の輸出数量
- その他の太陽電池の輸出金額
- その他の太陽電池の輸出価格
- その他の太陽電池の輸出先
- 輸出数量別
- 輸出金額別
第6章 中国の太陽電池の主要輸出先分析:2018年~2022年
- インド
- トルコ
- ベトナム
- 韓国
- ドイツ
- オランダ
- その他の輸出先
第7章 中国の太陽電池における輸出展望:2023年~2032年
- 中国の太陽電池輸出に影響を与える要因
- 有利な要因
- 不利な要因
- 中国の太陽電池輸出の予測:2023年~2032年
- 輸出数量予測
- 主要輸出先予測
- 主要輸出太陽電池タイプ予測
A solar cell is a device that generates electricity directly from sunlight. As the proportion of renewable energy sources in global electricity sources expands, the market share of solar power generation is gradually increasing.
SAMPLE VIEW
China is the world's leading exporter of solar cells, exporting a large number of solar cells every year. According to CRI's analysis, in 2021, China exported 3.201 billion solar cells, up 17.56% year-on-year, with an export value of US$28.460 billion, up 43.79% year-on-year. From January to October 2022, China exported 3.294 billion solar cells, up 24.06% year-on-year, with an export value of US$40.033 billion, up 75.58% year-on-year.
In 2018-2022, the average price of China's solar cell exports showed an overall change trend of first decrease and then increase. In 2018-2020, the average price of China's solar cell exports fell continuously, from US$12.18 each in 2018 to US$7.27 each in 2020. In 2021-2022, the average price of China's solar cell exports rose continuously. From January to October 2022, the average price of China's solar cell exports was US$12.15 each, up 41.53% year-on-year.
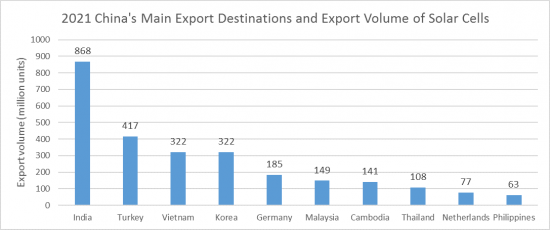
In 2021, China exported solar cells to more than two hundred countries and regions around the world. CRI analysis shows that India, Turkey, Vietnam, South Korea, Germany, Malaysia, Cambodia, Thailand, the Netherlands and the Philippines are China's major solar cell export destinations by export volume. Among them, India is the largest exporter of solar cells from China.
In 2021, China exported 868 million solar cells to India, accounting for 27.11% of the total solar cell exports in that year, with an export value of US$3.914 billion, accounting for 13.75% of the total export value. By export value, then the Netherlands is the largest country in China's solar cell exports, and in 2021, China's solar cell exports to the Netherlands amounted to US$5.990 billion, accounting for 21.05% of the total exports.
China is a major global producer and exporter of solar cells, and CRI expects China's solar cell exports to continue to rise from 2023-2032 as the global new energy sector grows.
Topics covered:
- China's Solar Cell Export Status and Major Sources in 2018-2022
- What is the Impact of COVID-19 on China's Solar Cell Export?
- Which Companies are the Major Players in China's Solar Cell Export Market and What are their Competitive Benchmarks?
- Key Drivers and Market Opportunities in China's Solar Cell Export
- What are the Key Drivers, Challenges, and Opportunities for China's Solar Cell Export during 2023-2032?
- What is the Expected Revenue of China's Solar Cell Export during 2023-2032?
- What are the Strategies Adopted by the Key Players in the Market to Increase Their Market Share in the Industry?
- What are the Competitive Advantages of the Major Players in China's Solar Cell Export Market?
- Which Segment of China's Solar Cell Export is Expected to Dominate the Market in 2032?
- What are the Major Adverse Factors Facing China's Solar Cell Export?
Table of Contents
1. 2018-2022 China Solar Cell Export Analysis
- 1.1. China's Solar Cell Export Scale
- 1.1.1. China's Solar Cell Export Volume
- 1.1.2. China's Solar Cells Export Value
- 1.1.3. China Solar Cells Export Price
- 1.2. China's Main Export Destinations of Solar Cells
- 1.2.1. By Export Volume
- 1.2.2. By Export Value
2. 2018-2022 China's Export Analysis of Monocrystalline Silicon Solar Cells
- 2.1. Export Volume of Monocrystalline Solar Cells
- 2.2. Export Value of Monocrystalline Solar Cells
- 2.3. Export Price of Monocrystalline Solar Cells
- 2.4 Export Destinations of Monocrystalline Solar Cells
- 2.4.1. By Export Volume
- 2.4.2. By Export Value
3. 2018-2022 China Polycrystalline Solar Cells Export Analysis
- 3.1. Export Volume of Polycrystalline Solar Cells
- 3.2. Export Value of Polycrystalline Solar Cells
- 3.3. Export Price of Polycrystalline Solar Cells
- 3.4 Export Destinations of Polycrystalline Solar Cells
- 3.4.1. By Export Volume
- 3.4.2. By Export Value
4. 2018-2022 China Amorphous Silicon Thin Film Solar Cells Export Analysis
- 4.1. Export Volume of Amorphous Silicon Thin Film Solar Cells
- 4.2. Export Value of Amorphous Silicon Thin Film Solar Cells
- 4.3. Export Price of Amorphous Silicon Thin Film Solar Cells
- 4.4. Export Destinations of Amorphous Silicon Thin Film Solar Cells
- 4.4.1. By Export Volume
- 4.4.2. By Export Value
5. 2018-2022 China Other Solar Cells Export Analysis
- 5.1. Other Solar Cells Export Volume
- 5.2. Other Solar Cells Export Value
- 5.3. Other Solar Cells Export Price
- 5.4. Other Solar Cells Export Destinations
- 5.4.1. By Export Volume
- 5.4.2. By Export Value
6. 2018-2022 China Solar Cells Major Export Destinations Analysis
- 6.1. India
- 6.2. Turkey
- 6.3. Vietnam
- 6.4. South Korea
- 6.5. Germany
- 6.6. Netherlands
- 6.7. Other Export Destinations
7. China's Export Outlook for Solar Cells, 2023-2032
- 7.1 Factors Affecting China's Solar Cell Exports
- 7.1.1 Favorable Factors
- 7.1.2. Unfavorable Factors
- 7.2. China's Solar Cell Export Forecast, 2023-2032
- 7.2.1. Export Volume Forecast
- 7.2.2. Major Export Destinations Forecast
- 7.2.3. Major Exported Solar Cell Types Forecast