|
|
市場調査レポート
商品コード
1215403
エネルギー向け人工知能(AI)の世界市場規模調査・予測:コンポーネントタイプ別、アプリケーション別、エンドユーザー別、展開タイプ別、地域別分析、2022-2029年Global AI in Energy Market Size study & Forecast, by Component Type, By Application, By End user, By Deployment Type and Regional Analysis, 2022-2029 |
||||||
|
|
|||||||
|
● お客様のご希望に応じて、既存データの加工や未掲載情報(例:国別セグメント)の追加などの対応が可能です。 詳細はお問い合わせください。 |
|||||||


| エネルギー向け人工知能(AI)の世界市場規模調査・予測:コンポーネントタイプ別、アプリケーション別、エンドユーザー別、展開タイプ別、地域別分析、2022-2029年 |
|
出版日: 2023年02月08日
発行: Bizwit Research & Consulting LLP
ページ情報: 英文
納期: 2~3営業日
|
- 全表示
- 概要
- 図表
- 目次
世界のエネルギー分野におけるAI市場は、2021年に約40億米ドルと評価され、予測期間2022-2029年には17.4%以上の健全な成長率で成長すると予想されています。
AIベースのソリューションとサービスは、エネルギー消費のより良い制御と管理を支援し、ネットワークの誤動作を予測し最適化するために、電力およびエネルギー部門全体で使用されています。さらに、AIは、家庭、企業、蓄電池、再生可能エネルギー源、マイクログリッド、電力網の間のエネルギーの流れを管理することにより、エネルギーグリッドの最適化に向けて活用されています。さらに、予測分析に基づいて、エネルギー会社は将来のエネルギー需要にアクセスすることができ、エネルギー盗取や送電網からのエネルギーの違法盗取を検出することも可能です。世界のエネルギー需要の増加、スマートメーターやスマートホームソリューションの採用拡大が、市場の成長を加速させる主な要因となっています。
世界のエネルギー需要は、都市部の拡大や新興国における産業活動の拡大により急速に増加しており、これが世界のエネルギー分野におけるAI市場の成長にも寄与しています。例えば、Statistaによると、2019年の世界の再生可能エネルギー消費量は74エクサジュールと推定され、2050年の再生可能エネルギー消費量は247エクサジュールに成長すると予測されています。さらに、市場成長を加速させるもう一つの要因として、スマートグリッドへの投資の増加が挙げられます。例えば、国際エネルギー機関(IEA)の推計によると-2019年、米国は送電網の近代化に約710億米ドルを投じ、この金額は2021年にはさらに840億米ドルに増加しました。さらに、2022年2月には、インド再生可能エネルギー機関(IRENA)と中国国家電網公司(SGCC)が、電力網のアップグレードと新しい電力システムの構築のために、2021~2025年に3500億米ドルの投資を発表しました。また、エネルギー部門の近代化に向けた投資の増加や、AI・ML技術の進歩の高まりは、予測期間中に市場に有利な成長見通しを生み出すと思われます。しかし、AIベースのサービス&ソリューションに関連する高コストは、2022年から2029年の予測期間を通して市場成長を阻害します。
エネルギーにおけるAIの世界市場の調査において考慮された主要地域は、アジア太平洋、北米、欧州、中南米、世界のその他の地域です。北米は、大手市場プレイヤーの優位性と、同地域におけるエネルギー流通設備の近代化に向けた投資の増加により、収益面で市場を独占しています。一方、アジア太平洋地域は、産業部門からのエネルギー需要の増加や、同地域のエネルギー部門の進歩に向けた政府当局の好ましい取り組みなどの要因から、予測期間中に最高のCAGRで成長すると予想されます。
本調査の目的は、近年におけるさまざまなセグメントと国の市場規模を明らかにし、今後数年間の市場規模を予測することにあります。本レポートは、調査対象国における産業の質的・量的な側面を取り込むように設計されています。
また、市場の将来的な成長を規定する促進要因や課題などの重要な側面に関する詳細な情報も提供しています。さらに、主要企業の競合情勢や製品提供の詳細な分析とともに、利害関係者が投資するためのミクロ市場の潜在的な機会も組み込んでいます。
コンポーネントタイプ別
ソリューション
サービス
アプリケーション別
ロボティクス
再生可能エネルギー管理
需要予測
安全・安心
インフラ
その他
エンドユーザー別
エネルギー伝送
エネルギー発電
エネルギー配給
ユーティリティ
導入形態別
オンプレミス
クラウド
目次
第1章 エグゼクティブサマリー
- 市場スナップショット
- 世界・セグメント別市場の推定・予測、2019年~2029年
- エネルギー分野のAI市場:地域別、2019年~2029年
- エネルギーにおけるAI市場:コンポーネントタイプ別、2019年~2029年
- エネルギーにおけるAI市場:アプリケーション別、2019年~2029年
- AI in Energy市場:エンドユーザー別、2019年~2029年
- AI in Energy市場:デプロイメントタイプ別、2019年~2029年
- 主な動向
- 調査手法の概要
- 調査前提条件
第2章 世界のAI in Energy市場の定義と範囲
- 調査の目的
- 市場の定義と範囲
- 調査対象範囲
- 産業の進化
- 調査対象年
- 通貨換算レート
第3章 世界のAI in Energy市場力学
- エネルギーにおけるAI市場のインパクト分析(2019年~2029年)
- 市場促進要因
- 世界のエネルギー需要の増加
- スマートメーターやスマートホームソリューションの採用拡大
- 市場の課題
- AIソリューションに関連する高い導入コスト
- 市場機会
- エネルギーセクターの近代化に向けた投資の増加
- AIとML技術の進歩の高まり
- 市場促進要因
第4章 世界のエネルギー分野におけるAI市場の産業分析
- ポーターの5フォースモデル
- 供給企業の交渉力
- 買い手の交渉力
- 新規参入業者の脅威
- 代替品の脅威
- 競争企業間の敵対関係
- ポーターの5フォースモデルへの未来的アプローチ(2019-2029年)
- PEST分析
- 政治的
- 経済的
- 社会的
- 技術的
- トップ投資機会
- 主要成功戦略
- 業界専門家別展望
- アナリストの結論・提言
第5章 リスク評価:COVID-19のインパクト
- COVID-19が業界に与える全体的な影響の評価
- COVID-19以前とCOVID-19以後の市場シナリオ
第6章 エネルギー分野におけるAIの世界市場:コンポーネントタイプ別
- 市場スナップショット
- エネルギーにおけるAIの世界市場、コンポーネントタイプ別、パフォーマンス-ポテンシャル分析
- エネルギーにおけるAIの世界市場、コンポーネントタイプ別推定・予測2019-2029
- AI in Energy市場、サブセグメント分析
- ソリューション
- サービス
第7章:エネルギー分野におけるAIの世界市場:アプリケーション別
- 市場スナップショット
- エネルギーにおけるAIの世界市場:アプリケーション別、パフォーマンス-ポテンシャル分析
- エネルギーにおけるAIの世界市場、アプリケーション別推定・予測2019-2029
- エネルギー分野のAI市場、サブセグメント分析
- ロボティクス
- 再生可能エネルギー管理
- 需要予測
- 安全・セキュリティ
- インフラ
- その他
第8章 エネルギー分野におけるAIの世界市場:エンドユーザー別
- 市場スナップショット
- エネルギー分野におけるAIの世界市場:エンドユーザー別実績-ポテンシャル分析
- エネルギーにおけるAIの世界市場、エンドユーザー別推定・予測2019-2029
- エネルギー分野のAI市場、サブセグメント分析
- エネルギー伝送
- エネルギー発電
- エネルギー配給
- ユーティリティ
第9章 エネルギー分野におけるAIの世界市場:デプロイメントタイプ別
- 市場スナップショット
- エネルギーにおけるAIの世界市場:デプロイメントタイプ別、パフォーマンス-ポテンシャル分析
- エネルギーにおけるAIの世界市場、デプロイメントタイプ別推定・予測2019-2029
- エネルギー分野のAI市場、サブセグメント分析
- オンプレミス
- クラウド
第10章 AI in Energyの世界市場:地域別分析
- AI in Energy市場、地域別市場スナップショット
- 北米
- 米国
- コンポーネントタイプ別の推定・予測、2019年~2029年
- アプリケーション別の推定・予測、2019年~2029年
- エンドユーザー別の推定・予測、2019年~2029年
- デプロイメントタイプ別の推定・予測、2019年~2029年
- カナダ
- 米国
- 欧州のエネルギー分野におけるAI市場スナップショット
- 英国
- ドイツ
- フランス
- スペイン
- イタリア
- その他の欧州地域
- アジア太平洋地域のエネルギー分野におけるAI市場のスナップショット
- 中国
- インド
- 日本
- オーストラリア
- 韓国
- その他アジア太平洋地域
- ラテンアメリカのエネルギー分野におけるAI市場のスナップショット
- ブラジル
- メキシコ
- その他のラテンアメリカ地域
- 世界のその他の地域
第11章 競合情報
- トップ市場戦略
- 企業プロファイル
- Alpiq AG
- 主要情報
- 概要
- 財務情報(データの入手状況により異なります)
- 製品概要
- 最近の動向
- SmartCloud Inc.
- General Electric
- Siemens AG
- Hazama Ando Corporation
- ATOS SE
- AppOrchid Inc
- Zen Robotics Ltd
- Schneider Electric
- ABB Group
- Alpiq AG
第12章 調査プロセス
- 調査プロセス
- データマイニング
- 分析
- 市場推定
- バリデーション
- 出版
- 調査属性
- 調査の前提条件
LIST OF TABLES
- TABLE 1. Global AI in Energy Market, report scope
- TABLE 2. Global AI in Energy Market estimates & forecasts by Region 2019-2029 (USD Billion)
- TABLE 3. Global AI in Energy Market estimates & forecasts by Component Type 2019-2029 (USD Billion)
- TABLE 4. Global AI in Energy Market estimates & forecasts by Application 2019-2029 (USD Billion)
- TABLE 5. Global AI in Energy Market estimates & forecasts by End User 2019-2029 (USD Billion)
- TABLE 6. Global AI in Energy Market estimates & forecasts by Deployment Type 2019-2029 (USD Billion)
- TABLE 7. Global AI in Energy Market by segment, estimates & forecasts, 2019-2029 (USD Billion)
- TABLE 8. Global AI in Energy Market by region, estimates & forecasts, 2019-2029 (USD Billion)
- TABLE 9. Global AI in Energy Market by segment, estimates & forecasts, 2019-2029 (USD Billion)
- TABLE 10. Global AI in Energy Market by region, estimates & forecasts, 2019-2029 (USD Billion)
- TABLE 11. Global AI in Energy Market by segment, estimates & forecasts, 2019-2029 (USD Billion)
- TABLE 12. Global AI in Energy Market by region, estimates & forecasts, 2019-2029 (USD Billion)
- TABLE 13. Global AI in Energy Market by segment, estimates & forecasts, 2019-2029 (USD Billion)
- TABLE 14. Global AI in Energy Market by region, estimates & forecasts, 2019-2029 (USD Billion)
- TABLE 15. Global AI in Energy Market by segment, estimates & forecasts, 2019-2029 (USD Billion)
- TABLE 16. Global AI in Energy Market by region, estimates & forecasts, 2019-2029 (USD Billion)
- TABLE 17. U.S. AI in Energy Market estimates & forecasts, 2019-2029 (USD Billion)
- TABLE 18. U.S. AI in Energy Market estimates & forecasts by segment 2019-2029 (USD Billion)
- TABLE 19. U.S. AI in Energy Market estimates & forecasts by segment 2019-2029 (USD Billion)
- TABLE 20. Canada AI in Energy Market estimates & forecasts, 2019-2029 (USD Billion)
- TABLE 21. Canada AI in Energy Market estimates & forecasts by segment 2019-2029 (USD Billion)
- TABLE 22. Canada AI in Energy Market estimates & forecasts by segment 2019-2029 (USD Billion)
- TABLE 23. UK AI in Energy Market estimates & forecasts, 2019-2029 (USD Billion)
- TABLE 24. UK AI in Energy Market estimates & forecasts by segment 2019-2029 (USD Billion)
- TABLE 25. UK AI in Energy Market estimates & forecasts by segment 2019-2029 (USD Billion)
- TABLE 26. Germany AI in Energy Market estimates & forecasts, 2019-2029 (USD Billion)
- TABLE 27. Germany AI in Energy Market estimates & forecasts by segment 2019-2029 (USD Billion)
- TABLE 28. Germany AI in Energy Market estimates & forecasts by segment 2019-2029 (USD Billion)
- TABLE 29. France AI in Energy Market estimates & forecasts, 2019-2029 (USD Billion)
- TABLE 30. France AI in Energy Market estimates & forecasts by segment 2019-2029 (USD Billion)
- TABLE 31. France AI in Energy Market estimates & forecasts by segment 2019-2029 (USD Billion)
- TABLE 32. Italy AI in Energy Market estimates & forecasts, 2019-2029 (USD Billion)
- TABLE 33. Italy AI in Energy Market estimates & forecasts by segment 2019-2029 (USD Billion)
- TABLE 34. Italy AI in Energy Market estimates & forecasts by segment 2019-2029 (USD Billion)
- TABLE 35. Spain AI in Energy Market estimates & forecasts, 2019-2029 (USD Billion)
- TABLE 36. Spain AI in Energy Market estimates & forecasts by segment 2019-2029 (USD Billion)
- TABLE 37. Spain AI in Energy Market estimates & forecasts by segment 2019-2029 (USD Billion)
- TABLE 38. RoE AI in Energy Market estimates & forecasts, 2019-2029 (USD Billion)
- TABLE 39. RoE AI in Energy Market estimates & forecasts by segment 2019-2029 (USD Billion)
- TABLE 40. RoE AI in Energy Market estimates & forecasts by segment 2019-2029 (USD Billion)
- TABLE 41. China AI in Energy Market estimates & forecasts, 2019-2029 (USD Billion)
- TABLE 42. China AI in Energy Market estimates & forecasts by segment 2019-2029 (USD Billion)
- TABLE 43. China AI in Energy Market estimates & forecasts by segment 2019-2029 (USD Billion)
- TABLE 44. India AI in Energy Market estimates & forecasts, 2019-2029 (USD Billion)
- TABLE 45. India AI in Energy Market estimates & forecasts by segment 2019-2029 (USD Billion)
- TABLE 46. India AI in Energy Market estimates & forecasts by segment 2019-2029 (USD Billion)
- TABLE 47. Japan AI in Energy Market estimates & forecasts, 2019-2029 (USD Billion)
- TABLE 48. Japan AI in Energy Market estimates & forecasts by segment 2019-2029 (USD Billion)
- TABLE 49. Japan AI in Energy Market estimates & forecasts by segment 2019-2029 (USD Billion)
- TABLE 50. South Korea AI in Energy Market estimates & forecasts, 2019-2029 (USD Billion)
- TABLE 51. South Korea AI in Energy Market estimates & forecasts by segment 2019-2029 (USD Billion)
- TABLE 52. South Korea AI in Energy Market estimates & forecasts by segment 2019-2029 (USD Billion)
- TABLE 53. Australia AI in Energy Market estimates & forecasts, 2019-2029 (USD Billion)
- TABLE 54. Australia AI in Energy Market estimates & forecasts by segment 2019-2029 (USD Billion)
- TABLE 55. Australia AI in Energy Market estimates & forecasts by segment 2019-2029 (USD Billion)
- TABLE 56. RoAPAC AI in Energy Market estimates & forecasts, 2019-2029 (USD Billion)
- TABLE 57. RoAPAC AI in Energy Market estimates & forecasts by segment 2019-2029 (USD Billion)
- TABLE 58. RoAPAC AI in Energy Market estimates & forecasts by segment 2019-2029 (USD Billion)
- TABLE 59. Brazil AI in Energy Market estimates & forecasts, 2019-2029 (USD Billion)
- TABLE 60. Brazil AI in Energy Market estimates & forecasts by segment 2019-2029 (USD Billion)
- TABLE 61. Brazil AI in Energy Market estimates & forecasts by segment 2019-2029 (USD Billion)
- TABLE 62. Mexico AI in Energy Market estimates & forecasts, 2019-2029 (USD Billion)
- TABLE 63. Mexico AI in Energy Market estimates & forecasts by segment 2019-2029 (USD Billion)
- TABLE 64. Mexico AI in Energy Market estimates & forecasts by segment 2019-2029 (USD Billion)
- TABLE 65. RoLA AI in Energy Market estimates & forecasts, 2019-2029 (USD Billion)
- TABLE 66. RoLA AI in Energy Market estimates & forecasts by segment 2019-2029 (USD Billion)
- TABLE 67. RoLA AI in Energy Market estimates & forecasts by segment 2019-2029 (USD Billion)
- TABLE 68. Row AI in Energy Market estimates & forecasts, 2019-2029 (USD Billion)
- TABLE 69. Row AI in Energy Market estimates & forecasts by segment 2019-2029 (USD Billion)
- TABLE 70. Row AI in Energy Market estimates & forecasts by segment 2019-2029 (USD Billion)
- TABLE 71. List of secondary sources, used in the study of global AI in Energy Market
- TABLE 72. List of primary sources, used in the study of global AI in Energy Market
- TABLE 73. Years considered for the study
- TABLE 74. Exchange rates considered
List of tables and figures and dummy in nature, final lists may vary in the final deliverable
LIST OF FIGURES
List of figures
- FIG 1. Global AI in Energy Market, research methodology
- FIG 2. Global AI in Energy Market, Market estimation techniques
- FIG 3. Global Market size estimates & forecast methods
- FIG 4. Global AI in Energy Market, key trends 2021
- FIG 5. Global AI in Energy Market, growth prospects 2022-2029
- FIG 6. Global AI in Energy Market, porters 5 force model
- FIG 7. Global AI in Energy Market, pest analysis
- FIG 8. Global AI in Energy Market, value chain analysis
- FIG 9. Global AI in Energy Market by segment, 2019 & 2029 (USD Billion)
- FIG 10. Global AI in Energy Market by segment, 2019 & 2029 (USD Billion)
- FIG 11. Global AI in Energy Market by segment, 2019 & 2029 (USD Billion)
- FIG 12. Global AI in Energy Market by segment, 2019 & 2029 (USD Billion)
- FIG 13. Global AI in Energy Market by segment, 2019 & 2029 (USD Billion)
- FIG 14. Global AI in Energy Market, regional snapshot 2019 & 2029
- FIG 15. North America AI in Energy Market 2019 & 2029 (USD Billion)
- FIG 16. Europe AI in Energy Market 2019 & 2029 (USD Billion)
- FIG 17. Asia pacific AI in Energy Market 2019 & 2029 (USD Billion)
- FIG 18. Latin America AI in Energy Market 2019 & 2029 (USD Billion)
- FIG 19. Global AI in Energy Market, company Market share analysis (2021)
List of tables and figures and dummy in nature, final lists may vary in the final deliverable
Global AI in Energy Market is valued approximately USD 4 billion in 2021 and is anticipated to grow with a healthy growth rate of more than 17.4% over the forecast period 2022-2029. AI based solution and services are used across the power and energy sector to assist better control and management of energy consumption, and for anticipating network malfunctions & optimization. Moreover, AI is utilized towards the optimization of energy grids by managing energy flows between homes, businesses, storage batteries, renewable energy sources, microgrids, and the power grid. Additionally, based on the Predictive analytics, energy companies can access the future energy demand and can also detect energy theft and illegal taping of energy from the grid. The increasing energy demand worldwide and growing adoption of smart meters and smart home solutions are key factors accelerating the market growth.
The global energy demand is rapidly increasing due to growing expansion of urban areas & industrial activity in developing regions, which in turn contributing towards the growth of the Global AI in Energy Market. For instance, as per Statista - in 2019, the global renewable energy consumption was estimated at 74 exajoules, and the renewable energy consumption is projected to grow to 247 exajoules in 2050. Moreover, another factor accelerating the market growth is increasing investment in smart grids. For instance, according to International Energy Agency (IEA) estimates - in 2019, the United States spent around USD 71 billion in modernization of grids, and this amount further increased to USD 84 billion in 2021. Additionally, in Feb 2022, India Renewable Energy Agency (IRENA) and State Grid Corporation of China (SGCC) announced investment of USD 350 billion between 2021 & 2025 to upgrade power grid & build new power systems. Also, increasing investment towards modernization of the energy sector and rising advancements in AI & ML technologies would create lucrative growth prospectus for the market over the forecast period. However, the high cost associated with AI based services & solutions stifles market growth throughout the forecast period of 2022-2029.
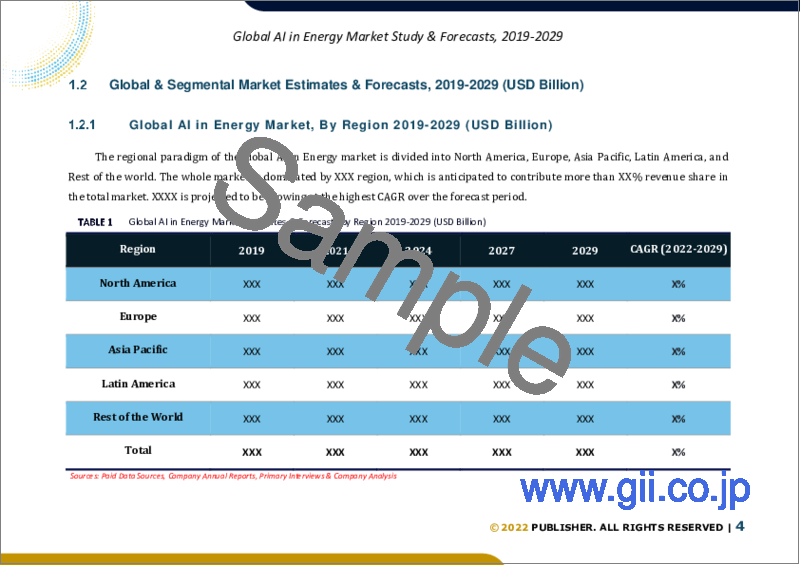
The key regions considered for the Global AI in Energy Market study includes Asia Pacific, North America, Europe, Latin America, and Rest of the World. North America dominated the market in terms of revenue, owing to the dominance of leading market players and increasing investment towards modernization of energy distribution equipment in the region. Whereas Asia Pacific is expected to grow with a highest CAGR during the forecast period, owing to factors such as rising energy demand from industrial sector & favorable initiatives from government authorities towards advancements in energy sector in the region.
Major market players included in this report are:
Alpiq AG
SmartCloud Inc.
General Electric
Siemens AG
Hazama Ando Corporation
ATOS SE
AppOrchid Inc
Zen Robotics Ltd
Schneider Electric
ABB Group
Recent Developments in the Market:
- In October 2021, Tata Power, one the largest integrated power utility company signed a three-year commercial agreement with BluWave-ai. Under this partnership, BluWave-ai would deploy a cloud platform to generate intra-day and day-ahead dispatches for use in Tata Power's power scheduling operations.
Global AI in Energy Market Report Scope:
Historical Data: 2019-2020-2021
Base Year for Estimation: 2021
Forecast period: 2022-2029
Report Coverage: Revenue forecast, Company Ranking, Competitive Landscape, Growth factors, and Trends
Segments Covered: Component Type, Application, End User, Deployment Type, Region
Regional Scope: North America; Europe; Asia Pacific; Latin America; Rest of the World
Customization Scope: Free report customization (equivalent up to 8 analyst's working hours) with purchase. Addition or alteration to country, regional & segment scope*
The objective of the study is to define market sizes of different segments & countries in recent years and to forecast the values to the coming years. The report is designed to incorporate both qualitative and quantitative aspects of the industry within countries involved in the study.
The report also caters detailed information about the crucial aspects such as driving factors & challenges which will define the future growth of the market. Additionally, it also incorporates potential opportunities in micro markets for stakeholders to invest along with the detailed analysis of competitive landscape and product offerings of key players. The detailed segments and sub-segment of the market are explained below:
By Component Type
Solutions
Services
By Application
Robotics
Renewables Management
Demand Forecasting
Safety and Security
Infrastructure
Others
By End user
Energy Transmission
Energy Generation
Energy Distribution
Utilities
By Deployment Type
On-premises
Cloud
By Region:
North America
U.S.
Canada
Europe
UK
Germany
France
Spain
Italy
ROE
Asia Pacific
China
India
Japan
Australia
South Korea
RoAPAC
Latin America
Brazil
Mexico
RoLA
Rest of the World
Table of Contents
Chapter 1. Executive Summary
- 1.1. Market Snapshot
- 1.2. Global & Segmental Market Estimates & Forecasts, 2019-2029 (USD Billion)
- 1.2.1. AI in Energy Market, by Region, 2019-2029 (USD Billion)
- 1.2.2. AI in Energy Market, by Component Type, 2019-2029 (USD Billion)
- 1.2.3. AI in Energy Market, by Application, 2019-2029 (USD Billion)
- 1.2.4. AI in Energy Market, by End User, 2019-2029 (USD Billion)
- 1.2.5. AI in Energy Market, by Deployment Type, 2019-2029 (USD Billion)
- 1.3. Key Trends
- 1.4. Estimation Methodology
- 1.5. Research Assumption
Chapter 2. Global AI in Energy Market Definition and Scope
- 2.1. Objective of the Study
- 2.2. Market Definition & Scope
- 2.2.1. Scope of the Study
- 2.2.2. Industry Evolution
- 2.3. Years Considered for the Study
- 2.4. Currency Conversion Rates
Chapter 3. Global AI in Energy Market Dynamics
- 3.1. AI in Energy Market Impact Analysis (2019-2029)
- 3.1.1. Market Drivers
- 3.1.1.1. Increasing energy demand worldwide
- 3.1.1.2. Growing adoption of smart meters and smart home solutions
- 3.1.2. Market Challenges
- 3.1.2.1. High deployment cost associated with AI solutions
- 3.1.3. Market Opportunities
- 3.1.3.1. Increasing investment towards modernization of the energy sector
- 3.1.3.2. Rising advancements in AI & ML technologies
- 3.1.1. Market Drivers
Chapter 4. Global AI in Energy Market Industry Analysis
- 4.1. Porter's 5 Force Model
- 4.1.1. Bargaining Power of Suppliers
- 4.1.2. Bargaining Power of Buyers
- 4.1.3. Threat of New Entrants
- 4.1.4. Threat of Substitutes
- 4.1.5. Competitive Rivalry
- 4.2. Futuristic Approach to Porter's 5 Force Model (2019-2029)
- 4.3. PEST Analysis
- 4.3.1. Political
- 4.3.2. Economical
- 4.3.3. Social
- 4.3.4. Technological
- 4.4. Top investment opportunity
- 4.5. Top winning strategies
- 4.6. Industry Experts Prospective
- 4.7. Analyst Recommendation & Conclusion
Chapter 5. Risk Assessment: COVID-19 Impact
- 5.1. Assessment of the overall impact of COVID-19 on the industry
- 5.2. Pre COVID-19 and post COVID-19 Market scenario
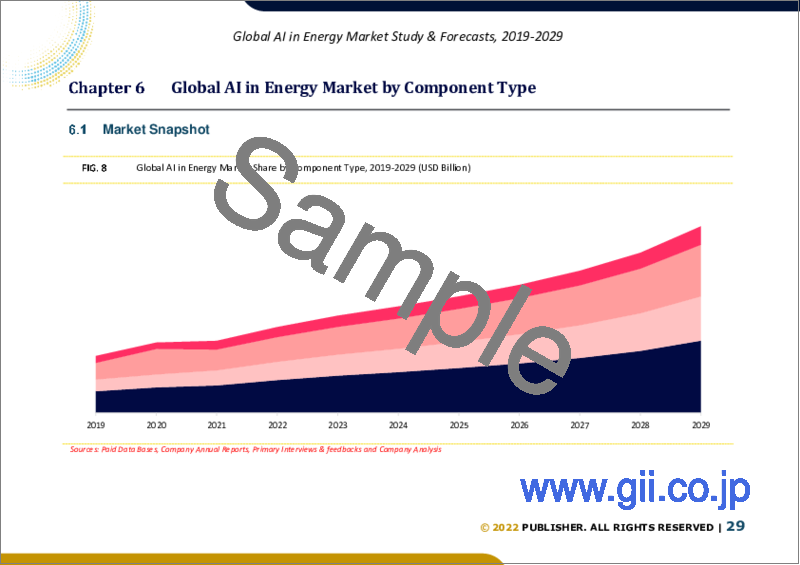
Chapter 6. Global AI in Energy Market, by Component Type
- 6.1. Market Snapshot
- 6.2. Global AI in Energy Market by Component Type, Performance - Potential Analysis
- 6.3. Global AI in Energy Market Estimates & Forecasts by Component Type 2019-2029 (USD Billion)
- 6.4. AI in Energy Market, Sub Segment Analysis
- 6.4.1. Solution
- 6.4.2. Services
Chapter 7. Global AI in Energy Market, by Application
- 7.1. Market Snapshot
- 7.2. Global AI in Energy Market by Application, Performance - Potential Analysis
- 7.3. Global AI in Energy Market Estimates & Forecasts by Application 2019-2029 (USD Billion)
- 7.4. AI in Energy Market, Sub Segment Analysis
- 7.4.1. Robotics
- 7.4.2. Renewables Management
- 7.4.3. Demand Forecasting
- 7.4.4. Safety and Security
- 7.4.5. Infrastructure
- 7.4.6. Others
Chapter 8. Global AI in Energy Market, by End User
- 8.1. Market Snapshot
- 8.2. Global AI in Energy Market by End User, Performance - Potential Analysis
- 8.3. Global AI in Energy Market Estimates & Forecasts by End User 2019-2029 (USD Billion)
- 8.4. AI in Energy Market, Sub Segment Analysis
- 8.4.1. Energy Transmission
- 8.4.2. Energy Generation
- 8.4.3. Energy Distribution
- 8.4.4. Utilities
Chapter 9. Global AI in Energy Market, by Deployment Type
- 9.1. Market Snapshot
- 9.2. Global AI in Energy Market by Deployment Type, Performance - Potential Analysis
- 9.3. Global AI in Energy Market Estimates & Forecasts by Deployment Type 2019-2029 (USD Billion)
- 9.4. AI in Energy Market, Sub Segment Analysis
- 9.4.1. On premise
- 9.4.2. Cloud
Chapter 10. Global AI in Energy Market, Regional Analysis
- 10.1. AI in Energy Market, Regional Market Snapshot
- 10.2. North America AI in Energy Market
- 10.2.1. U.S. AI in Energy Market
- 10.2.1.1. Component Type breakdown estimates & forecasts, 2019-2029
- 10.2.1.2. Application breakdown estimates & forecasts, 2019-2029
- 10.2.1.3. End User breakdown estimates & forecasts, 2019-2029
- 10.2.1.4. Deployment Type breakdown estimates & forecasts, 2019-2029
- 10.2.2. Canada AI in Energy Market
- 10.2.1. U.S. AI in Energy Market
- 10.3. Europe AI in Energy Market Snapshot
- 10.3.1. U.K. AI in Energy Market
- 10.3.2. Germany AI in Energy Market
- 10.3.3. France AI in Energy Market
- 10.3.4. Spain AI in Energy Market
- 10.3.5. Italy AI in Energy Market
- 10.3.6. Rest of Europe AI in Energy Market
- 10.4. Asia-Pacific AI in Energy Market Snapshot
- 10.4.1. China AI in Energy Market
- 10.4.2. India AI in Energy Market
- 10.4.3. Japan AI in Energy Market
- 10.4.4. Australia AI in Energy Market
- 10.4.5. South Korea AI in Energy Market
- 10.4.6. Rest of Asia Pacific AI in Energy Market
- 10.5. Latin America AI in Energy Market Snapshot
- 10.5.1. Brazil AI in Energy Market
- 10.5.2. Mexico AI in Energy Market
- 10.5.3. Rest of Latin America AI in Energy Market
- 10.6. Rest of The World AI in Energy Market
Chapter 11. Competitive Intelligence
- 11.1. Top Market Strategies
- 11.2. Company Profiles
- 11.2.1. Alpiq AG
- 11.2.1.1. Key Information
- 11.2.1.2. Overview
- 11.2.1.3. Financial (Subject to Data Availability)
- 11.2.1.4. Product Summary
- 11.2.1.5. Recent Developments
- 11.2.2. SmartCloud Inc.
- 11.2.3. General Electric
- 11.2.4. Siemens AG
- 11.2.5. Hazama Ando Corporation
- 11.2.6. ATOS SE
- 11.2.7. AppOrchid Inc
- 11.2.8. Zen Robotics Ltd
- 11.2.9. Schneider Electric
- 11.2.10. ABB Group
- 11.2.1. Alpiq AG
Chapter 12. Research Process
- 12.1. Research Process
- 12.1.1. Data Mining
- 12.1.2. Analysis
- 12.1.3. Market Estimation
- 12.1.4. Validation
- 12.1.5. Publishing
- 12.2. Research Attributes
- 12.3. Research Assumption