|
|
市場調査レポート
商品コード
1215324
脊髄性筋萎縮症(SMA)治療の世界市場規模調査・予測:製品別、疾患タイプ別、流通チャネル別、地域別分析、2022-2029年Global Spinal Muscular Atrophy Treatment Market Size study & Forecast, by Product, by Disease Type, by Distribution Channel and Regional Analysis, 2022-2029 |
||||||
|
|
|||||||
|
● お客様のご希望に応じて、既存データの加工や未掲載情報(例:国別セグメント)の追加などの対応が可能です。 詳細はお問い合わせください。 |
|||||||


| 脊髄性筋萎縮症(SMA)治療の世界市場規模調査・予測:製品別、疾患タイプ別、流通チャネル別、地域別分析、2022-2029年 |
|
出版日: 2023年01月29日
発行: Bizwit Research & Consulting LLP
ページ情報: 英文
納期: 2~3営業日
|
- 全表示
- 概要
- 図表
- 目次
世界の脊髄性筋萎縮症治療市場は、2021年に約38億8000万米ドルと評価され、予測期間2022-2029年には18.6%以上の健全な成長率で成長すると予測されています。
脊髄性筋萎縮症(SMA)は、脊髄である運動ニューロンや脳幹の神経細胞が徐々に破壊される遺伝性疾患の一種です。また、呼吸、歩行、会話、嚥下などの重要な骨格筋の活動に影響を及ぼし、筋力低下や萎縮を引き起こします。新規治療法に関する認知度の向上、政府による支援の増加、医療費の増加などが、世界中で市場の成長を促進している主な要因となっています。
脊髄性筋萎縮症の有病率は上昇傾向にあり、これは全世界の市場需要に直接関連しています。全米希少疾患機関(NORD)の推計によると、全世界で約1万人に1人が脊髄性筋萎縮症(SMA)に罹患していると言われています。同様に、脊髄性筋萎縮症財団によると、この疾患は世界の新生児6,000~10,000人に1人の割合で発症すると予想されています。したがって、この疾患の発生件数の増加が市場の需要に積極的に貢献し、それが市場の成長を促進しています。さらに、高い効能を持つ新製品のイントロダクションや研究開発投資の増加が、予測期間中にさまざまな好機を生み出しています。しかし、承認済み製品に関連する高コストと熟練した専門家の不足が、2022~2029年の予測期間を通じて市場成長を制限しています。
世界の脊髄性筋萎縮症治療市場調査のために考慮された主要地域は、アジア太平洋、北米、欧州、中南米、および世界のその他の地域が含まれます。北米は、治療製品への支出の増加と、人口の間でのSMA障害の発生率の上昇により、収益面で市場を独占しています。一方、アジア太平洋地域は、対象人口の増加、ヘルスケアサービスへの支出の増加、市場空間における主要企業の地理的拡大などの要因から、予測期間中に最高のCAGRで成長すると予想されます。
本レポートに含まれる主な市場参加者は以下の通りです。
- バイオジェン
- ノバルティスAG
- イオニス・ファーマシューティカルズ・インク
- バイオヘブン・ファーマシューティカルズ
- F.ホフマン・ラ・ロシュ社
- サイトカイネティクス
- スカラー・ロック社
- PTCセラピューティック
- NMDファーマA/S
- アステラス製薬株式会社
市場における最近の開拓。
- 2022年1月、バイオジェン社とイオニス・ファーマシューティカルズ社は、SMA患者の治癒を目的とした別の実験薬BIIB115(アンチセンス・オリゴヌクレオチド)の開発を目的としたライセンス契約を締結したことを発表しました。BIIB115は、前臨床試験段階にある実験薬です。この契約の目的は、バイオジェンのSMA治療薬のポートフォリオを拡大することです。
- 2019年5月、Novartis AGは、Zolgensma(onasemnogene abeparvovec-xioi)が、脊髄性筋萎縮症(SMA)の小児患者に対する最初で唯一の遺伝子治療として米国FDAから承認を取得したと発表しました。
世界の脊髄性筋萎縮症治療薬市場調査範囲。
- 過去データ:2019年~2020年~2021年
- 基本推定年:2021年
- 予測期間:2022年~2029年
- レポート対象範囲収益予測、企業ランキング、競合情勢、成長要因、動向を掲載
- カバーするセグメント製品タイプ,疾患タイプ,流通チャネル,地域
- 地域範囲北米;欧州;アジア太平洋;ラテンアメリカ;その他世界のその他の地域
- カスタマイズ範囲レポートのカスタマイズは無料です(アナリストの作業時間8時間まで)。国、地域、セグメント範囲の追加または変更*。
本調査の目的は、近年における様々なセグメントおよび国の市場規模を定義し、今後数年間の値を予測することです。本レポートは、調査対象国における産業の質的・量的な側面を取り入れるよう設計されています。
また、市場の将来的な成長を規定する促進要因や課題などの重要な側面に関する詳細な情報も提供しています。さらに、主要企業の競合情勢や製品提供の詳細な分析とともに、利害関係者が投資するためのミクロ市場の潜在的な機会も組み込んでいます。
製品別
- ヌシネルセン
- オナセムノゲンアベパルヴォベック
疾患タイプ別
- 1型SMA
- 2型SMA
- その他
販売チャネル別
- 病院内薬局
- 小売店
- その他
地域別
- 北米
- 米国
- カナダ
- 欧州
- 英国
- ドイツ
- フランス
- スペイン
- イタリア
- ROE
- アジア太平洋地域
- 中国
- インド
- 日本
- オーストラリア
- 韓国
- ロアパック
- ラテンアメリカ
- ブラジル
- メキシコ
- RoLA
- 世界のその他の地域
目次
第1章 エグゼクティブサマリー
- 市場スナップショット
- 世界・セグメント別市場推定・予測、2019年~2029年
- 脊髄性筋萎縮症治療市場:地域別、2019-2029年
- 脊髄性筋萎縮症治療薬市場:製品別、2019-2029年
- 脊髄性筋萎縮症治療市場:疾患タイプ別、2019年-2029年
- 脊髄性筋萎縮症治療薬市場:流通チャネル別、2019年~2029年
- 主な動向
- 調査手法
- 調査前提条件
第2章 脊髄性筋萎縮症治療薬の世界市場定義とスコープ
- 調査の目的
- 市場の定義と範囲
- 調査対象範囲
- 産業の進化
- 調査対象年
- 通貨換算レート
第3章 世界の脊髄性筋萎縮症治療市場力学
- 脊髄性筋萎縮症治療薬市場のインパクト分析(2019年~2029年)
- 市場促進要因
- 新規治療法に関する認知度の向上
- 脊髄性筋萎縮症の有病率の上昇
- 市場の課題
- 承認済み製品に関連する高コスト
- 熟練した専門家の不足
- 市場機会
- 高い効能を持つ新製品のイントロダクション
- 研究開発投資の拡大
- 市場促進要因
第4章 世界の脊髄性筋萎縮症治療市場産業分析
- ポーターの5フォースモデル
- 供給企業の交渉力
- 買い手の交渉力
- 新規参入業者の脅威
- 代替品の脅威
- 競争企業間の敵対関係
- ポーターの5フォースモデルへの未来的アプローチ(2019-2029年)
- PEST分析
- 政治的
- 経済的
- 社会的
- 技術的
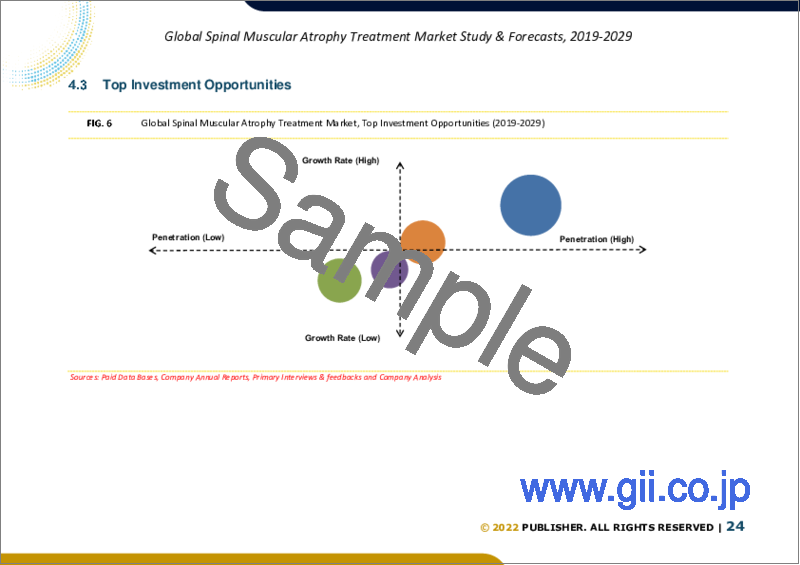
- トップ投資機会
- 主要成功戦略
- 業界専門家別展望
- アナリストの結論・提言
第5章 リスクアセスメント:COVID-19のインパクト
- COVID-19が業界に与える全体的な影響の評価
- COVID-19以前とCOVID-19以後の市場シナリオ
第6章 脊髄性筋萎縮症治療の世界市場:製品別
- 市場スナップショット
- 脊髄性筋萎縮症治療の世界市場:製品別、業績-ポテンシャル分析
- 脊髄性筋萎縮症治療の世界市場製品別推定・予測2019-2029
- 脊髄性筋萎縮症治療薬市場、サブセグメント分析
- ヌシネルセン
- オナセムノゲンアベパルヴォベック
第7章:脊髄性筋萎縮症治療薬の世界市場、疾患タイプ別
- 市場スナップショット
- 脊髄性筋萎縮症治療の世界市場:疾患タイプ別、パフォーマンス-ポテンシャル分析
- 脊髄性筋萎縮症治療の世界市場、疾患タイプ別推定・予測2019-2029年
- 脊髄性筋萎縮症治療薬市場、サブセグメント分析
- タイプ1 SMA
- 2型SMA
- その他
第8章 脊髄性筋萎縮症治療薬の世界市場:流通チャネル別
- 市場スナップショット
- 脊髄性筋萎縮症治療薬の世界市場:流通チャネル別、実績-ポテンシャル分析
- 脊髄性筋萎縮症治療薬の世界市場、流通チャネル別推定・予測2019~2029年
- 脊髄性筋萎縮症治療薬市場、サブセグメント分析
- 病院内薬局
- 小売薬局
- その他
第9章 脊髄性筋萎縮症治療薬の世界市場:地域別分析
- 脊髄性筋萎縮症治療薬市場、地域別市場スナップショット
- 北米
- 米国
- 製品別の推定・予測、2019年~2029年
- 疾患タイプ別の推定・予測、2019-2029年
- 流通チャネル別の推定・予測、2019年~2029年
- カナダ
- 米国
- 欧州脊髄性筋萎縮症治療薬市場スナップショット
- 英国
- ドイツ
- フランス
- スペイン
- イタリア
- その他の欧州地域
- アジア太平洋地域の脊髄性筋萎縮症治療市場スナップショット
- 中国
- インド
- 日本
- オーストラリア
- 韓国
- その他アジア太平洋地域
- ラテンアメリカの脊髄性筋萎縮症治療市場スナップショット
- ブラジル
- メキシコ
- その他のラテンアメリカ地域
- 世界のその他の地域
第10章 競合情報
- トップ市場戦略
- 企業プロファイル
- Biogen
- 主要情報
- 概要
- 財務情報(データの入手状況により異なります)
- 製品概要
- 最近の動向
- Novartis AG
- Ionis Pharmaceuticals Inc.
- Biohaven Pharmaceuticals
- F. Hoffmann-La Roche Ltd
- Cytokinetics
- Scholar Rock, Inc.
- PTC Therapeutics
- NMD PHARMA A/S
- Astellas Pharma Inc.
- Biogen
第11章 調査プロセス
- 調査プロセス
- データマイニング
- 分析
- 市場推定
- バリデーション
- 出版
- 調査属性
- 調査の前提条件
LIST OF TABLES
- TABLE 1. Global Spinal Muscular Atrophy Treatment Market, report scope
- TABLE 2. Global Spinal Muscular Atrophy Treatment Market estimates & forecasts by Region 2019-2029 (USD Billion)
- TABLE 3. Global Spinal Muscular Atrophy Treatment Market estimates & forecasts by Product 2019-2029 (USD Billion)
- TABLE 4. Global Spinal Muscular Atrophy Treatment Market estimates & forecasts by Disease Type 2019-2029 (USD Billion)
- TABLE 5. Global Spinal Muscular Atrophy Treatment Market estimates & forecasts by Distribution Channel 2019-2029 (USD Billion)
- TABLE 6. Global Spinal Muscular Atrophy Treatment Market by segment, estimates & forecasts, 2019-2029 (USD Billion)
- TABLE 7. Global Spinal Muscular Atrophy Treatment Market by region, estimates & forecasts, 2019-2029 (USD Billion)
- TABLE 8. Global Spinal Muscular Atrophy Treatment Market by segment, estimates & forecasts, 2019-2029 (USD Billion)
- TABLE 9. Global Spinal Muscular Atrophy Treatment Market by region, estimates & forecasts, 2019-2029 (USD Billion)
- TABLE 10. Global Spinal Muscular Atrophy Treatment Market by segment, estimates & forecasts, 2019-2029 (USD Billion)
- TABLE 11. Global Spinal Muscular Atrophy Treatment Market by region, estimates & forecasts, 2019-2029 (USD Billion)
- TABLE 12. Global Spinal Muscular Atrophy Treatment Market by segment, estimates & forecasts, 2019-2029 (USD Billion)
- TABLE 13. Global Spinal Muscular Atrophy Treatment Market by region, estimates & forecasts, 2019-2029 (USD Billion)
- TABLE 14. Global Spinal Muscular Atrophy Treatment Market by segment, estimates & forecasts, 2019-2029 (USD Billion)
- TABLE 15. Global Spinal Muscular Atrophy Treatment Market by region, estimates & forecasts, 2019-2029 (USD Billion)
- TABLE 16. U.S. Spinal Muscular Atrophy Treatment Market estimates & forecasts, 2019-2029 (USD Billion)
- TABLE 17. U.S. Spinal Muscular Atrophy Treatment Market estimates & forecasts by segment 2019-2029 (USD Billion)
- TABLE 18. U.S. Spinal Muscular Atrophy Treatment Market estimates & forecasts by segment 2019-2029 (USD Billion)
- TABLE 19. Canada Spinal Muscular Atrophy Treatment Market estimates & forecasts, 2019-2029 (USD Billion)
- TABLE 20. Canada Spinal Muscular Atrophy Treatment Market estimates & forecasts by segment 2019-2029 (USD Billion)
- TABLE 21. Canada Spinal Muscular Atrophy Treatment Market estimates & forecasts by segment 2019-2029 (USD Billion)
- TABLE 22. UK Spinal Muscular Atrophy Treatment Market estimates & forecasts, 2019-2029 (USD Billion)
- TABLE 23. UK Spinal Muscular Atrophy Treatment Market estimates & forecasts by segment 2019-2029 (USD Billion)
- TABLE 24. UK Spinal Muscular Atrophy Treatment Market estimates & forecasts by segment 2019-2029 (USD Billion)
- TABLE 25. Germany Spinal Muscular Atrophy Treatment Market estimates & forecasts, 2019-2029 (USD Billion)
- TABLE 26. Germany Spinal Muscular Atrophy Treatment Market estimates & forecasts by segment 2019-2029 (USD Billion)
- TABLE 27. Germany Spinal Muscular Atrophy Treatment Market estimates & forecasts by segment 2019-2029 (USD Billion)
- TABLE 28. France Spinal Muscular Atrophy Treatment Market estimates & forecasts, 2019-2029 (USD Billion)
- TABLE 29. France Spinal Muscular Atrophy Treatment Market estimates & forecasts by segment 2019-2029 (USD Billion)
- TABLE 30. France Spinal Muscular Atrophy Treatment Market estimates & forecasts by segment 2019-2029 (USD Billion)
- TABLE 31. Italy Spinal Muscular Atrophy Treatment Market estimates & forecasts, 2019-2029 (USD Billion)
- TABLE 32. Italy Spinal Muscular Atrophy Treatment Market estimates & forecasts by segment 2019-2029 (USD Billion)
- TABLE 33. Italy Spinal Muscular Atrophy Treatment Market estimates & forecasts by segment 2019-2029 (USD Billion)
- TABLE 34. Spain Spinal Muscular Atrophy Treatment Market estimates & forecasts, 2019-2029 (USD Billion)
- TABLE 35. Spain Spinal Muscular Atrophy Treatment Market estimates & forecasts by segment 2019-2029 (USD Billion)
- TABLE 36. Spain Spinal Muscular Atrophy Treatment Market estimates & forecasts by segment 2019-2029 (USD Billion)
- TABLE 37. RoE Spinal Muscular Atrophy Treatment Market estimates & forecasts, 2019-2029 (USD Billion)
- TABLE 38. RoE Spinal Muscular Atrophy Treatment Market estimates & forecasts by segment 2019-2029 (USD Billion)
- TABLE 39. RoE Spinal Muscular Atrophy Treatment Market estimates & forecasts by segment 2019-2029 (USD Billion)
- TABLE 40. China Spinal Muscular Atrophy Treatment Market estimates & forecasts, 2019-2029 (USD Billion)
- TABLE 41. China Spinal Muscular Atrophy Treatment Market estimates & forecasts by segment 2019-2029 (USD Billion)
- TABLE 42. China Spinal Muscular Atrophy Treatment Market estimates & forecasts by segment 2019-2029 (USD Billion)
- TABLE 43. India Spinal Muscular Atrophy Treatment Market estimates & forecasts, 2019-2029 (USD Billion)
- TABLE 44. India Spinal Muscular Atrophy Treatment Market estimates & forecasts by segment 2019-2029 (USD Billion)
- TABLE 45. India Spinal Muscular Atrophy Treatment Market estimates & forecasts by segment 2019-2029 (USD Billion)
- TABLE 46. Japan Spinal Muscular Atrophy Treatment Market estimates & forecasts, 2019-2029 (USD Billion)
- TABLE 47. Japan Spinal Muscular Atrophy Treatment Market estimates & forecasts by segment 2019-2029 (USD Billion)
- TABLE 48. Japan Spinal Muscular Atrophy Treatment Market estimates & forecasts by segment 2019-2029 (USD Billion)
- TABLE 49. South Korea Spinal Muscular Atrophy Treatment Market estimates & forecasts, 2019-2029 (USD Billion)
- TABLE 50. South Korea Spinal Muscular Atrophy Treatment Market estimates & forecasts by segment 2019-2029 (USD Billion)
- TABLE 51. South Korea Spinal Muscular Atrophy Treatment Market estimates & forecasts by segment 2019-2029 (USD Billion)
- TABLE 52. Australia Spinal Muscular Atrophy Treatment Market estimates & forecasts, 2019-2029 (USD Billion)
- TABLE 53. Australia Spinal Muscular Atrophy Treatment Market estimates & forecasts by segment 2019-2029 (USD Billion)
- TABLE 54. Australia Spinal Muscular Atrophy Treatment Market estimates & forecasts by segment 2019-2029 (USD Billion)
- TABLE 55. RoAPAC Spinal Muscular Atrophy Treatment Market estimates & forecasts, 2019-2029 (USD Billion)
- TABLE 56. RoAPAC Spinal Muscular Atrophy Treatment Market estimates & forecasts by segment 2019-2029 (USD Billion)
- TABLE 57. RoAPAC Spinal Muscular Atrophy Treatment Market estimates & forecasts by segment 2019-2029 (USD Billion)
- TABLE 58. Brazil Spinal Muscular Atrophy Treatment Market estimates & forecasts, 2019-2029 (USD Billion)
- TABLE 59. Brazil Spinal Muscular Atrophy Treatment Market estimates & forecasts by segment 2019-2029 (USD Billion)
- TABLE 60. Brazil Spinal Muscular Atrophy Treatment Market estimates & forecasts by segment 2019-2029 (USD Billion)
- TABLE 61. Mexico Spinal Muscular Atrophy Treatment Market estimates & forecasts, 2019-2029 (USD Billion)
- TABLE 62. Mexico Spinal Muscular Atrophy Treatment Market estimates & forecasts by segment 2019-2029 (USD Billion)
- TABLE 63. Mexico Spinal Muscular Atrophy Treatment Market estimates & forecasts by segment 2019-2029 (USD Billion)
- TABLE 64. RoLA Spinal Muscular Atrophy Treatment Market estimates & forecasts, 2019-2029 (USD Billion)
- TABLE 65. RoLA Spinal Muscular Atrophy Treatment Market estimates & forecasts by segment 2019-2029 (USD Billion)
- TABLE 66. RoLA Spinal Muscular Atrophy Treatment Market estimates & forecasts by segment 2019-2029 (USD Billion)
- TABLE 67. Row Spinal Muscular Atrophy Treatment Market estimates & forecasts, 2019-2029 (USD Billion)
- TABLE 68. Row Spinal Muscular Atrophy Treatment Market estimates & forecasts by segment 2019-2029 (USD Billion)
- TABLE 69. Row Spinal Muscular Atrophy Treatment Market estimates & forecasts by segment 2019-2029 (USD Billion)
- TABLE 70. List of secondary sources, used in the study of global Spinal Muscular Atrophy Treatment Market
- TABLE 71. List of primary sources, used in the study of global Spinal Muscular Atrophy Treatment Market
- TABLE 72. Years considered for the study
- TABLE 73. Exchange rates considered
List of tables and figures and dummy in nature, final lists may vary in the final deliverable
LIST OF FIGURES
List of figures
- FIG 1. Global Spinal Muscular Atrophy Treatment Market, research methodology
- FIG 2. Global Spinal Muscular Atrophy Treatment Market, Market estimation techniques
- FIG 3. Global Market size estimates & forecast methods
- FIG 4. Global Spinal Muscular Atrophy Treatment Market, key trends 2021
- FIG 5. Global Spinal Muscular Atrophy Treatment Market, growth prospects 2022-2029
- FIG 6. Global Spinal Muscular Atrophy Treatment Market, porters 5 force model
- FIG 7. Global Spinal Muscular Atrophy Treatment Market, pest analysis
- FIG 8. Global Spinal Muscular Atrophy Treatment Market, value chain analysis
- FIG 9. Global Spinal Muscular Atrophy Treatment Market by segment, 2019 & 2029 (USD Billion)
- FIG 10. Global Spinal Muscular Atrophy Treatment Market by segment, 2019 & 2029 (USD Billion)
- FIG 11. Global Spinal Muscular Atrophy Treatment Market by segment, 2019 & 2029 (USD Billion)
- FIG 12. Global Spinal Muscular Atrophy Treatment Market by segment, 2019 & 2029 (USD Billion)
- FIG 13. Global Spinal Muscular Atrophy Treatment Market by segment, 2019 & 2029 (USD Billion)
- FIG 14. Global Spinal Muscular Atrophy Treatment Market, regional snapshot 2019 & 2029
- FIG 15. North America Spinal Muscular Atrophy Treatment Market 2019 & 2029 (USD Billion)
- FIG 16. Europe Spinal Muscular Atrophy Treatment Market 2019 & 2029 (USD Billion)
- FIG 17. Asia pacific Spinal Muscular Atrophy Treatment Market 2019 & 2029 (USD Billion)
- FIG 18. Latin America Spinal Muscular Atrophy Treatment Market 2019 & 2029 (USD Billion)
- FIG 19. Global Spinal Muscular Atrophy Treatment Market, company Market share analysis (2021)
List of tables and figures and dummy in nature, final lists may vary in the final deliverable
Global Spinal Muscular Atrophy Treatment Market is valued at approximately USD 3.88 billion in 2021 and is anticipated to grow with a healthy growth rate of more than 18.6% over the forecast period 2022-2029. Spinal muscular atrophy (SMA) is a type of genetic disease that gradually destroys motor neurons that are the spinal cord and nerve cells in the brain stem. It also affects vital skeletal muscle activity including breathing, walking, speaking, and swallowing, which leads to muscle weakness and atrophy. The growing awareness regarding novel therapies, rising government support, coupled with increasing healthcare expenditure is primary factors that are fostering market growth across the globe.
The prevalence of spinal muscular atrophy is on the rise which is directly associated with the market demand across the globe. The National Organization for Rare Disorders (NORD) estimates that approximately 1 in 10,000 people worldwide suffer with spinal muscular atrophy (SMA). Likewise, according to the Spinal Muscular Atrophy Foundation, the condition is expected to affect 1 in every 6,000 to 10,000 newborns worldwide. Therefore, the growing incidences of the disorder are actively contributing to market demand, which, in turn, fosters the growth of the market. Moreover, the introduction of new product with high efficacies, as well as growing R&D investments are presenting various lucrative opportunities over the forecasting years. However, the high costs associated with the approved products and the dearth of skilled professionals are restricting the market growth throughout the forecast period of 2022-2029.
The key regions considered for the Global Spinal Muscular Atrophy Treatment Market study include Asia Pacific, North America, Europe, Latin America, and the Rest of the World. North America dominated the market in terms of revenue, owing to the growing spending on treatment products and the rising incidence of SMA disorders among the population. Whereas, the Asia Pacific is also expected to grow with the highest CAGR during the forecast period, owing to factors such as rising target populations, increasing expenditure on healthcare services, and geographic expansion of key players in the market space.
Major market players included in this report are:
- Biogen
- Novartis AG
- Ionis Pharmaceuticals Inc.
- Biohaven Pharmaceuticals
- F. Hoffmann-La Roche Ltd
- Cytokinetics
- Scholar Rock, Inc.
- PTC Therapeutics
- NMD PHARMA A/S
- Astellas Pharma Inc.
Recent Developments in the Market:
- In January 2022, Biogen and Ionis Pharmaceuticals, Inc., declare that the companies entered into licensing agreement with the aim of developing another experimental drug BIIB115 (an antisense oligonucleotide) to cure of patients with SMA. BIIB115 is an experimental preclinical-stage drug. The objective of this agreement is to expand Biogen's SMA drug portfolio.
- In May 2019, Novartis AG announced that its Zolgensma (onasemnogene abeparvovec-xioi) received an approval from the U.S. FDA for the first and only gene therapy for pediatric patients with spinal muscular atrophy (SMA).
Global Spinal Muscular Atrophy Treatment Market Report Scope:
- Historical Data: 2019-2020-2021
- Base Year for Estimation: 2021
- Forecast period: 2022-2029
- Report Coverage: Revenue forecast, Company Ranking, Competitive Landscape, Growth factors, and Trends
- Segments Covered: Product, Disease Type, Distribution Channel, Region
- Regional Scope: North America; Europe; Asia Pacific; Latin America; Rest of the World
- Customization Scope: Free report customization (equivalent up to 8 analyst's working hours) with purchase. Addition or alteration to country, regional & segment scope*
The objective of the study is to define market sizes of different segments & countries in recent years and to forecast the values to the coming years. The report is designed to incorporate both qualitative and quantitative aspects of the industry within countries involved in the study.
The report also caters detailed information about the crucial aspects such as driving factors & challenges which will define the future growth of the market. Additionally, it also incorporates potential opportunities in micro markets for stakeholders to invest along with the detailed analysis of competitive landscape and product offerings of key players. The detailed segments and sub-segment of the market are explained below:
By Product:
- Nusinersen
- Onasemnogen Abeparvovec
By Disease Type:
- Type 1 SMA
- Type 2 SMA
- Others
By Distribution Channel:
- Hospital Pharmacies
- Retail Pharmacies
- Others
By Region:
- North America
- U.S.
- Canada
- Europe
- UK
- Germany
- France
- Spain
- Italy
- ROE
- Asia Pacific
- China
- India
- Japan
- Australia
- South Korea
- RoAPAC
- Latin America
- Brazil
- Mexico
- RoLA
- Rest of the World
Table of Contents
Chapter 1. Executive Summary
- 1.1. Market Snapshot
- 1.2. Global & Segmental Market Estimates & Forecasts, 2019-2029 (USD Billion)
- 1.2.1. Spinal Muscular Atrophy Treatment Market, by Region, 2019-2029 (USD Billion)
- 1.2.2. Spinal Muscular Atrophy Treatment Market, by Product, 2019-2029 (USD Billion)
- 1.2.3. Spinal Muscular Atrophy Treatment Market, by Disease Type, 2019-2029 (USD Billion)
- 1.2.4. Spinal Muscular Atrophy Treatment Market, by Distribution Channel, 2019-2029 (USD Billion)
- 1.3. Key Trends
- 1.4. Estimation Methodology
- 1.5. Research Assumption
Chapter 2. Global Spinal Muscular Atrophy Treatment Market Definition and Scope
- 2.1. Objective of the Study
- 2.2. Market Definition & Scope
- 2.2.1. Scope of the Study
- 2.2.2. Industry Evolution
- 2.3. Years Considered for the Study
- 2.4. Currency Conversion Rates
Chapter 3. Global Spinal Muscular Atrophy Treatment Market Dynamics
- 3.1. Spinal Muscular Atrophy Treatment Market Impact Analysis (2019-2029)
- 3.1.1. Market Drivers
- 3.1.1.1. Increasing awareness regarding novel therapies
- 3.1.1.2. Growing prevalence of spinal muscular atrophy
- 3.1.2. Market Challenges
- 3.1.2.1. High costs associated with the approved products
- 3.1.2.2. Dearth of skilled professionals
- 3.1.3. Market Opportunities
- 3.1.3.1. Introduction of new product with high efficacies
- 3.1.3.2. Growing R&D investments
- 3.1.1. Market Drivers
Chapter 4. Global Spinal Muscular Atrophy Treatment Market Industry Analysis
- 4.1. Porter's 5 Force Model
- 4.1.1. Bargaining Power of Suppliers
- 4.1.2. Bargaining Power of Buyers
- 4.1.3. Threat of New Entrants
- 4.1.4. Threat of Substitutes
- 4.1.5. Competitive Rivalry
- 4.2. Futuristic Approach to Porter's 5 Force Model (2019-2029)
- 4.3. PEST Analysis
- 4.3.1. Political
- 4.3.2. Economical
- 4.3.3. Social
- 4.3.4. Technological
- 4.4. Top investment opportunity
- 4.5. Top winning strategies
- 4.6. Industry Experts Prospective
- 4.7. Analyst Recommendation & Conclusion
Chapter 5. Risk Assessment: COVID-19 Impact
- 5.1. Assessment of the overall impact of COVID-19 on the industry
- 5.2. Pre COVID-19 and post COVID-19 Market scenario
Chapter 6. Global Spinal Muscular Atrophy Treatment Market, by Product
- 6.1. Market Snapshot
- 6.2. Global Spinal Muscular Atrophy Treatment Market by Product, Performance - Potential Analysis
- 6.3. Global Spinal Muscular Atrophy Treatment Market Estimates & Forecasts by Product 2019-2029 (USD Billion)
- 6.4. Spinal Muscular Atrophy Treatment Market, Sub Segment Analysis
- 6.4.1. Nusinersen
- 6.4.2. Onasemnogen Abeparvovec
Chapter 7. Global Spinal Muscular Atrophy Treatment Market, by Disease Type
- 7.1. Market Snapshot
- 7.2. Global Spinal Muscular Atrophy Treatment Market by Disease Type, Performance - Potential Analysis
- 7.3. Global Spinal Muscular Atrophy Treatment Market Estimates & Forecasts by Disease Type 2019-2029 (USD Billion)
- 7.4. Spinal Muscular Atrophy Treatment Market, Sub Segment Analysis
- 7.4.1. Type 1 SMA
- 7.4.2. Type 2 SMA
- 7.4.3. Others
Chapter 8. Global Spinal Muscular Atrophy Treatment Market, by Distribution Channel
- 8.1. Market Snapshot
- 8.2. Global Spinal Muscular Atrophy Treatment Market by Distribution Channel, Performance - Potential Analysis
- 8.3. Global Spinal Muscular Atrophy Treatment Market Estimates & Forecasts by Distribution Channel 2019-2029 (USD Billion)
- 8.4. Spinal Muscular Atrophy Treatment Market, Sub Segment Analysis
- 8.4.1. Hospital Pharmacies
- 8.4.2. Retail Pharmacies
- 8.4.3. Others
Chapter 9. Global Spinal Muscular Atrophy Treatment Market, Regional Analysis
- 9.1. Spinal Muscular Atrophy Treatment Market, Regional Market Snapshot
- 9.2. North America Spinal Muscular Atrophy Treatment Market
- 9.2.1. U.S. Spinal Muscular Atrophy Treatment Market
- 9.2.1.1. Product breakdown estimates & forecasts, 2019-2029
- 9.2.1.2. Disease Type breakdown estimates & forecasts, 2019-2029
- 9.2.1.3. Distribution Channel breakdown estimates & forecasts, 2019-2029
- 9.2.2. Canada Spinal Muscular Atrophy Treatment Market
- 9.2.1. U.S. Spinal Muscular Atrophy Treatment Market
- 9.3. Europe Spinal Muscular Atrophy Treatment Market Snapshot
- 9.3.1. U.K. Spinal Muscular Atrophy Treatment Market
- 9.3.2. Germany Spinal Muscular Atrophy Treatment Market
- 9.3.3. France Spinal Muscular Atrophy Treatment Market
- 9.3.4. Spain Spinal Muscular Atrophy Treatment Market
- 9.3.5. Italy Spinal Muscular Atrophy Treatment Market
- 9.3.6. Rest of Europe Spinal Muscular Atrophy Treatment Market
- 9.4. Asia-Pacific Spinal Muscular Atrophy Treatment Market Snapshot
- 9.4.1. China Spinal Muscular Atrophy Treatment Market
- 9.4.2. India Spinal Muscular Atrophy Treatment Market
- 9.4.3. Japan Spinal Muscular Atrophy Treatment Market
- 9.4.4. Australia Spinal Muscular Atrophy Treatment Market
- 9.4.5. South Korea Spinal Muscular Atrophy Treatment Market
- 9.4.6. Rest of Asia Pacific Spinal Muscular Atrophy Treatment Market
- 9.5. Latin America Spinal Muscular Atrophy Treatment Market Snapshot
- 9.5.1. Brazil Spinal Muscular Atrophy Treatment Market
- 9.5.2. Mexico Spinal Muscular Atrophy Treatment Market
- 9.5.3. Rest of Latin America Spinal Muscular Atrophy Treatment Market
- 9.6. Rest of The World Spinal Muscular Atrophy Treatment Market
Chapter 10. Competitive Intelligence
- 10.1. Top Market Strategies
- 10.2. Company Profiles
- 10.2.1. Biogen
- 10.2.1.1. Key Information
- 10.2.1.2. Overview
- 10.2.1.3. Financial (Subject to Data Availability)
- 10.2.1.4. Product Summary
- 10.2.1.5. Recent Developments
- 10.2.2. Novartis AG
- 10.2.3. Ionis Pharmaceuticals Inc.
- 10.2.4. Biohaven Pharmaceuticals
- 10.2.5. F. Hoffmann-La Roche Ltd
- 10.2.6. Cytokinetics
- 10.2.7. Scholar Rock, Inc.
- 10.2.8. PTC Therapeutics
- 10.2.9. NMD PHARMA A/S
- 10.2.10. Astellas Pharma Inc.
- 10.2.1. Biogen
Chapter 11. Research Process
- 11.1. Research Process
- 11.1.1. Data Mining
- 11.1.2. Analysis
- 11.1.3. Market Estimation
- 11.1.4. Validation
- 11.1.5. Publishing
- 11.2. Research Attributes
- 11.3. Research Assumption