|
|
市場調査レポート
商品コード
1172545
電気自動車充電ステーションの世界市場:市場規模、市場シェア、動向分析、機会、予測:製品別(AC、DC)、サプライヤータイプ別、設置タイプ別、地域別(2018年~2028年)Electric Vehicle Charging Station Market- Global Size, Share, Trend Analysis, Opportunity and Forecast Report, 2018-2028, Segmented By Product (AC EV Charging Station, DC EV Charging Station, By Supplier Type, By Installation Type, and By Regions |
||||||
|
|
|||||||


| 電気自動車充電ステーションの世界市場:市場規模、市場シェア、動向分析、機会、予測:製品別(AC、DC)、サプライヤータイプ別、設置タイプ別、地域別(2018年~2028年) |
|
出版日: 2022年12月01日
発行: Blueweave Consulting
ページ情報: 英文 231 Pages
納期: 2~3営業日
|
- 全表示
- 概要
- 図表
- 目次
世界の電気自動車充電ステーションの市場規模は、2021年の70億4,881万米ドルから2028年には約479億8,203万米ドルに達し、予測期間中に32.58%のCAGRで成長すると予測されています。交通機関による二酸化炭素排出量やその他の有害汚染物質の増加、サブスクリプションモデルを利用して充電ステーションを提供するメーカー間のパートナーシップの拡大は、市場成長の大きな送信要因になる可能性があります。
当レポートでは、世界の電気自動車充電ステーション市場について調査しており、市場概要、市場分析、企業プロファイルなど、包括的な情報を提供しています。
目次
第1章 調査の枠組み
第2章 エグゼクティブサマリー
第3章 世界の電気自動車充電ステーション市場の洞察
- 業界バリューチェーン分析
- DROC分析
- 促進要因
- 建設セクターの成長
- 持続可能な材料に対する産業需要の増加
- 自動車産業におけるバイオベースの複合材料の需要の増加
- 環境に配慮した強化繊維の認知度の高まり
- 抑制要因
- 木質複合製品に対する厳しい規制
- 天然繊維複合材料の価格と供給変動
- 機会
- 電子産業における新しい環境に優しい複合材料に対する需要の高まり
- 新しい材料と供給源からの天然繊維複合材の製造
- 持続可能な材料の利用を促進するための政府のイニシアチブ
- その他
- 課題
- 吸湿性・処理温度の制限、およびほぼすべてのポリマーマトリックスとの不適合性
- その他
- 促進要因
- 技術の進歩/最近の開発
- 規制の枠組み
- ポーターのファイブフォース分析
- 供給企業の交渉力
- 買い手の交渉力
- 新規参入業者の脅威
- 代替品の脅威
- 競争の激しさ
第4章 世界の電気自動車充電ステーション市場概要
- 市場規模と予測(2018年~2028年):金額と数量別
- 金額別(100万米ドル)
- 数量別(100万ヶ所)
- 市場シェアと予測
- 製品別
- AC
- DC
- サプライヤータイプ別
- プライベートステーション
- OE充電ステーション
- 設置タイプ別
- 住宅
- 商業
- 地域別
- 北米
- 欧州
- アジア太平洋地域
- ラテンアメリカ
- 中東とアフリカ
- 製品別
第5章 北米の電気自動車充電ステーション市場
第6章 欧州の電気自動車充電ステーション市場
第7章 アジア太平洋の電気自動車充電ステーション市場
第8章 ラテンアメリカの電気自動車充電ステーション市場
第9章 中東およびアフリカの電気自動車充電ステーション市場
第10章 競合情勢
- 主要企業とその製品のリスト
- 市場シェア分析(2021年)
- 競合ベンチマーキング:操作パラメータ別
- 主要な戦略的開発(合併、買収、パートナーシップなど)
第11章 世界の電気自動車充電ステーション市場に対するCOVID-19の影響
第12章 企業プロファイル(企業概要、財務マトリックス、競合情勢、主要な人員、主要な競合、連絡先住所、および戦略的展望)
- General Electric Company
- Aeroenvironment, Inc
- Siemens AG
- Tesla
- SemaConnect, Inc
- ABB Group
- Engie S.A
- Leviton Manufacturing Co.
- Eaton Corporation PLC
- Schneider Electric SE
- ChargePoint, Inc.
- Evgo Service
- Blink Charging
- Qualcomm
- Shell
- その他
第13章 主要な戦略的推奨事項
第14章 調査手法
注:最終納品物では、上記以外の企業の財務情報はデータが利用でき次第、提供されます。
最終納品物では、セグメンテーションおよび企業は、詳細な補足情報により変更される可能性があります。
List of Figures
List of Figure
- Figure 1 Global Electric Vehicle Charging Station Market Segmentation
- Figure 2 Global Electric Vehicle Charging Station Market Value Chain Analysis
- Figure 3 Company Market Share Analysis, 2021
- Figure 4 Global Electric Vehicle Charging Station Market Size, By Value (USD Million), 2018-2028
- Figure 5 Global Electric Vehicle Charging Station Market Size, By Volume (Million Units), 2018-2028
- Figure 6 Global Electric Vehicle Charging Station Market Share, By Product, By Value, 2018-2028
- Figure 7 Global Electric Vehicle Charging Station Market Share, By Product, By Volume, 2018-2028
- Figure 8 Global Electric Vehicle Charging Station Market Share, By Supplier Type, By Value, 2018-2028
- Figure 9 Global Electric Vehicle Charging Station Market Share, By Supplier Type, By Volume, 2018-2028
- Figure 10 Global Electric Vehicle Charging Station Market Share, By Installation Type, By Value, 2018-2028
- Figure 11 Global Electric Vehicle Charging Station Market Share, By Installation Type, By Volume, 2018-2028
- Figure 12 Global Electric Vehicle Charging Station Market Share, By Region, By Value, 2018-2028
- Figure 13 Global Electric Vehicle Charging Station Market Share, By Region, By Volume, 2018-2028
- Figure 14 North America Electric Vehicle Charging Station Market Size, By Value (USD Million), 2018-2028
- Figure 15 North America Electric Vehicle Charging Station Market Size, By Volume (Million Units), 2018-2028
- Figure 16 North America Electric Vehicle Charging Station Market Share, By Product, By Value, 2018-2028
- Figure 17 North America Electric Vehicle Charging Station Market Share, By Product, By Volume, 2018-2028
- Figure 18 North America Electric Vehicle Charging Station Market Share, By Supplier Type, By Value, 2018-2028
- Figure 19 North America Electric Vehicle Charging Station Market Share, By Supplier Type, By Volume, 2018-2028
- Figure 20 North America Electric Vehicle Charging Station Market Share, By Installation Type, By Value, 2018-2028
- Figure 21 North America Electric Vehicle Charging Station Market Share, By Installation Type, By Volume, 2018-2028
- Figure 22 North America Electric Vehicle Charging Station Market Share, By Country, By Value, 2018-2028
- Figure 23 North America Electric Vehicle Charging Station Market Share, By Country, By Volume, 2018-2028
- Figure 24 Europe Electric Vehicle Charging Station Market Size, By Value (USD Million), 2018-2028
- Figure 25 Europe Electric Vehicle Charging Station Market Size, By Volume (Million Units), 2018-2028
- Figure 26 Europe Electric Vehicle Charging Station Market Share, By Product, By Value, 2018-2028
- Figure 27 Europe Electric Vehicle Charging Station Market Share, By Product, By Volume, 2018-2028
- Figure 28 Europe Electric Vehicle Charging Station Market Share, By Supplier Type, By Value, 2018-2028
- Figure 30 Europe Electric Vehicle Charging Station Market Share, By Supplier Type, By Volume, 2018-2028
- Figure 31 Europe Electric Vehicle Charging Station Market Share, By Installation Type, By Value, 2018-2028
- Figure 32 Europe Electric Vehicle Charging Station Market Share, By Installation Type, By Volume, 2018-2028
- Figure 33 Europe Electric Vehicle Charging Station Market Share, By Country, By Value, 2018-2028
- Figure 34 Europe Electric Vehicle Charging Station Market Share, By Country, By Volume, 2018-2028
- Figure 35 Asia-Pacific Electric Vehicle Charging Station Market Size, By Value (USD Million), 2018-2028
- Figure 36 Asia-Pacific Electric Vehicle Charging Station Market Size, By Volume (Million Units), 2018-2028
- Figure 37 Asia-Pacific Electric Vehicle Charging Station Market Share, By Product, By Value, 2018-2028
- Figure 38 Asia-Pacific Electric Vehicle Charging Station Market Share, By Product, By Volume, 2018-2028
- Figure 39 The Asia-Pacific Electric Vehicle Charging Station Market Share, By Supplier Type, By Value, 2018-2028
- Figure 40 The Asia-Pacific Electric Vehicle Charging Station Market Share, By Supplier Type, By Volume, 2018-2028
- Figure 41 The Asia-Pacific Electric Vehicle Charging Station Market Share, By Installation Type, By Value, 2018-2028
- Figure 42 The Asia-Pacific Electric Vehicle Charging Station Market Share, By Installation Type, By Volume, 2018-2028
- Figure 43 The Asia-Pacific Electric Vehicle Charging Station Market Share, By Country, By Value, 2018-2028
- Figure 44 The Asia-Pacific Electric Vehicle Charging Station Market Share, By Country, By Volume, 2018-2028
- Figure 45 Latin America Electric Vehicle Charging Station Market Size, By Value (USD Million), 2018-2028
- Figure 46 Latin America Electric Vehicle Charging Station Market Size, By Volume (Million Units), 2018-2028
- Figure 47 Latin America Electric Vehicle Charging Station Market Share, By Product, By Value, 2018-2028
- Figure 48 Latin America Electric Vehicle Charging Station Market Share, By Product, By Volume, 2018-2028
- Figure 49 Latin America Electric Vehicle Charging Station Market Share, By Supplier Type, By Value, 2018-2028
- Figure 50 Latin America Electric Vehicle Charging Station Market Share, By Supplier Type, By Volume, 2018-2028
- Figure 51 Latin America Electric Vehicle Charging Station Market Share, By Installation Type, By Value, 2018-2028
- Figure 52 Latin America Electric Vehicle Charging Station Market Share, By Installation Type, By Volume, 2018-2028
- Figure 53 Latin America Electric Vehicle Charging Station Market Share, By Country, By Value, 2018-2028
- Figure 54 Latin America Electric Vehicle Charging Station Market Share, By Country, By Volume, 2018-2028
- Figure 55 The Middle East & Africa Electric Vehicle Charging Station Market Size, By Value (USD Million), 2018-2028
- Figure 56 The Middle East & Africa Electric Vehicle Charging Station Market Size, By Volume (Million Units), 2018-2028
- Figure 57 The Middle East & Africa Electric Vehicle Charging Station Market Share, By Product, By Value, 2018-2028
- Figure 58 The Middle East & Africa Electric Vehicle Charging Station Market Share, By Product, By Volume, 2018-2028
- Figure 59 The Middle East & Africa Electric Vehicle Charging Station Market Share, By Supplier Type, By Value, 2018-2028
- Figure 60 The Middle East & Africa Electric Vehicle Charging Station Market Share, By Supplier Type, By Volume, 2018-2028
- Figure 61 The Middle East & Africa Electric Vehicle Charging Station Market Share, By Installation Type, By Value, 2018-2028
- Figure 62 The Middle East & Africa Electric Vehicle Charging Station Market Share, By Installation Type, By Volume, 2018-2028
- Figure 63 The Middle East & Africa Electric Vehicle Charging Station Market Share, By Country, By Value, 2018-2028
- Figure 64 The Middle East & Africa Electric Vehicle Charging Station Market Share, By Country, By Volume, 2018-2028
List of Table
- Table 1 Global Electric Vehicle Charging Station Market Size, By Product, By Value (USD Million), 2018-2028
- Table 2 Global Electric Vehicle Charging Station Market Size, By Product, By Volume (Million Units), 2018-2028
- Table 3 Global Electric Vehicle Charging Station Market Size, By Supplier Type, By Value (USD Million), 2018-2028
- Table 4 Global Electric Vehicle Charging Station Market Size, By Supplier Type, By Volume (Million Units), 2018-2028
- Table 5 Global Electric Vehicle Charging Station Market Size, By Installation Type, By Value (USD Million), 2018-2028
- Table 6 Global Electric Vehicle Charging Station Market Size, By Installation Type, By Volume (Million Units), 2018-2028
- Table 7 Global Electric Vehicle Charging Station Market Size, By Region, By Value (USD Million), 2018-2028
- Table 8 Global Electric Vehicle Charging Station Market Size, By Region, By Volume (Million Units), 2018-2028
- Table 9 North America Electric Vehicle Charging Station Market Size, By Product, By Value (USD Million), 2018-2028
- Table 10 North America Electric Vehicle Charging Station Market Size, By Product, By Volume (Million Units), 2018-2028
- Table 11 North America Electric Vehicle Charging Station Market Size, By Supplier Type, By Value (USD Million), 2018-2028
- Table 12 North America Electric Vehicle Charging Station Market Size, By Supplier Type, By Volume (Million Units), 2018-2028
- Table 13 North America Electric Vehicle Charging Station Market Size, By Installation Type, By Value (USD Million), 2018-2028
- Table 14 North America Electric Vehicle Charging Station Market Size, By Installation Type, By Volume (Million Units), 2018-2028
- Table 15 North America Electric Vehicle Charging Station Market Size, By Country, By Value (USD Million), 2018-2028
- Table 16 North America Electric Vehicle Charging Station Market Size, By Country, By Volume (Million Units), 2018-2028
- Table 17 Europe Electric Vehicle Charging Station Market Size, By Product, By Value (USD Million), 2018-2028
- Table 18 Europe Electric Vehicle Charging Station Market Size, By Product, By Volume (Million Units), 2018-2028
- Table 19 Europe Electric Vehicle Charging Station Market Size, By Supplier Type, By Value (USD Million), 2018-2028
- Table 20 Europe Electric Vehicle Charging Station Market Size, By Supplier Type, By Volume (Million Units), 2018-2028
- Table 21 Europe Electric Vehicle Charging Station Market Size, By Installation Type, By Value (USD Million), 2018-2028
- Table 22 Europe Electric Vehicle Charging Station Market Size, By Installation Type, By Volume (Million Units), 2018-2028
- Table 23 Europe Electric Vehicle Charging Station Market Size, By Country, By Value (USD Million), 2018-2028
- Table 24 Europe Electric Vehicle Charging Station Market Size, By Country, By Volume (Million Units), 2018-2028
- Table 25 Asia-Pacific Electric Vehicle Charging Station Market Size, By Product, By Value (USD Million), 2018-2028
- Table 26 Asia-Pacific Electric Vehicle Charging Station Market Size, By Product, By Volume (Million Units), 2018-2028
- Table 27 The Asia-Pacific Electric Vehicle Charging Station Market Size, By Supplier Type, By Value (USD Million), 2018-2028
- Table 28 The Asia-Pacific Electric Vehicle Charging Station Market Size, By Supplier Type, By Volume (Million Units), 2018-2028
- Table 29 The Asia-Pacific Electric Vehicle Charging Station Market Size, By Installation Type, By Value (USD Million), 2018-2028
- Table 30 The Asia-Pacific Electric Vehicle Charging Station Market Size, By Installation Type, By Volume (Million Units), 2018-2028
- Table 31 The Asia-Pacific Electric Vehicle Charging Station Market Size, By Country, By Value (USD Million), 2018-2028
- Table 32 The Asia-Pacific Electric Vehicle Charging Station Market Size, By Country, By Volume (Million Units), 2018-2028
- Table 33 Latin America Electric Vehicle Charging Station Market Size, By Product, By Value (USD Million), 2018-2028
- Table 34 Latin America Electric Vehicle Charging Station Market Size, By Product, By Volume (Million Units), 2018-2028
- Table 35 Latin America Electric Vehicle Charging Station Market Size, By Supplier Type, By Value (USD Million), 2018-2028
- Table 36 Latin America Electric Vehicle Charging Station Market Size, By Supplier Type, By Volume (Million Units), 2018-2028
- Table 37 Latin America Electric Vehicle Charging Station Market Size, By Installation Type, By Value (USD Million), 2018-2028
- Table 38 Latin America Electric Vehicle Charging Station Market Size, By Installation Type, By Volume (Million Units), 2018-2028
- Table 39 Latin America Electric Vehicle Charging Station Market Size, By Country, By Value (USD Million), 2018-2028
- Table 40 Latin America Electric Vehicle Charging Station Market Size, By Country, By Volume (Million Units), 2018-2028
- Table 41 The Middle East & Africa Electric Vehicle Charging Station Market Size, By Product, By Value (USD Million), 2018-2028
- Table 42 The Middle East & Africa Electric Vehicle Charging Station Market Size, By Product, By Volume (Million Units), 2018-2028
- Table 43 The Middle East & Africa Electric Vehicle Charging Station Market Size, By Supplier Type, By Value (USD Million), 2018-2028
- Table 44 The Middle East & Africa Electric Vehicle Charging Station Market Size, By Supplier Type, By Volume (Million Units), 2018-2028
- Table 45 The Middle East & Africa Electric Vehicle Charging Station Market Size, By Installation Type, By Value (USD Million), 2018-2028
- Table 46 The Middle East & Africa Electric Vehicle Charging Station Market Size, By Installation Type, By Volume (Million Units), 2018-2028
- Table 47 The Middle East & Africa Electric Vehicle Charging Station Market Size, By Country, By Value (USD Million), 2018-2028
- Table 48 The Middle East & Africa Electric Vehicle Charging Station Market Size, By Country, By Volume (Million Units), 2018-2028
- Table 49 General Electric Company Overview
- Table 50 General Electric Company Financial Overview
- Table 51 Aeroenvironment, Inc Company Overview
- Table 52 Aeroenvironment, Inc Financial Overview
- Table 53 Siemens AG Company Overview
- Table 54 Siemens AG Financial Overview
- Table 55 Tesla Company Overview
- Table 56 Tesla Financial Overview
- Table 57 SemaConnect, Inc Company Overview
- Table 58 SemaConnect, Inc Financial Overview
- Table 59 ABB Group Company Overview
- Table 60 ABB Group Financial Overview
- Table 61 Engie S.A Company Overview
- Table 62 Engie S.A Financial Overview
- Table 63 Leviton Manufacturing Co. Company Overview
- Table 64 Leviton Manufacturing Co. Financial Overview
- Table 65 Eaton Corporation PLC Company Overview
- Table 66 Eaton Corporation PLC Financial Overview
- Table 67 Schneider Electric SE Company Overview
- Table 68 Schneider Electric SE Financial Overview
- Table 69 ChargePoint, Inc. Company Overview
- Table 70 ChargePoint, Inc. Financial Overview
- Table 71 Evgo Service Company Overview
- Table 72 Evgo Service Financial Overview
- Table 73 Blink Charging Company Overview
- Table 74 Blink Charging Financial Overview
- Table 75 Qualcomm Company Overview
- Table 76 Qualcomm Financial Overview
- Table 77 Shell Company Overview
- Table 78 Shell Financial Overview
Global Electric Vehicle Charging Station Market to Grow at a CAGR of 32.58% during Forecast Period.
Global Electric Vehicle Charging Station Market is growing at a high CAGR due to the increasing levels of carbon emissions and other hazardous pollutants from transportation have led to the demand for the usage of electric cars. As a result, both business and residential environments require an infrastructure for electric vehicle (EV) charging. Additionally, it is projected that growing partnerships between manufacturers to deliver charging stations utilizing a subscription model would fuel industry development.
A recent study conducted by the strategic consulting and market research firm, BlueWeave Consulting, revealed that the Global Electric Vehicle Charging Station Market was worth USD 7,048.81 million in the year 2021. The market is projected to grow at a CAGR of 32.58%, earning revenues of around USD 47,982.03 million by the end of 2028. The Global Electric Vehicle Charging Station Market is booming because of the expanding digital technology, as well as the increased smart city projects. However, data and privacy risks may be a huge restraining factor for market growth.
EV Charging Stations Market is driven by solar panels
The government and manufacturers are working together to develop clean and affordable power for all; in an attempt to provide customers with the best solution and easier adoption of EVs, solar power panels are developed to reduce the electric vehicle charging cost. For example, in 2022, new legislation that includes increased expenditures in renewable energy and steps to combat climate change was signed into law by President Joe Biden. A 30% solar tax credit is one of its components, and it would encourage more Americans to "go solar" during the following ten years. 3.9 gigawatts of residential solar power systems were installed in 2021, up 34% from 2.9 gigawatts in 2020, according to data from the U.S. Energy Information Administration (EIA), a federal organization that gathers and examines data on the energy sector. According to the Solar Energy Industries Association, household solar also achieved its seventh straight quarterly growth record in the second quarter of 2022.
The infrastructure used currently for EV charging is not standardized, is Hindering the Market
The rise of the electric vehicle market and variations in charging loads are just two variables that have brought to light the necessity for the standardization of charging stations for electric vehicles. Some EV charging stations might only work with a particular voltage. For instance, level 1 charging stations for AC devices offer a voltage of 120V AC, and level 2 charging stations offer a voltage of 208/240V AC. On the other side, DC charging stations use 480V AC to deliver quick charging. For the creation of a supportive ecosystem and an increase in EV sales, governments must standardize charging infrastructure. Different nations utilize various rapid charging standards. China utilizes GB/T, Europe, South Korea, and the US and CCS, while Japan uses CHAdeMO.
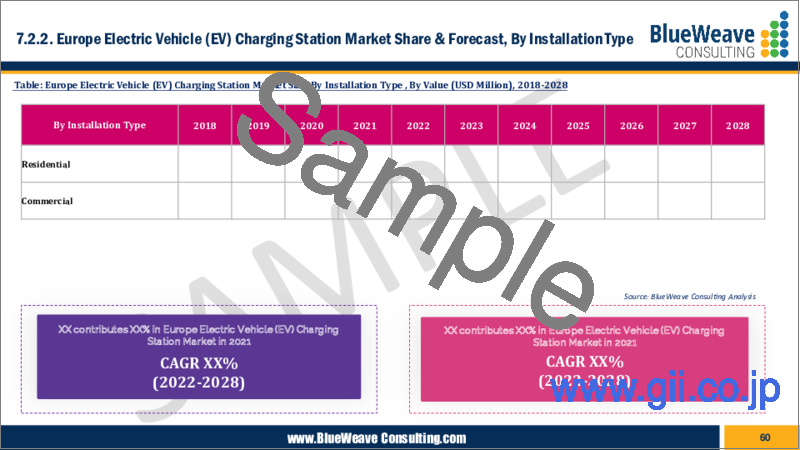
Residential Installation Type segment is anticipated to expand at a faster CAGR
Based on installation type, the market is classified into residential and commercial. Residential installation type is estimated to hold the largest market share in 2021, owing to the consumer demand for electric passenger vehicles. Residential EVSE installation may necessitate alterations to the home's electrical wiring and the choice of various utility electricity rates. The pricing hierarchy that most people adhere to begins at home. The majority of single-passenger automobiles are left in parking lots for 8 to 12 hours at night, and home charging can be simple and frequently less expensive than charging elsewhere. The majority of charging may be done overnight, when electricity prices are lower off-peak, and household electricity is typically less expensive than commercial or industrial electricity.
Impact of COVID-19 on Global EV Charging Station Market
A significant economic depression has been brought on by the COVID-19 pandemic epidemic. Strict lockdowns were implemented in a number of nations in order to control the outbreak; as a result, industrial industries were shut down, supply lines were disrupted, and production schedules were thrown off. Given the severe impact on the demand for electric vehicle charging infrastructure, there has been a 12% reduction in the income earned by EV charging station solution suppliers in 2020. Since the majority of EVSE (Electric Vehicle Supply Equipment) manufacturers globally have been impacted by government restrictions and statewide lockdowns, significant expenditures for the deployment of EV charging infrastructure have been put on hold. For instance, ubitricity and Pod Point in the UK stopped building new charging stations for the Go Ultra Low City Scheme's second phase. Similarly to this, Rolec Services claimed that COVID-19 regulations had forced them to temporarily halt their production of EV charging stations in the United Kingdom. Due to the high installation costs associated with EV charging stations, these changes have had a detrimental influence on the market for those facilities worldwide.
Competitive Landscape
Key players operating in the Global electric vehicle charging station market are: General Electric Company, Aeroenvironment, Inc, Siemens AG, Tesla, SemaConnect, Inc, ABB Group, Engie S.A, Leviton Manufacturing Co., Eaton Corporation PLC, Schneider Electric SE, ChargePoint, Inc., Evgo Service, Blink Charging, Qualcomm, Shell, and other prominent players. These players have adopted various marketing strategies, such as new service launches and partnerships, to expand their presence further as a service market and broaden their customer base.
The in-depth analysis of the report provides information about growth potential, upcoming trends, and statistics of the Global Electric Vehicle Charging Station Market. It also highlights the factors driving forecasts of total market size. The report promises to provide recent technology trends in the Global Electric Vehicle Charging Station Market and industry insights to help decision-makers make sound strategic decisions. Furthermore, the report also analyzes the growth drivers, challenges, and competitive dynamics of the market.
Table of Contents
1. Research Framework
- 1.1. Research Objective
- 1.2. Product Overview
- 1.3. Market Segmentation
2. Executive Summary
3. Global Electric Vehicle Charging Station Market Insights
- 3.1. Industry Value Chain Analysis
- 3.2. DROC Analysis
- 3.2.1. Growth Drivers
- 3.2.1.1. Rapid Growth in the construction sector
- 3.2.1.2. Increase in industrial demand for sustainable material
- 3.2.1.3. Increasing Demand for Bio-based Composites in the Automotive Industry
- 3.2.1.4. Rising awareness of environmentally friendly reinforcing fibers
- 3.2.2. Restraints
- 3.2.2.1. Stringent regulations on wood composite products
- 3.2.2.2. Price and supply volatility of natural fiber composites
- 3.2.3. Opportunities
- 3.2.3.1. Rising Demand for New Eco-friendly Composites in Electronics Industry
- 3.2.3.2. Production of natural fiber composites from new materials and sources
- 3.2.3.3. Government initiatives to encourage sustainable material utilization
- 3.2.3.4. Others
- 3.2.4. Challenges
- 3.2.4.1. Moisture Adsorption, Restricted Processing Temperature, and Incompatibility with Most of the Polymer Matrices
- 3.2.4.2. Others
- 3.2.1. Growth Drivers
- 3.3. Technological Advancements/Recent Developments
- 3.4. Regulatory Framework
- 3.5. Porter's Five Forces Analysis
- 3.5.1. Bargaining Power of Suppliers
- 3.5.2. Bargaining Power of Buyers
- 3.5.3. Threat of New Entrants
- 3.5.4. Threat of Substitutes
- 3.5.5. Intensity of Rivalry
4. Global Electric Vehicle Charging Station Market Overview
- 4.1. Market Size & Forecast by Value & Volume, 2018-2028
- 4.1.1. By Value (USD Million)
- 4.1.2. By Volume (Million Units)
- 4.2. Market Share & Forecast
- 4.2.1. By Product
- 4.2.1.1. AC EV Charging Station
- 4.2.1.1.1. Level 1
- 4.2.1.1.2. Level 2
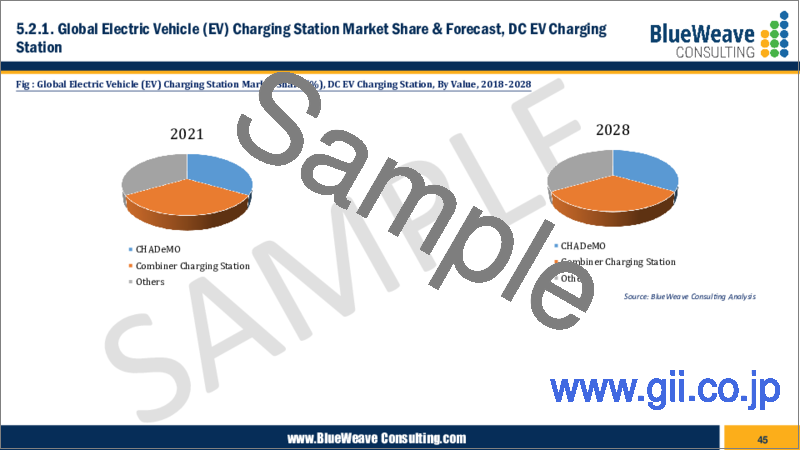
- 4.2.1.2. DC EV Charging Station
- 4.2.1.2.1. CHAdeMo
- 4.2.1.2.2. Combiner Charging Station (CCS)
- 4.2.2. By Supplier Type
- 4.2.2.1. Private Charging Station
- 4.2.2.2. OE Charging Station
- 4.2.3. By Installation Type
- 4.2.3.1. Residential
- 4.2.3.2. Commercial
- 4.2.4. By Region
- 4.2.4.1. North America
- 4.2.4.2. Europe
- 4.2.4.3. Asia Pacific
- 4.2.4.4. Latin America
- 4.2.4.5. Middle East and Africa
- 4.2.1. By Product
5. North America Electric Vehicle Charging Station Market
- 5.1. Market Size & Forecast by Value & Volume, 2018-2028
- 5.1.1. By Value (USD Million)
- 5.1.2. By Volume (Million Units)
- 5.2. Market Share & Forecast
- 5.2.1. By Product
- 5.2.2. By Supplier Type
- 5.2.3. By Installation Type
- 5.2.4. By Country
- 5.2.4.1. United States
- 5.2.4.2. Canada
- 5.2.4.3. Others
6. Europe Electric Vehicle Charging Station Market
- 6.1. Market Size & Forecast by Value & Volume, 2018-2028
- 6.1.1. By Value (USD Million)
- 6.1.2. By Volume (Million Units)
- 6.2. Market Share & Forecast
- 6.2.1. By Product
- 6.2.2. By Supplier Type
- 6.2.3. By Installation Type
- 6.2.4. By Country
- 6.2.4.1. Germany
- 6.2.4.2. UK
- 6.2.4.3. France
- 6.2.4.4. Sweden
- 6.2.4.5. Belgium
- 6.2.4.6. Spain
- 6.2.4.7. Rest of Europe
7. Asia Pacific Electric Vehicle Charging Station Market
- 7.1. Market Size & Forecast by Value & Volume, 2018-2028
- 7.1.1. By Value (USD Million)
- 7.1.2. By Volume (Million Units)
- 7.2. Market Share & Forecast
- 7.2.1. By Product
- 7.2.2. By Supplier Type
- 7.2.3. By Installation Type
- 7.2.4. By Country
- 7.2.4.1. China
- 7.2.4.2. Japan
- 7.2.4.3. India
- 7.2.4.4. South Korea
- 7.2.4.5. Rest of Asia Pacific
8. Latin America Electric Vehicle Charging Station Market
- 8.1. Market Size & Forecast by Value & Volume, 2018-2028
- 8.1.1. By Value (USD Million)
- 8.1.2. By Volume (Million Units)
- 8.2. Market Share & Forecast
- 8.2.1. By Product
- 8.2.2. By Supplier Type
- 8.2.3. By Installation Type
- 8.2.4. By Country
- 8.2.4.1. Argentina
- 8.2.4.2. Brazil
- 8.2.4.3. Mexico
- 8.2.4.4. Argentina
- 8.2.4.5. Rest of Latin America
9. Middle East & Africa Electric Vehicle Charging Station Market
- 9.1. Market Size & Forecast by Value & Volume, 2018-2028
- 9.1.1. By Value (USD Million)
- 9.1.2. By Volume (Million Units)
- 9.2. Market Share & Forecast
- 9.2.1. By Product
- 9.2.2. By Supplier Type
- 9.2.3. By Installation Type
- 9.2.4. By Country
- 9.2.4.1. UAE
- 9.2.4.2. Saudi Arabia
- 9.2.4.3. South Africa
- 9.2.4.4. Rest of Middle East & Africa
10. Competitive Landscape
- 10.1. List of Key Players and Their offerings
- 10.2. Market Share Analysis, 2021
- 10.3. Competitive Benchmarking, By Operating Parameters
- 10.4. Key Strategic Development (Mergers, Acquisitions, Partnerships, etc.)
11. Impact of Covid-19 on Global Electric Vehicle Charging Station Market
12. Company Profile (Company Overview, Financial Matrix, Competitive landscape, Key Personnel, Key Competitors, Contact Address, and Strategic Outlook)
- 12.1. General Electric Company
- 12.2. Aeroenvironment, Inc
- 12.3. Siemens AG
- 12.4. Tesla
- 12.5. SemaConnect, Inc
- 12.6. ABB Group
- 12.7. Engie S.A
- 12.8. Leviton Manufacturing Co.
- 12.9. Eaton Corporation PLC
- 12.10. Schneider Electric SE
- 12.11. ChargePoint, Inc.
- 12.12. Evgo Service
- 12.13. Blink Charging
- 12.14. Qualcomm
- 12.15. Shell
- 12.16. Other Prominent Players
13. Key Strategic Recommendations
14. Research Methodology
- 14.1. Qualitative Research
- 14.1.1. Primary & Secondary Research
- 14.2. Quantitative Research
- 14.3. Market Breakdown & Data Triangulation
- 14.3.1. Secondary Research
- 14.3.2. Primary Research
- 14.4. Breakdown of Primary Research Respondents, By Region
- 14.5. Assumption & Limitation
Note: Financial in information in case of non-listed companies will be provided as per availability
The segmentation and the companies are subjected to modifications based on in-depth secondary for the final deliverable