|
|
市場調査レポート
商品コード
1756522
アジア太平洋の鉱業鉄鋼産業市場:最終用途別、生産手法別、最終製品別、国別 - 分析と予測(2025年~2035年)Asia-Pacific Mining Steel Industry Market: Focus on End-User Application, Production Methodology, End Products, and Country - Analysis and Forecast, 2025-2035 |
||||||
|
|||||||
カスタマイズ可能
|
|||||||


| アジア太平洋の鉱業鉄鋼産業市場:最終用途別、生産手法別、最終製品別、国別 - 分析と予測(2025年~2035年) |
|
出版日: 2025年06月26日
発行: BIS Research
ページ情報: 英文 129 Pages
納期: 1~5営業日
|

全表示
- 概要
- 図表
- 目次
アジア太平洋の鉱業鉄鋼産業の市場規模は、2024年に6,777億米ドルとなりました。
同市場は、4.31%のCAGRで拡大し、2035年には1兆856億米ドルに達すると予測されています。インフラ、自動車、建設産業の拡大は、この地域の急速な都市化と工業化により、アジア太平洋の鉄鋼市場の急成長を後押ししています。脱炭素化は、電気アーク炉(EAF)、水素ベースの直接還元鉄(DRI)、再生可能エネルギーの統合を包含する、より環境に優しい製鉄への地域の取り組みによって加速されています。需要を満たすため、オーストラリアでの鉄鉱石の輸送からインドでの原料炭の調達に至るまで、原料のサプライ・チェーンへの投資が増加しています。コスト競争力と排出削減は、DRIプロセスの電化とEAFの効率化における技術進歩によってさらに改善されます。アジア太平洋は、政府と産業界がグリーン・スチール・ファイナンスの枠組みとロードマップを開発するにつれて、低炭素でエネルギー効率の高い鉄鋼と持続可能な鉱業において世界をリードする立場にあります。
| 主要市場統計 | |
|---|---|
| 予測期間 | 2025年~2035年 |
| 2025年の評価額 | 7,116億米ドル |
| 2035年の予測 | 1兆856億米ドル |
| CAGR | 4.31% |
市場イントロダクション
アジア太平洋の鉱業鉄鋼セクターは、中国、インド、東南アジア、オーストラリアにおける製造業の生産増加、大幅な都市化とインフラ投資に支えられ、急速に拡大しています。鉄鉱石、石炭、冶金原料の上流での増加は、高速鉄道網、スマートシティ開発、再生可能エネルギー設備など、鉄鋼集約型プロジェクトの需要に牽引されています。鉄鋼メーカーは、同時にカーボンフットプリントの削減を急いでいます。水素ベースの直接還元鉄(DRI)プロセス、スクラップ源の拡大による電気アーク炉(EAF)、再生可能エネルギーの統合により、生産フットプリントは変化しています。
操業もまた、デジタル化と自動化によって変化しています。IoTセンサーと予知保全プラットフォームは、製鉄所のスループットを最適化し、予期せぬダウンタイムを削減する一方、AIを活用した地質・鉱山計画ツールは資源回収率を向上させます。鉱山業者と鉄鋼メーカーが、原料の入手、物流の迅速化、商品価格の変動からの保護を目的に合弁会社を設立するにつれ、地域のサプライチェーンの統合はますます進んでいます。しかし、原料価格の変動、発展途上国のインフラ不足、環境・社会・ガバナンス(ESG)法の厳格化など、開発業界は依然として障害に直面しています。今後10年間で、より競争力があり持続可能なAPAC鉱業・鉄鋼コンビナートの基盤は、炭素価格制度、低排出ファイナンスの枠組み、グリーン・スティール・イニシアチブへのインセンティブを通じて、政府によって築かれつつあります。
市場セグメンテーション
セグメンテーション1:最終用途別
- 輸送(自動車およびその他の輸送)
- 建築・建設・インフラ
- 消費財・家電
- 産業機器・製造
- 包装
- その他
セグメンテーション2:生産手法別
- 高炉-基礎酸素炉(BF-BOF)
- 直接還元鉄-電気アーク炉(DRI-EAF)
- その他の新技術
セグメンテーション3:最終製品別
- 炭素鋼
- 合金鋼
- ステンレス鋼
- 高強度鋼
- その他
セグメンテーション4:地域別
- アジア太平洋:中国、日本、インド、韓国、オーストラリア、その他
アジア太平洋の鉱業鉄鋼産業市場動向と促進要因・課題
動向
- グリーン・スチールと脱炭素化:CO2排出量削減のための電気炉(EAF)と水素ベースの直接還元鉄(DRI)の急速な普及
- デジタル化と自動化:AIを活用した鉱山計画、IoTを活用した資産モニタリング、操業効率を高める「スマートミル」の導入
- 地域サプライチェーンの統合:鉄鉱石採掘業者と鉄鋼メーカー(特にオーストラリア、インド、東南アジア)の連携を強化し、原料の確保とコストの安定化を図る
- EAFスクラップの循環化:APACの都市部で拡大するスクラップ回収・リサイクル網が、より柔軟で低コストのEAF鉄鋼生産を支援
- 統合とM&A:大企業が川上の採掘資産や川下の圧延工場を買収し、バリューチェーン全体で価値を獲得
促進要因
- インフラと都市化:インド、ASEAN、中国における交通、住宅、公共事業への継続的な政府支出は、長期的な鉄鋼需要の原動力
- 自動車と白物家電の成長:消費者所得の増加と電動化の動向は、EVや電化製品向けの高品質鋼材消費を促進
- 政策インセンティブ:カーボンプライシング制度、低炭素プロジェクトへの税制優遇措置、資源国の鉱業ロイヤルティが投資決定を形成
- コスト効率の圧力:石炭と鉄鉱石の価格変動が、企業にエネルギー効率の高い技術と垂直統合の採用を促進
課題
- 原材料の変動:鉄鉱石、コークス用石炭、天然ガスの価格変動が利幅を削り、長期計画を複雑にする
- 規制とESGの監視:環境基準の厳格化、地域社会と土地の紛争、貸し手のESG方針により、プロジェクトが遅れ、資金調達コストが上昇する可能性がある
- インフラのボトルネック:アジア太平洋地域の新興市場では、鉄道、港湾、電力が不十分であるため、鉱山から製鉄所までのスループットが低下
- 過剰生産能力リスク:中国の鉄鋼余剰と断続的な輸出規制は、地域の生産者に価格決定の不確実性をもたらす
- スキルと安全性のギャップ:自動化操業のための熟練技術者の採用と、遠隔地の採掘現場における安全基準の維持は、依然として根強いハードル
製品/イノベーション戦略:アジア太平洋の鉱業鉄鋼産業市場は、様々な用途、生産手法、最終製品に基づいてセグメント化されており、貴重な洞察を提供しています。最終用途別には、輸送(自動車およびその他の輸送)、建築・建設・インフラ、消費財・家電、産業機器・製造、包装、その他が含まれます。生産手法別では、高炉-塩基性酸素炉(BF-BOF)、直接還元鉄-電気アーク炉(DRI-EAF)、その他の新興技術に分類されます。最後に、最終製品には炭素鋼、合金鋼、ステンレス鋼、高強度鋼、その他が含まれます。
成長/マーケティング戦略:アジア太平洋の鉱業鉄鋼産業市場は成長を続けています。同市場は、既存および新興の市場参入企業に莫大な機会を提供しています。このセグメントで取り上げられる戦略には、M&A、製品投入、提携・協力、事業拡大、投資などがあります。企業が市場での地位を維持・強化するために好む戦略には、主に製品開発が含まれます。
競合戦略:本調査で分析・プロファイリングしたAPAC鉱業鉄鋼産業市場の主要企業プロファイルには、鉱業・鉄鋼産業の専門知識を有する専門家が含まれています。さらに、パートナーシップ、協定、協力などの包括的な競合情勢は、市場の未開拓の収益ポケットを理解する上で読者を支援することが期待されます。
主要市場参入企業と競合情勢
アジア太平洋の鉱業鉄鋼産業市場でプロファイルされている企業は、企業のカバレッジ、製品ポートフォリオ、市場浸透を分析した主要専門家から収集した情報に基づいて選択されています。
目次
エグゼクティブサマリー
第1章 市場
- 動向:現状と将来への影響評価
- 鉱業および鉄鋼生産プロセスの自動化
- 新興市場からの需要増加
- サプライチェーンの概要
- 特許出願動向(国別、企業別)
- 市場力学の概要
- 市場促進要因
- 市場抑制要因
- 市場機会
- 鉄鋼生産シナリオ
- 生産能力の見通し(2024~2034年)
- 規制状況
- ステークホルダー分析
- 生産プロセス別設備容量(高炉-BOFおよびDRI-EAF)
- 今後のプロジェクトと容量増加(2025年~2035年)
- 進行中の投資
- スクラップリサイクル市場概要
- 排出削減イニシアチブ(鉱業から鉄鋼業への移行)
- グリーンスチール市場の見通し
- 市場規模と成長予測(2024年~2034年)
- グリーンスチールが従来の鉄鋼市場に与える影響
- グリーンスチール導入の課題と促進要因
第2章 地域
- 地域のサマリー
- アジア太平洋
- 市場
- 用途
- 製品
- 鉱業・鉄鋼産業の生産シナリオ
- アジア太平洋(国別)
第3章 市場-競合ベンチマーキングと企業プロファイル
- 今後の見通し
- 地理的評価
- 企業プロファイル
- NIPPON STEEL CORPORATION
- China Ansteel Group Corporation Limited
- China Jianlong Steel Industriai Co Ltd.
- Tata Steel
- JSW
- JFE Steel Corporation
- Shandong Lenser materials Co.,LTD.
- HYUNDAI STEEL
- Jindal Steel & Power Limited
- SAIL
第4章 調査手法
List of Figures
- Figure 1: Asia-Pacific Mining Steel Industry Market (by Scenario), $Billion, 2025, 2028, and 2035
- Figure 2: Mining-Steel Industry Market (by Region), $Billion, 2024, 2028, and 2035
- Figure 3: Asia-Pacific Mining Steel Industry Market (by End-Use Application), $Billion, 2024, 2028, and 2035
- Figure 4: Asia-Pacific Mining Steel Industry Market (by Production Methodology), $Billion, 2024, 2028, and 2035
- Figure 5: Asia-Pacific Mining Steel Industry Market (by End Products), $Billion, 2024, 2028, and 2035
- Figure 6: Key Events
- Figure 7: Cumulative Growth of Autonomous Haulage System (AHS) Trucks in Open-Pit Mining Operations, 2019-2023
- Figure 8: Estimated Country-Wise Deployment of AHS Trucks, 2023
- Figure 9: Supply Chain
- Figure 10: Value Chain
- Figure 11: Key Iron Ore Producing Countries and their Mining Capacity, Million Tons, 2023
- Figure 12: Key Coking Coal Exporting Nations, % Share, 2023
- Figure 13: Pricing Analysis of the Mining Steel Industry Market, $/Ton, 2024-2035
- Figure 14: Stakeholder Mapping across Value Chain
- Figure 15: Patent Analysis (by Country), January 2022-March 2025
- Figure 16: Patent Analysis (by Company), January 2022-March 2025
- Figure 17: Population Living in Urban and Rural Areas, $Billion, 2019-2023
- Figure 18: Regional Private Participation in Infrastructure, $Billion, 2022 and 2023
- Figure 19: Additional Financing Included in the Bipartisan Infrastructure Law, $Billion
- Figure 20: Estimated Capital Expenditures for Top Six Large Steel Companies, $Billion
- Figure 21: Production Capacity Outlook of Mining Steel Industry Market, Million Tons, 2024-2034
- Figure 22: Stakeholder Analysis in the Mining Steel Industry Market
- Figure 23: Estimated Installed Capacity by Blast Furnace-BOF Process in Different Regions, Million Tons, 2021-2024
- Figure 24: Estimated Installed Capacity by DRI-EAF Process in Different Regions, Million Tons, 2021-2024
- Figure 25: Estimated Steel Capacity (TTPA) by Development Status in Each Region, Million Tons, 2025
- Figure 26: Steel Production Output
- Figure 27: Green Steel Market (by Scenario), $Billion, 2023, 2026, and 2034
- Figure 28: Conventional Steel Overview
- Figure 29: Production Process Overview
- Figure 30: Companies Across the Green Steel Value Chain
- Figure 31: North Major Steel Producers in Asia-Pacific: Headquarters and 2023 Steel Production
- Figure 32: Estimated Crude Steel Production Capacity and Actual Crude Steel Production in Asia-Pacific, Million Tons, 2021-2024
- Figure 33: China Mining-Steel Industry Market, $Billion, 2024-2035
- Figure 34: Total Crude Steel Production, China, Thousand Tons, 2021-2024
- Figure 35: Installed Capacity and Production by BF-BAF Process, Million Tons, 2021-2024
- Figure 36: Installed Capacity and Production by DRI-EAF Process, Million Tons, 2021-2024
- Figure 37: Steel Scrap Use for Steelmaking in China, Million Tons, 2019-2021
- Figure 38: Raw Materials Import Countries/Location
- Figure 39: Japan Mining-Steel Industry Market, $Billion, 2024-2035
- Figure 40: Total Crude Steel Production, Japan, Thousand Tons, 2021-2024
- Figure 41: Installed Capacity and Production by BF-BAF Process, Million Tons, 2021-2024
- Figure 42: Installed Capacity and Production by DRI-EAF Process, Million Tons, 2021-2024
- Figure 43: Raw Materials Import Countries/Location
- Figure 44: Steel Scrap Use for Steelmaking in Japan, Million Tons, 2019-2021
- Figure 45: India Mining-Steel Industry Market, $Billion, 2024-2035
- Figure 46: Total Crude Steel Production, India, Thousand Tons, 2021-2024
- Figure 47: Installed Capacity and Production by BF-BAF Process, Million Tons, 2021-2024
- Figure 48: Installed Capacity and Production by DRI-EAF Process, Million Tons, 2021-2024
- Figure 49: Steel Scrap Imports in India, Million Tons, 2019-2021
- Figure 50: Raw Materials Import Countries/Location
- Figure 51: South Korea Mining-Steel Industry Market, $Billion, 2024-2035
- Figure 52: Total Crude Steel Production, South Korea, Thousand Tons, 2021-2024
- Figure 53: Installed Capacity and Production by BF-BAF Process, Million Tons, 2021-2024
- Figure 54: Installed Capacity and Production by DRI-EAF Process, Million Tons, 2021-2024
- Figure 55: Raw Materials Import Countries/Location
- Figure 56: Australia Mining-Steel Industry Market, $Billion, 2024-2035
- Figure 57: Total Crude Steel Production, Australia, Thousand Tons, 2021-2024
- Figure 58: Installed Capacity and Production by BF-BAF Process, Million Tons, 2021-2024
- Figure 59: Installed Capacity and Production by DRI-EAF Process, Million Tons, 2021-2024
- Figure 60: Steel Scrap Exports, Australia, Million Tons, 2019-2021
- Figure 61: Raw Materials Import Countries/Location
- Figure 62: Rest-of-Asia-Pacific Mining-Steel Industry Market, $Billion, 2024-2035
- Figure 63: Installed Capacity and Production by BF-BAF Process, Million Tons, 2021-2024
- Figure 64: Installed Capacity and Production by DRI-EAF Process, Million Tons, 2021-2024
- Figure 65: Raw Materials Import Countries/Location
- Figure 66: Strategic Initiatives, January 2022-March 2025
- Figure 67: Share of Strategic Initiatives, 2023
- Figure 68: Data Triangulation
- Figure 69: Top-Down and Bottom-Up Approach
- Figure 70: Assumptions and Limitations
List of Tables
- Table 1: Market Snapshot
- Table 2: Opportunities across Region
- Table 3: Competitive Landscape Snapshot
- Table 4: Trends Overview
- Table 5: Impact Analysis of Market Navigating Factors, 2024-2035
- Table 6: Major Infrastructure Projects and Expected Steel Demand Increase
- Table 7: Regulations/Standards in the Mining Steel Industry
- Table 8: Upcoming Projects and Capacity Additions in the Mining Steel Industry Market
- Table 9: World's Largest Iron Ore Producers and their Capacity
- Table 10: Ongoing Investments in the Mining Steel Industry Market
- Table 11: Lifespan of Steel Products and their Recycling Rates
- Table 12: Recycled Steel Use in Crude Steel Production, Million Tons, 2022
- Table 13: Climate Targets of Steel Manufacturers
- Table 14: Mining-Steel Industry Market (by Region), $Billion, 2024-2035
- Table 15: Asia-Pacific Mining-Steel Industry Market (by End-Use Application), $Billion, 2024-2035
- Table 16: Asia-Pacific Mining-Steel Industry Market (by Production Methodology), $Billion, 2024-2035
- Table 17: Asia-Pacific Mining-Steel Industry Market (by End Products), $Billion, 2024-2035
- Table 18: China Mining-Steel Industry Market (by End-Use Application), $Billion, 2024-2035
- Table 19: China Mining-Steel Industry Market (by Production Methodology), $Billion, 2024-2035
- Table 20: China Mining-Steel Industry Market (by End Products), $Billion, 2024-2035
- Table 21: List of Upcoming Projects in China
- Table 22: Investment Scenario in China
- Table 23: Japan Mining-Steel Industry Market (by End-Use Application), $Billion, 2024-2035
- Table 24: Japan Mining-Steel Industry Market (by Production Methodology), $Billion, 2024-2035
- Table 25: Japan Mining-Steel Industry Market (by End Products), $Billion, 2024-2035
- Table 26: List of Upcoming Projects in Japan
- Table 27: Investment Scenario in Japan
- Table 28: India Mining-Steel Industry Market (by End-Use Application), $Billion, 2024-2035
- Table 29: India Mining-Steel Industry Market (by Production Methodology), $Billion, 2024-2035
- Table 30: India Mining-Steel Industry Market (by End Products), $Billion, 2024-2035
- Table 31: List of Upcoming Projects in India
- Table 32: Investment Scenario in India
- Table 33: South Korea Mining-Steel Industry Market (by End-Use Application), $Billion, 2024-2035
- Table 34: South Korea Mining-Steel Industry Market (by Production Methodology), $Billion, 2024-2035
- Table 35: South Korea Mining-Steel Industry Market (by End Products), $Billion, 2024-2035
- Table 36: List of Upcoming Projects in South Korea
- Table 37: Investment Scenario in South Korea
- Table 38: Australia Mining-Steel Industry Market (by End-Use Application), $Billion, 2024-2035
- Table 39: Australia Mining-Steel Industry Market (by Production Methodology), $Billion, 2024-2035
- Table 40: Australia Mining-Steel Industry Market (by End Products), $Billion, 2024-2035
- Table 41: List of Upcoming Projects in Australia
- Table 42: Investment Scenario in Australia
- Table 43: Rest-of-Asia-Pacific Mining-Steel Industry Market (by End-Use Application), $Billion, 2024-2035
- Table 44: Rest-of-Asia-Pacific Mining-Steel Industry Market (by Production Methodology), $Billion, 2024-2035
- Table 45: Rest-of-Asia-Pacific Mining-Steel Industry Market (by End Products), $Billion, 2024-2035
- Table 46: List of Upcoming Projects in Rest-of-Asia-Pacific
- Table 47: Investment Scenario in Rest-of-Asia-Pacific
- Table 48: Market Share
This report can be delivered in 2 working days.
Introduction to Asia-Pacific Mining Steel Industry Market
The Asia-Pacific mining steel industry market was valued at $677.7 billion in 2024 and is projected to grow at a CAGR of 4.31%, reaching $1,085.6 billion by 2035. The expanding infrastructure, automotive, and construction industries are fuelling the APAC steel market's surge due to the region's fast urbanisation and industrialisation. Decarbonisation is being accelerated by the region's effort for greener steelmaking, which embraces electric-arc furnaces (EAF), hydrogen-based direct reduced iron (DRI), and renewable energy integration. To fulfil demand, investments in supply chains for raw materials are increasing, from the transportation of iron ore in Australia to the procurement of coking coal in India. Cost competitiveness and emissions reductions are further improved by technological advancements in DRI process electrification and EAF efficiency. APAC is positioned to take the lead in low-carbon, energy-efficient steel and sustainable mining worldwide as governments and industry develop green-steel financing frameworks and roadmaps.
| KEY MARKET STATISTICS | |
|---|---|
| Forecast Period | 2025 - 2035 |
| 2025 Evaluation | $711.6 Billion |
| 2035 Forecast | $1,085.6 Billion |
| CAGR | 4.31% |
Market Introduction
The mining steel sector in the Asia-Pacific (APAC) region is expanding rapidly, supported by increased manufacturing production in China, India, Southeast Asia, and Australia, as well as significant urbanisation and infrastructure investment. Upstream increase in iron ore, coal, and metallurgical raw materials is being driven by the demand for steel-intensive projects, such as high-speed rail networks, smart city developments, and renewable energy installations. Steel producers are rushing to lower their carbon footprints at the same time. Production footprints are changing due to hydrogen-based direct reduced iron (DRI) processes, electric-arc furnaces (EAF) driven by expanding scrap sources, and renewable energy integration.
Operations are also being transformed by digitalisation and automation: IoT sensors and predictive maintenance platforms optimise mill throughput and reduce unexpected downtime, while AI-driven geology and mine-planning tools improve resource recovery. As miners and steel makers establish joint ventures to obtain feedstock, expedite logistics, and protect against commodity price volatility, regional supply-chain integration is becoming more and more integrated. However, the industry continues to confront obstacles like as fluctuations in the price of raw materials, infrastructural shortages in developing nations, and stricter environmental, social, and governance (ESG) laws. The foundation for a more competitive and sustainable APAC mining-steel complex in the next ten years is being laid by governments through carbon-pricing schemes, low-emissions finance frameworks, and incentives for green-steel initiatives.
Market Segmentation
Segmentation 1: by End-Use Application
- Transportation (Automotive and Other Transportation)
- Building, Construction, and Infrastructure
- Consumer Goods and Appliances
- Industrial Equipment and Manufacturing
- Packaging
- Others
Segmentation 2: by Production Methodology
- Blast Furnace-Basic Oxygen Furnace (BF-BOF)
- Direct Reduced Iron - Electric Arc Furnace (DRI-EAF)
- Other Emerging Technologies
Segmentation 3: by End Products
- Carbon Steel
- Alloy Steel
- Stainless Steel
- High-Strength Steel
- Others
Segmentation 4: by Region
- Asia-Pacific: China, Japan, India, South Korea, Australia, and Rest-of-Asia-Pacific
APAC Mining Steel Industry Market Trends, Drivers and Challenges
Trends
- Green-steel and decarbonization: Rapid uptake of electric-arc furnaces (EAFs) and hydrogen-based direct reduced iron (DRI) to lower CO2 emissions.
- Digitalization & automation: Deployment of AI-driven mine planning, IoT-enabled asset monitoring, and "smart mills" to boost operational efficiency.
- Regional supply-chain integration: Closer coordination between iron-ore miners and steelmakers-especially in Australia, India, and Southeast Asia-to secure feedstock and stabilize costs.
- EAF-scrap circularity: Growing scrap collection and recycling networks in urban APAC centers support more flexible, lower-capex EAF steel production.
- Consolidation & M&A: Larger players acquiring upstream mining assets or downstream rolling mills to capture value across the value chain.
Drivers
- Infrastructure & urbanization: Continued government spending on transport, housing, and utilities in India, ASEAN, and China fuels long-term steel demand.
- Automotive & white-goods growth: Rising consumer incomes and electrification trends drive higher-quality steel consumption for EVs and appliances.
- Policy incentives: Carbon-pricing schemes, tax rebates for low-carbon projects, and resource-nation mining royalties shape investment decisions.
- Cost-efficiency pressures: Volatile coal and iron-ore prices push firms to adopt energy-efficient technologies and vertical integration.
Challenges
- Raw-material volatility: Iron-ore, coking-coal, and natural-gas price swings erode margins and complicate long-term planning.
- Regulatory & ESG scrutiny: Stricter environmental standards, community-land disputes, and lender ESG policies can delay projects and raise funding costs.
- Infrastructure bottlenecks: Inadequate rail, port, and power in emerging APAC markets hamper mine-to-mill throughput.
- Overcapacity risk: China's steel surplus and intermittent export restrictions create pricing uncertainty for regional producers.
- Skill & safety gaps: Recruiting skilled technicians for automated operations and maintaining safety standards in remote mining sites remain persistent hurdles.
How can this report add value to an organization?
Product/Innovation Strategy: The APAC mining steel industry market is segmented based on various applications, production methodology, and end-products, which provides valuable insights. By end-use application segment includes transportation (automotive and other transportation), building, construction, and infrastructure, consumer goods and appliances, industrial equipment and manufacturing, packaging, and others. By production methodology, the market is categorized into a blast furnace-basic oxygen furnace (BF-BOF), direct reduced iron-electric arc furnace (DRI-EAF), and other emerging technologies. Lastly, the end products include carbon steel, alloy steel, stainless steel, high-strength steel, and others.
Growth/Marketing Strategy: The APAC mining steel industry market has been growing. The market offers enormous opportunities for existing and emerging market players. Some of the strategies covered in this segment are mergers and acquisitions, product launches, partnerships and collaborations, business expansions, and investments. The strategies preferred by companies to maintain and strengthen their market position primarily include product development.
Competitive Strategy: The key players in the APAC mining steel industry market analyzed and profiled in the study include professionals with expertise in the mining and steel industry. Additionally, a comprehensive competitive landscape such as partnerships, agreements, and collaborations are expected to aid the reader in understanding the untapped revenue pockets in the market.
Key Market Players and Competition Synopsis
The companies that are profiled in the Asia-Pacific mining steel industry market have been selected based on inputs gathered from primary experts who have analyzed company coverage, product portfolio, and market penetration.
Some of the prominent names in this market are:
- NIPPON STEEL CORPORATION
- China Ansteel Group Corporation Limited
- China Jianlong Steel Industriai Co Ltd.
- Tata Steel
- JSW
- JFE Steel Corporation
- Shandong Lenser materials Co.,LTD.
- HYUNDAI STEEL
- Jindal Steel & Power Limited
- SAIL
Table of Contents
Executive Summary
Scope and Definition
1 Markets
- 1.1 Trends: Current and Future Impact Assessment
- 1.1.1 Automation in Mining and Steel Production Processes
- 1.1.2 Increased Demand from Emerging Markets
- 1.2 Supply Chain Overview
- 1.2.1 Value Chain Analysis
- 1.2.1.1 Key Iron Ore Producing Nations and Mining Capacity
- 1.2.1.2 Key Coking Coal Exporting Nations
- 1.2.2 Supply Chain Constraints
- 1.2.3 Impact of Geopolitical Issues on Steel Production
- 1.2.4 Pricing Analysis
- 1.2.5 Market Map (Stakeholder Mapping across Value Chain)
- 1.2.1 Value Chain Analysis
- 1.3 Patent Filing Trend (by Country, Company)
- 1.4 Market Dynamics Overview
- 1.4.1 Market Drivers
- 1.4.1.1 Urbanization and Infrastructure Growth
- 1.4.1.2 Public-Private Investments in Infrastructure
- 1.4.2 Market Restraints
- 1.4.2.1 Volatility in Raw Material Prices
- 1.4.2.2 Geopolitical and Trade Tensions
- 1.4.3 Market Opportunities
- 1.4.3.1 Growing Demand for Specialty Steel Products
- 1.4.3.2 Technological Innovation in Steelmaking
- 1.4.1 Market Drivers
- 1.5 Steel Production Scenario
- 1.5.1 Production Capacity Outlook (2024-2034)
- 1.5.2 Regulatory Landscape
- 1.5.3 Stakeholder Analysis
- 1.5.4 Installed Capacity by Production Process (Blast Furnace-BOF and DRI-EAF)
- 1.5.5 Upcoming Projects and Capacity Additions (2025-2035)
- 1.5.6 Ongoing Investments
- 1.5.7 Scrap Recycling Market Overview
- 1.5.8 Emission Reduction Initiatives (Mining Steel Industry Transition)
- 1.6 Green-Steel Market Outlook
- 1.6.1 Market Size and Growth Forecast (2024-2034)
- 1.6.2 Impact of Green Steel on Conventional Steel Market
- 1.6.3 Challenges and Enablers for Green-Steel Adoption
2 Regions
- 2.1 Regional Summary
- 2.2 Asia-Pacific
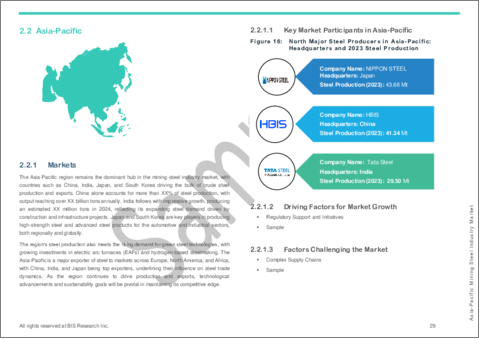
- 2.2.1 Markets
- 2.2.1.1 Key Market Participants in Asia-Pacific
- 2.2.1.2 Driving Factors for Market Growth
- 2.2.1.3 Factors Challenging the Market
- 2.2.2 Application
- 2.2.3 Product
- 2.2.4 Mining-Steel Industry Production Scenario
- 2.2.5 Asia-Pacific (by Country)
- 2.2.5.1 China
- 2.2.5.1.1 Application
- 2.2.5.1.2 Product
- 2.2.5.1.3 Installed Capacity and Production by Process
- 2.2.5.1.3.1 Upcoming Projects
- 2.2.5.1.3.2 Ongoing Investments
- 2.2.5.1.3.3 Scrap Recycling Overview
- 2.2.5.1.4 Raw Material Analysis (Iron Ore, Coking Coal, Scrap)
- 2.2.5.1.4.1 Consumption by Key Companies
- 2.2.5.1.4.2 Import Locations/Countries
- 2.2.5.2 Japan
- 2.2.5.2.1 Application
- 2.2.5.2.2 Product
- 2.2.5.2.3 Installed Capacity and Production by Process
- 2.2.5.2.3.1 Upcoming Projects
- 2.2.5.2.3.2 Ongoing Investments
- 2.2.5.2.3.3 Scrap Recycling Overview
- 2.2.5.2.4 Raw Material Analysis (Iron Ore, Coking Coal, Scrap)
- 2.2.5.2.4.1 Consumption by Key Companies
- 2.2.5.2.4.2 Import Locations/Countries
- 2.2.5.3 India
- 2.2.5.3.1 Application
- 2.2.5.3.2 Product
- 2.2.5.3.3 Installed Capacity and Production by Process
- 2.2.5.3.3.1 Upcoming Projects
- 2.2.5.3.3.2 Ongoing Investments
- 2.2.5.3.3.3 Scrap Recycling Overview
- 2.2.5.3.4 Raw Material Analysis (Iron Ore, Coking Coal, Scrap)
- 2.2.5.3.4.1 Consumption by Key Companies
- 2.2.5.3.4.2 Import Locations/Countries
- 2.2.5.4 South Korea
- 2.2.5.4.1 Application
- 2.2.5.4.2 Product
- 2.2.5.4.3 Installed Capacity and Production by Process
- 2.2.5.4.3.1 Upcoming Projects
- 2.2.5.4.3.2 Ongoing Investments
- 2.2.5.4.3.3 Scrap Recycling Overview
- 2.2.5.4.4 Raw Material Analysis (Iron Ore, Coking Coal, Scrap)
- 2.2.5.4.4.1 Consumption by Key Companies
- 2.2.5.4.4.2 Import Locations/Countries
- 2.2.5.5 Australia
- 2.2.5.5.1 Application
- 2.2.5.5.2 Product
- 2.2.5.5.3 Installed Capacity and Production by Process
- 2.2.5.5.3.1 Upcoming Projects
- 2.2.5.5.3.2 Ongoing Investments
- 2.2.5.5.3.3 Scrap Recycling Overview
- 2.2.5.5.4 Raw Material Analysis (Iron Ore, Coking Coal, Scrap)
- 2.2.5.5.4.1 Consumption by Key Companies
- 2.2.5.5.4.2 Import Locations/Countries
- 2.2.5.6 Rest-of-Asia-Pacific
- 2.2.5.6.1 Application
- 2.2.5.6.2 Product
- 2.2.5.6.3 Installed Capacity and Production by Process
- 2.2.5.6.3.1 Upcoming Projects
- 2.2.5.6.3.2 Ongoing Investments
- 2.2.5.6.3.3 Scrap Recycling Overview
- 2.2.5.6.4 Raw Material Analysis (Iron Ore, Coking Coal, Scrap)
- 2.2.5.6.4.1 Consumption by Key Companies
- 2.2.5.6.4.2 Import Locations/Countries
- 2.2.5.1 China
- 2.2.1 Markets
3 Markets - Competitive Benchmarking and Company Profiles
- 3.1 Next Frontiers
- 3.2 Geographic Assessment
- 3.3 Company Profiles
- 3.3.1 NIPPON STEEL CORPORATION
- 3.3.1.1 Overview
- 3.3.1.2 Top Products/Product Portfolio
- 3.3.1.3 Top Competitors
- 3.3.1.4 End-Use Industry
- 3.3.1.5 Key Personnel
- 3.3.1.6 Analyst View
- 3.3.1.7 Market Share, 2023
- 3.3.2 China Ansteel Group Corporation Limited
- 3.3.2.1 Overview
- 3.3.2.2 Top Products/Product Portfolio
- 3.3.2.3 Top Competitors
- 3.3.2.4 End-Use Industry
- 3.3.2.5 Key Personnel
- 3.3.2.6 Analyst View
- 3.3.2.7 Market Share, 2023
- 3.3.3 China Jianlong Steel Industriai Co Ltd.
- 3.3.3.1 Overview
- 3.3.3.2 Top Products/Product Portfolio
- 3.3.3.3 Top Competitors
- 3.3.3.4 End-Use Industry
- 3.3.3.5 Analyst View
- 3.3.3.6 Market Share, 2023
- 3.3.4 Tata Steel
- 3.3.4.1 Overview
- 3.3.4.2 Top Products/Product Portfolio
- 3.3.4.3 Top Competitors
- 3.3.4.4 End-Use Industry
- 3.3.4.5 Key Personnel
- 3.3.4.6 Analyst View
- 3.3.4.7 Market Share, 2023
- 3.3.5 JSW
- 3.3.5.1 Overview
- 3.3.5.2 Top Products/Product Portfolio
- 3.3.5.3 Top Competitors
- 3.3.5.4 End-Use Industry
- 3.3.5.5 Key Personnel
- 3.3.5.6 Analyst View
- 3.3.5.7 Market Share, 2023
- 3.3.6 JFE Steel Corporation
- 3.3.6.1 Overview
- 3.3.6.2 Top Products/Product Portfolio
- 3.3.6.3 Top Competitors
- 3.3.6.4 End-Use Industry
- 3.3.6.5 Key Personnel
- 3.3.6.6 Analyst View
- 3.3.6.7 Market Share, 2023
- 3.3.7 Shandong Lenser materials Co.,LTD.
- 3.3.7.1 Overview
- 3.3.7.2 Top Products/Product Portfolio
- 3.3.7.3 Top Competitors
- 3.3.7.4 End-Use Industry
- 3.3.7.5 Analyst View
- 3.3.7.6 Market Share, 2023
- 3.3.8 HYUNDAI STEEL
- 3.3.8.1 Overview
- 3.3.8.2 Top Products/Product Portfolio
- 3.3.8.3 Top Competitors
- 3.3.8.4 End-Use Industry
- 3.3.8.5 Key Personnel
- 3.3.8.6 Analyst View
- 3.3.8.7 Market Share, 2023
- 3.3.9 Jindal Steel & Power Limited
- 3.3.9.1 Overview
- 3.3.9.2 Top Products/Product Portfolio
- 3.3.9.3 Top Competitors
- 3.3.9.4 End-Use Industry
- 3.3.9.5 Key Personnel
- 3.3.9.6 Analyst View
- 3.3.9.7 Market Share, 2023
- 3.3.10 SAIL
- 3.3.10.1 Overview
- 3.3.10.2 Top Products/Product Portfolio
- 3.3.10.3 Top Competitors
- 3.3.10.4 End-Use Industry
- 3.3.10.5 Key Personnel
- 3.3.10.6 Analyst View
- 3.3.10.7 Market Share, 2023
- 3.3.1 NIPPON STEEL CORPORATION
4 Research Methodology
- 4.1 Data Sources
- 4.1.1 Primary Data Sources
- 4.1.2 Secondary Data Sources
- 4.1.3 Data Triangulation
- 4.2 Market Estimation and Forecast
