|
|
市場調査レポート
商品コード
1732576
核融合エネルギー市場- 世界と地域の分析:用途別、技術別、燃料サイクル別、国別 - 分析と予測(2025年~2034年)Fusion Energy Market - A Global and Regional Analysis: Focus on Application, Technology, Fuel Cycle, and Country Analysis - Analysis and Forecast, 2025-2034 |
||||||

|
|||||||
カスタマイズ可能
|
|||||||

| 核融合エネルギー市場- 世界と地域の分析:用途別、技術別、燃料サイクル別、国別 - 分析と予測(2025年~2034年) |
|
出版日: 2025年05月26日
発行: BIS Research
ページ情報: 英文 120 Pages
納期: 1~5営業日
|

全表示
- 概要
- 図表
- 目次
世界の核融合エネルギー市場は、大規模な国際共同研究、政府支援の研究コンソーシアム、急成長する民間ベンチャー企業群からなるダイナミックなエコシステムによって特徴付けられ、そのすべてが磁気閉じ込め(トカマクとステラレータ)と慣性閉じ込めアプローチに集中しています。
Commonwealth Fusion Systems、TAE Technologies、General Fusionのような企業は、高温超伝導マグネット、先進プラズマ加熱、独自のターゲット設計を導入し、プロトタイプのタイムラインを早めています。AI/ML駆動プラズマ制御、極端な中性子束に耐えることができる新しい耐火物材料、モジュール式原子炉構造における同時進行の進歩は、スケールアップのリスクを回避し、費用対効果が高く、商業的に実行可能な核融合発電を達成するというこの分野のコミットメントを強調しています。
核融合エネルギー市場のライフサイクル段階
| 主要市場統計 | |
|---|---|
| 予測期間 | 2025年~2034年 |
| 2025年の評価 | 2,914億2,000万米ドル |
| 2034年の予測 | 4,452億米ドル |
| CAGR | 4.82% |
核融合エネルギーは、その市場ライフサイクルの後期研究開発段階と初期実証段階にあり、大半の技術は技術成熟度レベル(TRLs)4~7にあり、ベンチスケールのブレークスルーをエンジニアリング・プロトタイプに変換しています。政府や系統運用者が規制の枠組みや許認可の道筋を準備する一方で、パイロットプラントが連続運転やトリチウム燃料サイクルを検証するにつれて、2030年代初頭に商業展開が予想されます。この黎明期は、熾烈な資本展開、電力会社と技術プロバイダー間の戦略的パートナーシップ、超電導磁石メーカー、プラズマ診断装置サプライヤー、システムインテグレーターにまたがる進化するバリューチェーンによって特徴づけられます。
需要- 促進要因と抑制要因
世界の核融合エネルギー市場の需要促進要因は以下の通りです:
- AI/ML駆動プラズマ制御と最適化
- クリーンで持続可能なエネルギー源に対する需要の高まり
世界の核融合エネルギー市場は、以下の課題のためにいくつかの限界にも直面すると予想される:
- 核融合エネルギー技術の高コストと技術的複雑性
- 規制と社会的受容
核融合エネルギー市場の主要参入企業情勢と競合情勢
核融合エネルギー市場は、多国籍研究コンソーシアムと野心的な民間ベンチャーが混在する競合情勢にあります。公的な面では、EU、米国、中国、インド、日本、韓国、ロシアが支援するITER共同研究がトカマク・プロジェクトの旗手として機能する一方、米国エネルギー省のプリンストン・プラズマ物理学研究所や欧州のEUROfusionプログラムなどの国立研究所がステラレータや代替閉じ込めの概念を推進しています。民間セクターでは、Commonwealth Fusion Systemsがコンパクトなトカマクに高温超伝導マグネットを利用し、TAE Technologiesがビーム駆動による磁場反転構成を追求し、General Fusionがピストン駆動圧縮による磁化ターゲット核融合を開発し、Tokamak Energyが迅速に展開可能なHTSコイルを備えた球形トカマクに焦点を当てています。競合は、学術機関や産業サプライヤーとの戦略的パートナーシップ、差別化された技術ロードマップ、ベンチャーキャピタルや政府からの資金提供の増加によってさらに激化しています。
当レポートでは、世界の核融合エネルギー市場について調査し、市場の概要とともに、用途別、技術別、燃料サイクル別、国別の動向、および市場に参入する企業のプロファイルなどを提供しています。
目次
エグゼクティブサマリー
第1章 市場:業界展望
- 動向:現状と将来への影響評価
- 市場力学の概要
- 市場促進要因
- 市場抑制要因
- 市場機会
- 規制および政策影響分析
- 特許分析
- スタートアップの情勢
- 投資情勢と研究開発動向
- 将来展望と市場ロードマップ
- バリューチェーン分析
- 世界価格分析
- 業界の魅力
第2章 核融合エネルギー市場(用途別)
- 用途のセグメンテーション
- 用途のサマリー
- 核融合エネルギー市場(用途別)
- 発電
- 研究開発
- 宇宙推進
- 産業用途
第3章 核融合エネルギー市場(製品別)
- 製品のセグメンテーション
- 製品のサマリー
- 核融合エネルギー市場(技術別)
- 磁気閉じ込め核融合
- 慣性閉じ込め核融合
- ステラレーター
- スフェロマック
- 核融合エネルギー市場(燃料サイクル別)
- 重水素三重水素
- 重水素
- 重水素ヘリウム3
- プロトンホウ素
第4章 核融合エネルギー市場(地域別)
- 核融合エネルギー市場(地域別)
- 北米
- 欧州
- アジア太平洋
- その他の地域
第5章 市場-競合ベンチマーキングと企業プロファイル
- 今後の見通し
- 地理的評価
- 企業プロファイル
- General Fusion
- Helion
- NearStar Fusion
- Zap Energy
- TAE Technologies
- Commonwealth Fusion Systems
- Avalanche
- Fusion Energy Solutions of Hawaii
- Longview Fusion Energy Systems
- Serva Energy
- LPP Fusion
- Thea Energy
- First Light
- Marvel Fusion
- Kyoto Fusioneering
- その他の主要企業
第6章 調査手法
List of Figures
- Figure 1: Fusion Energy Market (by Scenario), $Billion, 2025, 2028, and 2034
- Figure 2: Fusion Energy Market (by Region), $Billion, 2024, 2027, and 2034
- Figure 3: Fusion Energy Market (by Application), $Billion, 2024, 2027, and 2034
- Figure 4: Fusion Energy Market (by Product), $Billion, 2024, 2027, and 2034
- Figure 5: Competitive Landscape Snapshot
- Figure 6: Supply Chain Analysis
- Figure 7: Value Chain Analysis
- Figure 8: Patent Analysis (by Country), January 2021-April 2025
- Figure 9: Patent Analysis (by Company), January 2021-April 2025
- Figure 10: Impact Analysis of Market Navigating Factors, 2024-2034
- Figure 11: U.S. Fusion Energy Market, $Billion, 2024-2034
- Figure 12: Canada Fusion Energy Market, $Billion, 2024-2034
- Figure 13: Mexico Fusion Energy Market, $Billion, 2024-2034
- Figure 14: Germany Fusion Energy Market, $Billion, 2024-2034
- Figure 15: France Fusion Energy Market, $Billion, 2024-2034
- Figure 16: Italy Fusion Energy Market, $Billion, 2024-2034
- Figure 17: Spain Fusion Energy Market, $Billion, 2024-2034
- Figure 18: U.K. Fusion Energy Market, $Billion, 2024-2034
- Figure 19: Rest-of-Europe Fusion Energy Market, $Billion, 2024-2034
- Figure 20: China Fusion Energy Market, $Billion, 2024-2034
- Figure 21: Japan Fusion Energy Market, $Billion, 2024-2034
- Figure 22: India Fusion Energy Market, $Billion, 2024-2034
- Figure 23: South Korea Fusion Energy Market, $Billion, 2024-2034
- Figure 24: Rest-of-Asia-Pacific Fusion Energy Market, $Billion, 2024-2034
- Figure 25: South America Fusion Energy Market, $Billion, 2024-2034
- Figure 26: Middle East and Africa Fusion Energy Market, $Billion, 2024-2034
- Figure 27: Strategic Initiatives (by Company), 2021-2025
- Figure 28: Share of Strategic Initiatives, 2021-2025
- Figure 29: Data Triangulation
- Figure 30: Top-Down and Bottom-Up Approach
- Figure 31: Assumptions and Limitations
List of Tables
- Table 1: Market Snapshot
- Table 2: Opportunities across Region
- Table 3: Trends Overview
- Table 4: Fusion Energy Market Pricing Forecast, 2024-2034
- Table 5: Application Summary (by Application)
- Table 6: Product Summary (by Product)
- Table 7: Fusion Energy Market (by Region), $Billion, 2024-2034
- Table 8: North America Fusion Energy Market (by Application), $Billion, 2024-2034
- Table 9: North America Fusion Energy Market (by Product), $Billion, 2024-2034
- Table 10: U.S. Fusion Energy Market (by Application), $Billion, 2024-2034
- Table 11: U.S. Fusion Energy Market (by Product), $Billion, 2024-2034
- Table 12: Canada Fusion Energy Market (by Application), $Billion, 2024-2034
- Table 13: Canada Fusion Energy Market (by Product), $Billion, 2024-2034
- Table 14: Mexico Fusion Energy Market (by Application), $Billion, 2024-2034
- Table 15: Mexico Fusion Energy Market (by Product), $Billion, 2024-2034
- Table 16: Europe Fusion Energy Market (by Application), $Billion, 2024-2034
- Table 17: Europe Fusion Energy Market (by Product), $Billion, 2024-2034
- Table 18: Germany Fusion Energy Market (by Application), $Billion, 2024-2034
- Table 19: Germany Fusion Energy Market (by Product), $Billion, 2024-2034
- Table 20: France Fusion Energy Market (by Application), $Billion, 2024-2034
- Table 21: France Fusion Energy Market (by Product), $Billion, 2024-2034
- Table 22: Italy Fusion Energy Market (by Application), $Billion, 2024-2034
- Table 23: Italy Fusion Energy Market (by Product), $Billion, 2024-2034
- Table 24: Spain Fusion Energy Market (by Application), $Billion, 2024-2034
- Table 25: Spain Fusion Energy Market (by Product), $Billion, 2024-2034
- Table 26: U.K. Fusion Energy Market (by Application), $Billion, 2024-2034
- Table 27: U.K. Fusion Energy Market (by Product), $Billion, 2024-2034
- Table 28: Rest-of-Europe Fusion Energy Market (by Application), $Billion, 2024-2034
- Table 29: Rest-of-Europe Fusion Energy Market (by Product), $Billion, 2024-2034
- Table 30: Asia-Pacific Fusion Energy Market (by Application), $Billion, 2024-2034
- Table 31: Asia-Pacific Fusion Energy Market (by Product), $Billion, 2024-2034
- Table 32: China Fusion Energy Market (by Application), $Billion, 2024-2034
- Table 33: China Fusion Energy Market (by Product), $Billion, 2024-2034
- Table 34: Japan Fusion Energy Market (by Application), $Billion, 2024-2034
- Table 35: Japan Fusion Energy Market (by Product), $Billion, 2024-2034
- Table 36: India Fusion Energy Market (by Application), $Billion, 2024-2034
- Table 37: India Fusion Energy Market (by Product), $Billion, 2024-2034
- Table 38: South Korea Fusion Energy Market (by Application), $Billion, 2024-2034
- Table 39: South Korea Fusion Energy Market (by Product), $Billion, 2024-2034
- Table 40: Rest-of-Asia-Pacific Fusion Energy Market (by Application), $Billion, 2024-2034
- Table 41: Rest-of-Asia-Pacific Fusion Energy Market (by Product), $Billion, 2024-2034
- Table 42: Rest-of-the-World Fusion Energy Market (by Application), $Billion, 2024-2034
- Table 43: Rest-of-the-World Fusion Energy Market (by Product), $Billion, 2024-2034
- Table 44: South America Fusion Energy Market (by Application), $Billion, 2024-2034
- Table 45: South America Fusion Energy Market (by Product), $Billion, 2024-2034
- Table 46: Middle East and Africa Fusion Energy Market (by Application), $Billion, 2024-2034
- Table 47: Middle East and Africa Fusion Energy Market (by Product), $Billion, 2024-2034
- Table 48: Market Share
Global Fusion Energy Market: Industry Overview
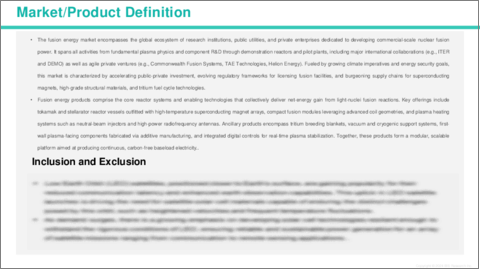
The global fusion energy market is characterized by a dynamic ecosystem of large-scale international collaborations, government-backed research consortia, and a burgeoning cadre of private ventures, all converging on magnetic confinement (tokamaks and stellarators) and inertial confinement approaches. Projects such as ITER and SPARC exemplify multi-billion-dollar efforts to demonstrate net-energy gain, while companies like Commonwealth Fusion Systems, TAE Technologies, and General Fusion are deploying high-temperature superconducting magnets, advanced plasma heating, and proprietary target designs to accelerate prototype timelines. Concurrent advances in AI/ML-driven plasma control, novel refractory materials capable of withstanding extreme neutron fluxes, and modular reactor architectures underscore the sector's commitment to de-risking scale-up and achieving cost-effective, commercially viable fusion power.
Fusion Energy Market Lifecycle Stage
| KEY MARKET STATISTICS | |
|---|---|
| Forecast Period | 2025 - 2034 |
| 2025 Evaluation | $291.42 Billion |
| 2034 Forecast | $445.20 Billion |
| CAGR | 4.82% |
Fusion energy remains in the late R&D and early demonstration phase of its market lifecycle, with most technologies at technology-readiness levels (TRLs) 4-7, translating bench-scale breakthroughs into engineering prototypes. While governments and grid operators prepare regulatory frameworks and licensing pathways, commercial deployment is anticipated in the early 2030s as pilot plants validate continuous operation and tritium fuel cycles. This nascent phase is marked by intense capital deployment, strategic partnerships between utilities and technology providers, and an evolving value chain that spans superconducting magnet manufacturers, plasma diagnostics suppliers, and systems integrators-setting the stage for transition to first-of-a-kind commercial reactors.
Fusion Energy Market Segmentation:
Segmentation 1: by Application
- Power Generation
- Research and Development
- Space Propulsion
- Industrial Applications
Power Generation is one of the prominent application segments in the global fusion energy market.
Segmentation 2: by Technology
- Magnetic Confinement Fusion
- Inertial Confinement Fusion
- Stellarators
- Spheromaks
The global fusion energy market is estimated to be led by the magnetic confinement fusion segment in terms of type.
Segmentation 3: by Fuel Cycle
- Deuterium Tritium
- Deuterium
- Deuterium Helium 3
- Proton Boron
Segmentation 4: by Region
- North America - U.S., Canada, and Mexico
- Europe - Germany, France, Italy, Spain, U.K., and Rest-of-Europe
- Asia-Pacific - China, Japan, South Korea, India, and Rest-of-Asia-Pacific
- Rest-of-the-World - South America and Middle East and Africa
In the fusion energy market, Asia-Pacific is anticipated to gain traction in terms of production, with increasing infrastructure demand and government initiatives.
Demand - Drivers and Limitations
The following are the demand drivers for the global fusion energy market:
- AI/ML-Driven Plasma Control and Optimization
- Growing demand for clean and sustainable energy sources
The global fusion energy market is expected to face some limitations as well due to the following challenges:
- High cost and technical complexity for fusion energy technology
- Regulatory and Public Acceptance
Fusion Energy Market Key Players and Competition Synopsis
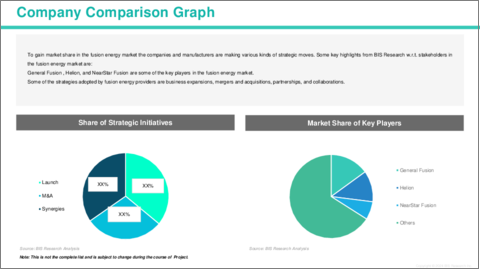
The fusion energy market features a competitive landscape driven by a mix of multinational research consortia and ambitious private ventures. On the public side, the ITER collaboration-backed by the EU, United States, China, India, Japan, Korea and Russia-serves as the flagship tokamak project, while national laboratories such as the U.S. Department of Energy's Princeton Plasma Physics Laboratory and Europe's EUROfusion program advance stellarator and alternative confinement concepts. In the private sector, Commonwealth Fusion Systems harnesses high-temperature superconducting magnets in compact tokamaks, TAE Technologies pursues beam-driven field-reversed configurations, General Fusion develops magnetized target fusion via piston-driven compression, and Tokamak Energy focuses on spherical tokamaks with rapidly deployable HTS coils. Competition is further intensified by strategic partnerships with academic institutions and industrial suppliers, differentiated technology roadmaps, and escalating venture capital and government funding, as each player races to demonstrate net-energy gain and establish a foothold in the emerging commercial fusion industry.
Some prominent names established in the fusion energy market are:
- General Fusion
- Helion
- NearStar Fusion
- Zap Energy
- TAE Technologies
- Commonwealth Fusion Systems
- Avalanche
- Fusion Energy Solutions of Hawaii
- Longview Fusion Energy Systems
- Serva Energy
- LPP Fusion
- Thea Energy
- First Light
- Marvel Fusion
- Kyoto Fusioneering
Companies that are not a part of the previously mentioned pool have been well represented across different sections of the report (wherever applicable).
Table of Contents
Executive Summary
Scope and Definition
Market/Product Definition
Key Questions Answered
Analysis and Forecast Note
1. Markets: Industry Outlook
- 1.1 Trends: Current and Future Impact Assessment
- 1.2 Market Dynamics Overview
- 1.2.1 Market Drivers
- 1.2.2 Market Restraints
- 1.2.3 Market Opportunities
- 1.3 Regulatory & Policy Impact Analysis
- 1.4 Patent Analysis
- 1.5 Start-Up Landscape
- 1.6 Investment Landscape and R&D Trends
- 1.7 Future Outlook and Market Roadmap
- 1.8 Value Chain Analysis
- 1.9 Global Pricing Analysis
- 1.10 Industry Attractiveness
2. Fusion Energy Market (by Application)
- 2.1 Application Segmentation
- 2.2 Application Summary
- 2.3 Fusion Energy Market (by Application)
- 2.3.1 Power Generation
- 2.3.2 Research and Development
- 2.3.3 Space Propulsion
- 2.3.4 Industrial Applications
3. Fusion Energy Market (by Product)
- 3.1 Product Segmentation
- 3.2 Product Summary
- 3.3 Fusion Energy Market (by Technology)
- 3.3.1 Magnetic Confinement Fusion
- 3.3.2 Inertial Confinement Fusion
- 3.3.3 Stellarators
- 3.3.4 Spheromaks
- 3.4 Fusion Energy Market (by Fuel Cycle)
- 3.4.1 Deuterium Tritium
- 3.4.2 Deuterium
- 3.4.3 Deuterium Helium 3
- 3.4.4 Proton Boron
4. Fusion Energy Market (by Region)
- 4.1 Fusion Energy Market (by Region)
- 4.2 North America
- 4.2.1 Regional Overview
- 4.2.2 Driving Factors for Market Growth
- 4.2.3 Factors Challenging the Market
- 4.2.4 Application
- 4.2.5 Product
- 4.2.6 North America (by Country)
- 4.2.6.1 U.S.
- 4.2.6.1.1 Market by Application
- 4.2.6.1.2 Market by Product
- 4.2.6.2 Canada
- 4.2.6.2.1 Market by Application
- 4.2.6.2.2 Market by Product
- 4.2.6.3 Mexico
- 4.2.6.3.1 Market by Application
- 4.2.6.3.2 Market by Product
- 4.2.6.1 U.S.
- 4.3 Europe
- 4.3.1 Regional Overview
- 4.3.2 Driving Factors for Market Growth
- 4.3.3 Factors Challenging the Market
- 4.3.4 Application
- 4.3.5 Product
- 4.3.6 Europe (by Country)
- 4.3.6.1 Germany
- 4.3.6.1.1 Market by Application
- 4.3.6.1.2 Market by Product
- 4.3.6.2 France
- 4.3.6.2.1 Market by Application
- 4.3.6.2.2 Market by Product
- 4.3.6.3 Italy
- 4.3.6.3.1 Market by Application
- 4.3.6.3.2 Market by Product
- 4.3.6.4 Spain
- 4.3.7.4.1 Market by Application
- 4.3.7.4.2 Market by Product
- 4.3.6.5 U.K.
- 4.3.6.5.1 Market by Application
- 4.3.6.5.2 Market by Product
- 4.3.6.6 Rest-of-Europe
- 4.3.6.6.1 Market by Application
- 4.3.6.6.2 Market by Product
- 4.3.6.1 Germany
- 4.4 Asia-Pacific
- 4.4.1 Regional Overview
- 4.4.2 Driving Factors for Market Growth
- 4.4.3 Factors Challenging the Market
- 4.4.4 Application
- 4.4.5 Product
- 4.4.6 Asia-Pacific (by Country)
- 4.4.6.1 China
- 4.4.6.1.1 Market by Application
- 4.4.6.1.2 Market by Product
- 4.4.6.2 Japan
- 4.4.6.2.1 Market by Application
- 4.4.6.2.2 Market by Product
- 4.4.6.3 India
- 4.4.6.3.1 Market by Application
- 4.4.6.3.2 Market by Product
- 4.4.6.4 South Korea
- 4.4.6.4.1 Market by Application
- 4.4.6.4.2 Market by Product
- 4.4.6.5 Rest-of-Asia-Pacific
- 4.4.6.5.1 Market by Application
- 4.4.6.5.2 Market by Product
- 4.4.6.1 China
- 4.5 Rest-of-the-World
- 4.5.1 Regional Overview
- 4.5.2 Driving Factors for Market Growth
- 4.5.3 Factors Challenging the Market
- 4.5.4 Application
- 4.5.5 Product
- 4.5.6 Rest-of-the-World (by Region)
- 4.5.6.1 South America
- 4.5.6.1.1 Market by Application
- 4.5.6.1.2 Market by Product
- 4.5.6.2 Middle East and Africa
- 4.5.6.2.1 Market by Application
- 4.5.6.2.2 Market by Product
- 4.5.6.1 South America
5. Markets - Competitive Benchmarking & Company Profiles
- 5.1 Next Frontiers
- 5.2 Geographic Assessment
- 5.3 Company Profiles
- 5.3.1 General Fusion
- 5.3.1.1 Overview
- 5.3.1.2 Top Products/Product Portfolio
- 5.3.1.3 Top Competitors
- 5.3.1.4 Target Customers
- 5.3.1.5 Key Personnel
- 5.3.1.6 Analyst View
- 5.3.1.7 Market Share
- 5.3.2 Helion
- 5.3.2.1 Overview
- 5.3.2.2 Top Products/Product Portfolio
- 5.3.2.3 Top Competitors
- 5.3.2.4 Target Customers
- 5.3.2.5 Key Personnel
- 5.3.2.6 Analyst View
- 5.3.2.7 Market Share
- 5.3.3 NearStar Fusion
- 5.3.3.1 Overview
- 5.3.3.2 Top Products/Product Portfolio
- 5.3.3.3 Top Competitors
- 5.3.3.4 Target Customers
- 5.3.3.5 Key Personnel
- 5.3.3.6 Analyst View
- 5.3.3.7 Market Share
- 5.3.4 Zap Energy
- 5.3.4.1 Overview
- 5.3.4.2 Top Products/Product Portfolio
- 5.3.4.3 Top Competitors
- 5.3.4.4 Target Customers
- 5.3.4.5 Key Personnel
- 5.3.4.6 Analyst View
- 5.3.4.7 Market Share
- 5.3.5 TAE Technologies
- 5.3.5.1 Overview
- 5.3.5.2 Top Products/Product Portfolio
- 5.3.5.3 Top Competitors
- 5.3.5.4 Target Customers
- 5.3.5.5 Key Personnel
- 5.3.5.6 Analyst View
- 5.3.5.7 Market Share
- 5.3.6 Commonwealth Fusion Systems
- 5.3.6.1 Overview
- 5.3.6.2 Top Products/Product Portfolio
- 5.3.6.3 Top Competitors
- 5.3.6.4 Target Customers
- 5.3.6.5 Key Personnel
- 5.3.6.6 Analyst View
- 5.3.6.7 Market Share
- 5.3.7 Avalanche
- 5.3.7.1 Overview
- 5.3.7.2 Top Products/Product Portfolio
- 5.3.7.3 Top Competitors
- 5.3.7.4 Target Customers
- 5.3.7.5 Key Personnel
- 5.3.7.6 Analyst View
- 5.3.7.7 Market Share
- 5.3.8 Fusion Energy Solutions of Hawaii
- 5.3.8.1 Overview
- 5.3.8.2 Top Products/Product Portfolio
- 5.3.8.3 Top Competitors
- 5.3.8.4 Target Customers
- 5.3.8.5 Key Personnel
- 5.3.8.6 Analyst View
- 5.3.8.7 Market Share
- 5.3.9 Longview Fusion Energy Systems
- 5.3.9.1 Overview
- 5.3.9.2 Top Products/Product Portfolio
- 5.3.9.3 Top Competitors
- 5.3.9.4 Target Customers
- 5.3.9.5 Key Personnel
- 5.3.9.6 Analyst View
- 5.3.9.7 Market Share
- 5.3.10 Serva Energy
- 5.3.10.1 Overview
- 5.3.10.2 Top Products/Product Portfolio
- 5.3.10.3 Top Competitors
- 5.3.10.4 Target Customers
- 5.3.10.5 Key Personnel
- 5.3.10.6 Analyst View
- 5.3.10.7 Market Share
- 5.3.10.8 Share
- 5.3.11 LPP Fusion
- 5.3.11.1 Overview
- 5.3.11.2 Top Products/Product Portfolio
- 5.3.11.3 Top Competitors
- 5.3.11.4 Target Customers
- 5.3.11.5 Key Personnel
- 5.3.11.6 Analyst View
- 5.3.11.7 Market Share
- 5.3.11.8 Share
- 5.3.12 Thea Energy
- 5.3.12.1 Overview
- 5.3.12.2 Top Products/Product Portfolio
- 5.3.12.3 Top Competitors
- 5.3.12.4 Target Customers
- 5.3.12.5 Key Personnel
- 5.3.12.6 Analyst View
- 5.3.12.7 Market Share
- 5.3.12.8 Share
- 5.3.13 First Light
- 5.3.13.1 Overview
- 5.3.13.2 Top Products/Product Portfolio
- 5.3.13.3 Top Competitors
- 5.3.13.4 Target Customers
- 5.3.13.5 Key Personnel
- 5.3.13.6 Analyst View
- 5.3.13.7 Market Share
- 5.3.13.8 Share
- 5.3.14 Marvel Fusion
- 5.3.14.1 Overview
- 5.3.14.2 Top Products/Product Portfolio
- 5.3.14.3 Top Competitors
- 5.3.14.4 Target Customers
- 5.3.14.5 Key Personnel
- 5.3.14.6 Analyst View
- 5.3.14.7 Market Share
- 5.3.14.8 Share
- 5.3.15 Kyoto Fusioneering
- 5.3.15.1 Overview
- 5.3.15.2 Top Products/Product Portfolio
- 5.3.15.3 Top Competitors
- 5.3.15.4 Target Customers
- 5.3.15.5 Key Personnel
- 5.3.15.6 Analyst View
- 5.3.15.7 Market Share
- 5.3.15.8 Share
- 5.3.1 General Fusion
- 5.4 Other Key Companies
