|
|
市場調査レポート
商品コード
1661293
油田用化学品の世界市場:用途・基油・地域・国別の分析・予測 (2024-2034年)Oil Field Chemicals Market - A Global and Regional Analysis: Focus on Application, Base Oil, and Country-Level Analysis - Analysis and Forecast, 2024-2034 |
||||||

|
|||||||
カスタマイズ可能
|
|||||||

| 油田用化学品の世界市場:用途・基油・地域・国別の分析・予測 (2024-2034年) |
|
出版日: 2025年02月25日
発行: BIS Research
ページ情報: 英文 136 Pages
納期: 1~5営業日
|

全表示
- 概要
- 図表
- 目次
油田用化学品の市場は複数の重要な要因によって大きな成長を遂げています。
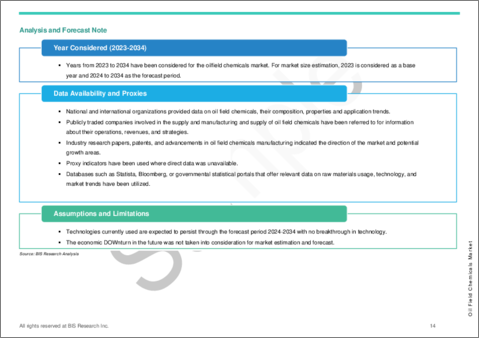
現実的なシナリオでは、油田化学品の市場規模は、2024年の314億790万米ドルから、予測期間中にCAGR 5.24%で推移し、2034年には523億3,000万米ドルの規模に達すると予測されています。
この成長の主な原動力は、掘削、生産、石油増進回収 (EOR) 用途における高性能で持続可能な化学配合物に対する需要の増加です。世界のエネルギー需要の高まりと石油探査活動の激化に伴い、オペレーターは坑井の性能を高め、抽出プロセスを最適化し、環境コンプライアンスを確保するために、先進的な油田用化学品を必要としています。
さらに、厳しい環境規制と持続可能性への取り組みが、環境に優しい油田用化学品と環境に優しい生産プロセスの採用を推進し、世界のESGコミットメントに沿いながら生態系への影響を低減しています。スマート化学製剤、ナノテクノロジー、生分解性添加剤などの技術の進歩は、作業効率と生産の持続可能性をさらに最適化しています。AI主導のモニタリングシステムとリアルタイムの化学品管理ソリューションを統合することで、費用対効果と拡張性が向上し、先進的な油田用化学品が業界にとってより魅力的なものとなっています。
| 主要市場統計 | |
|---|---|
| 予測期間 | 2024-2034年 |
| 2024年評価 | 314億米ドル |
| 2034年予測 | 523億3,000万米ドル |
| CAGR | 5.24% |
さらに、地域の生産拠点の急速な開発や、世界の油田化学メーカーと地域の油田化学メーカーとの戦略的提携も、油田化学品市場の拡大を加速させています。これらの進歩は、サプライチェーンの弾力性を高め、規制遵守をサポートし、環境スチュワードシップを確保しながら需要の増加に対応する業界の能力を強化しています。
用途別では、セメンチング・刺激の部門が市場をリード:
セメンチング・刺激の部門は、掘削活動の増加、石油増進回収 (EOR) 技術、良好な完全性と貯留層の最適化に対する需要の高まりにより、油田用化学品市場をリードすると予想されています。セメンチング用化学品は、坑井の安定性を確保し、ガス移行を防止し、長期的に良好な性能を発揮するために不可欠な帯状隔離を強化する上で重要な役割を果たします。一方、破砕液や酸性化溶液を含む刺激用化学品は、貯留層の浸透性を改善し、炭化水素の回収を最大化するために不可欠です。
製品別では、摩擦低減剤の部門が市場をリード:
摩擦低減剤は、水圧破砕や坑井刺激作業中の流体流動効率を高める上で重要な役割を果たすことから、油田用化学品市場をリードすると予想されています。これらの化学品は、摩擦による圧力損失を最小限に抑え、流体のスムーズな移動を可能にし、エネルギー消費を削減し、全体的な性能を向上させます。
特に北米全域のシェールガス探査において水圧破砕の採用が増加していることが、高性能摩擦低減剤の需要を大幅に押し上げています。さらに、水性および生分解性配合物の進歩は、作業効率を高めながら環境問題にも対処しています。
地域別では、北米地域が市場をリード:
北米は、堅調な石油・ガス産業、進行中のシェールガス探査、掘削・生産技術の継続的な進歩に牽引され、市場を独占すると予想されています。大手油田化学メーカーの存在と研究開発への多額の投資もこの地域の競争力を強化しています。さらに、厳しい環境規制と持続可能な油田操業への関心の高まりが、先進的化学ソリューションの採用を加速させています。
当レポートでは、世界の油田用化学品の市場を調査し、主要動向、市場影響因子の分析、法規制環境、技術開発・特許の動向、ケーススタディ、市場規模の推移・予測、各種区分・地域/主要国別の詳細分析、競合情勢、主要企業のプロファイルなどをまとめています。
目次
エグゼクティブサマリー
範囲と定義
第1章 市場:業界の展望
- 深海とフロンティア探査へのシフト
- 上流ポートフォリオにおけるM&A活動の増加
- 貯留層最適化のためのデジタル技術の導入拡大
- 探査と生産における持続可能性とESGの重要性の高まり
- サプライチェーンの概要
- バリューチェーン分析
- 価格分析
- 規制状況
- 研究開発レビュー
- 特許出願動向 (国・企業別)
- ステークホルダー分析
- 使用事例
- 市場力学:概要
- 市場促進要因
- 市場抑制要因
- 市場機会
第2章 用途
- 用途のセグメンテーション
- 用途の概要
- 油田化学品市場 (用途別)
- セメンチング・刺激
- 石油生産用化学品
- 掘削液
第3章 製品
- 製品セグメンテーション
- 製品概要
- 油田化学品市場 (基油別)
- 阻害剤
- 乳化破壊剤
- レオロジー改質剤
- 摩擦低減装置
- 殺生物剤
- 界面活性剤
- 発泡剤
- ポリマー
- その他
第4章 地域
- 地域別概要
- 北米
- 欧州
- アジア太平洋
- その他の地域
- 地域概要
- 市場成長の原動力
- 市場課題
- 主要企業
- 用途
- 製品
- 国別
第5章 市場:競合ベンチマーキング・企業プロファイル
- 次なるフロンティア
- 地理的評価
- 企業プロファイル
- BASF
- DOW
- Clariant
- Solvay
- Ecolab
- Chevron Phillips Chemical Company LLC
- Croda International Plc
- SLB
- Baker Hughes Company
- Kemira
- Huntsman International LLC.
- Hextar Kimia Sdn Bhd.
第6章 調査手法
List of Figures
- Figure 1: Oil Field Chemicals Market (by Scenario), $Million, 2023, 2027, and 2034
- Figure 2: Oilfield Chemicals Market (by Region), $Million, 2023, 2027, and 2034
- Figure 3: Oilfield Chemicals Market (by Application), $Million, 2023, 2027, and 2034
- Figure 4: Oil Field Chemicals Market (by Product), $Million, 2023, 2027, and 2034
- Figure 5: Key Events
- Figure 6: Supply Chain and Risks within the Supply Chain
- Figure 7: Value Chain Analysis
- Figure 8: Pricing Analysis for Oil Field Chemicals Market (in metric ton/$)
- Figure 9: Patent Analysis (by Country), January 2021-February 2025
- Figure 10: Patent Analysis (by Company), January 2021-February 2025
- Figure 11: Impact Analysis of Market Navigating Factors, 2024-2034
- Figure 12: U.S. Oil Field Chemicals Market, $Million, 2023-2034
- Figure 13: Canada Oil Field Chemicals Market, $Million, 2023-2034
- Figure 14: Mexico Oil Field Chemicals Market, $Million, 2023-2034
- Figure 15: Norway Oil Field Chemicals Market, $Million, 2023-2034
- Figure 16: Germany Oil Field Chemicals Market, $Million, 2023-2034
- Figure 17: France Oil Field Chemicals Market, $Million, 2023-2034
- Figure 18: U.K. Oil Field Chemicals Market, $Million, 2023-2034
- Figure 19: Russia Oil Field Chemicals Market, $Million, 2023-2034
- Figure 20: Italy Oil Field Chemicals Market, $Million, 2023-2034
- Figure 21: Rest-of-Europe Oil Field Chemicals Market, $Million, 2023-2034
- Figure 22: China Oil Field Chemicals Market, $Million, 2023-2034
- Figure 23: Japan Oil Field Chemicals Market, $Million, 2023-2034
- Figure 24: India Oil Field Chemicals Market, $Million, 2023-2034
- Figure 25: South Korea Oil Field Chemicals Market, $Million, 2023-2034
- Figure 26: Indonesia Oil Field Chemicals Market, $Million, 2023-2034
- Figure 27: Malaysia Oil Field Chemicals Market, $Million, 2023-2034
- Figure 28: Thailand Oil Field Chemicals Market, $Million, 2023-2034
- Figure 29: Rest-of-Asia-Pacific Oil Field Chemicals Market, $Million, 2023-2034
- Figure 30: Brazil Oil Field Chemicals Market, $Million, 2023-2034
- Figure 31: Saudi Arabia Oil Field Chemicals Market, $Million, 2023-2034
- Figure 32: Iran Oil Field Chemicals Market, $Million, 2023-2034
- Figure 33: U.A.E. Oil Field Chemicals Market, $Million, 2023-2034
- Figure 34: Nigeria Oil Field Chemicals Market, $Million, 2023-2034
- Figure 35: Algeria Oil Field Chemicals Market, $Million, 2023-2034
- Figure 36: Others Oil Field Chemicals Market, $Million, 2023-2034
- Figure 37: Data Triangulation
- Figure 38: Top-Down and Bottom-Up Approach
- Figure 39: Assumptions and Limitations
List of Tables
- Table 1: Market Snapshot
- Table 2: Opportunities across Region
- Table 3: Competitive Landscape Snapshot
- Table 4: Global Trends in the Oil Field Chemicals Market
- Table 5: List of Regulations for the Oil Field Chemicals Market
- Table 6: Oil Field Chemicals Market (by Region), $Million, 2023-2034
- Table 7: North America Oil Field Chemicals Market (by Application), $Million, 2023-2034
- Table 8: North America Oil Field Chemicals Market (by Base Oil), $Million, 2023-2034
- Table 9: U.S. Oil Field Chemicals Market (by Application), $Million, 2023-2034
- Table 10: U.S. Oil Field Chemicals Market (by Base Oil), $Million, 2023-2034
- Table 11: Canada Oil Field Chemicals Market (by Application), $Million, 2023-2034
- Table 12: Canada Oil Field Chemicals Market (by Base Oil), $Million, 2023-2034
- Table 13: Mexico Oil Field Chemicals Market (by Application), $Million, 2023-2034
- Table 14: Mexico Oil Field Chemicals Market (by Base Oil), $Million, 2023-2034
- Table 15: Europe Oil Field Chemicals Market (by Application), $Million, 2023-2034
- Table 16: Europe Oil Field Chemicals Market (by Base Oil), $Million, 2023-2034
- Table 17: Norway Oil Field Chemicals Market (by Application), $Million, 2023-2034
- Table 18: Norway Oil Field Chemicals Market (by Base Oil), $Million, 2023-2034
- Table 19: Germany Oil Field Chemicals Market (by Application), $Million, 2023-2034
- Table 20: Germany Oil Field Chemicals Market (by Base Oil), $Million, 2023-2034
- Table 21: France Oil Field Chemicals Market (by Application), $Million, 2023-2034
- Table 22: France Oil Field Chemicals Market (by Base Oil), $Million, 2023-2034
- Table 23: U.K. Oil Field Chemicals Market (by Application), $Million, 2023-2034
- Table 24: U.K. Oil Field Chemicals Market (by Base Oil), $Million, 2023-2034
- Table 25: Russia Oil Field Chemicals Market (by Application), $Million, 2023-2034
- Table 26: Russia Oil Field Chemicals Market (by Base Oil), $Million, 2023-2034
- Table 27: Italy Oil Field Chemicals Market (by Application), $Million, 2023-2034
- Table 28: Italy Oil Field Chemicals Market (by Base Oil), $Million, 2023-2034
- Table 29: Rest-of-Europe Oil Field Chemicals Market (by Application), $Million, 2023-2034
- Table 30: Rest-of-Europe Oil Field Chemicals Market (by Base Oil), $Million, 2023-2034
- Table 31: Asia-Pacific Oil Field Chemicals Market (by Application), $Million, 2023-2034
- Table 32: Asia-Pacific Oil Field Chemicals Market (by Base Oil), $Million, 2023-2034
- Table 33: China Oil Field Chemicals Market (by Application), $Million, 2023-2034
- Table 34: China Oil Field Chemicals Market (by Base Oil), $Million, 2023-2034
- Table 35: Japan Oil Field Chemicals Market (by Application), $Million, 2023-2034
- Table 36: Japan Oil Field Chemicals Market (by Base Oil), $Million, 2023-2034
- Table 37: India Oil Field Chemicals Market (by Application), $Million, 2023-2034
- Table 38: India Oil Field Chemicals Market (by Base Oil), $Million, 2023-2034
- Table 39: South Korea Oil Field Chemicals Market (by Application), $Million, 2023-2034
- Table 40: South Korea Oil Field Chemicals Market (by Base Oil), $Million, 2023-2034
- Table 41: Indonesia Oil Field Chemicals Market (by Application), $Million, 2023-2034
- Table 42: Indonesia Oil Field Chemicals Market (by Base Oil), $Million, 2023-2034
- Table 43: Malaysia Oil Field Chemicals Market (by Application), $Million, 2023-2034
- Table 44: Malaysia Oil Field Chemicals Market (by Base Oil), $Million, 2023-2034
- Table 45: Thailand Oil Field Chemicals Market (by Application), $Million, 2023-2034
- Table 46: Thailand Oil Field Chemicals Market (by Base Oil), $Million, 2023-2034
- Table 47: Rest-of-Asia-Pacific Oil Field Chemicals Market (by Application), $Million, 2023-2034
- Table 48: Rest-of-Asia-Pacific Oil Field Chemicals Market (by Base Oil), $Million, 2023-2034
- Table 49: Rest-of-the-World Oil Field Chemicals Market (by Application), $Million, 2023-2034
- Table 50: Rest-of-the-World Oil Field Chemicals Market (by Base Oil), $Million, 2023-2034
- Table 51: Brazil Oil Field Chemicals Market (by Application), $Million, 2023-2034
- Table 52: Brazil Oil Field Chemicals Market (by Base Oil), $Million, 2023-2034
- Table 53: Saudi Arabia Oil Field Chemicals Market (by Application), $Million, 2023-2034
- Table 54: Saudi Arabia Oil Field Chemicals Market (by Base Oil), $Million, 2023-2034
- Table 55: Iran Oil Field Chemicals Market (by Application), $Million, 2023-2034
- Table 56: Iran Oil Field Chemicals Market (by Base Oil), $Million, 2023-2034
- Table 57: U.A.E. Oil Field Chemicals Market (by Application), $Million, 2023-2034
- Table 58: U.A.E. Oil Field Chemicals Market (by Base Oil), $Million, 2023-2034
- Table 59: Nigeria Oil Field Chemicals Market (by Application), $Million, 2023-2034
- Table 60: Nigeria Oil Field Chemicals Market (by Base Oil), $Million, 2023-2034
- Table 61: Algeria Oil Field Chemicals Market (by Application), $Million, 2023-2034
- Table 62: Algeria Oil Field Chemicals Market (by Base Oil), $Million, 2023-2034
- Table 63: Others Oil Field Chemicals Market (by Application), $Million, 2023-2034
- Table 64: Others Oil Field Chemicals Market (by Base Oil), $Million, 2023-2034
- Table 65: Market Share, 2023
Introduction to the Oil Field Chemicals Market
The oil field chemicals market has been experiencing significant growth, driven by multiple key factors. In a realistic scenario, the oil field chemicals market was valued at $31,407.9 million in 2024 and is projected to expand at a CAGR of 5.24%, reaching $52,330.0 million by 2034. A primary driver of this growth is the increasing demand for high-performance and sustainable chemical formulations in drilling, production, and enhanced oil recovery (EOR) applications. As global energy demand rises and oil exploration activities intensify, operators require advanced oil field chemicals to enhance well performance, optimize extraction processes, and ensure environmental compliance.
Additionally, stringent environmental regulations and sustainability initiatives drive the adoption of eco-friendly oil field chemicals and green production processes, reducing ecological impact while aligning with global ESG commitments. Technological advancements, including smart chemical formulations, nanotechnology, and biodegradable additives, are further optimizing operational efficiency and production sustainability. Integrating AI-driven monitoring systems and real-time chemical management solutions improves cost-effectiveness and scalability, making advanced oil field chemicals more attractive to the industry.
| KEY MARKET STATISTICS | |
|---|---|
| Forecast Period | 2024 - 2034 |
| 2024 Evaluation | $31.40 Billion |
| 2034 Forecast | $52.33 Billion |
| CAGR | 5.24% |
Furthermore, the rapid development of regional production hubs and strategic collaborations between global and local oil field chemical manufacturers are accelerating oil field chemicals market expansion. These advancements enhance supply chain resilience, support regulatory compliance, and strengthen the industry's ability to meet growing demand while ensuring environmental stewardship.
Oil Field Chemicals Market Segmentation:
Segmentation 1: Oil Field Chemicals Market (by Application)
- Cementing and Stimulation
- Fracturing
- Cementing and Acidizing
- Oil production Chemical
- Drilling Fluids
Cementing and Stimulation Application to Lead the Oil Field Chemicals Market (by Application)
The cementing and stimulation segment is expected to lead the oil field chemicals market, driven by increasing drilling activities, enhanced oil recovery (EOR) techniques, and the growing demand for good integrity and reservoir optimization. Cementing chemicals play a critical role in ensuring wellbore stability, preventing gas migration, and enhancing zonal isolation, which is essential for long-term good performance. Meanwhile, stimulation chemicals, including fracturing fluids and acidizing solutions, are vital for improving reservoir permeability and maximizing hydrocarbon recovery.
With the rising adoption of hydraulic fracturing, particularly in North America's shale plays, and the increasing focus on deepwater and ultra-deepwater exploration, demand for advanced cementing and stimulation chemicals continues to grow. Additionally, innovations in eco-friendly and high-performance formulations are further strengthening the oil field chemicals market, ensuring regulatory compliance and operational efficiency. As oil and gas companies seek to optimize production and extend well life, the cementing and stimulation application segment is expected to maintain its dominant position in the oil field chemicals market.
Segmentation 2: Oil Field Chemicals Market (by Product)
- Inhibitors
- Demulsifiers
- Rheology Modifiers
- Friction Reducers
- Biocides
- Surfactants
- Foamers
- Polymers
- Others
Friction Reducers to Lead the Oil Field Chemicals Market (by Product)
Friction reducers are expected to lead the oil field chemicals market, driven by their critical role in enhancing fluid flow efficiency during hydraulic fracturing and well-stimulation operations. These chemicals minimize frictional pressure losses, enabling smoother fluid movement, reducing energy consumption, and improving overall performance.
The increasing adoption of hydraulic fracturing, particularly in shale gas exploration across North America, is significantly boosting the demand for high-performance friction reducers. Additionally, advancements in water-based and biodegradable formulations are addressing environmental concerns while enhancing operational efficiency.
Segmentation 3: Oil Field Chemicals Market (by Region)
- North America
- Europe
- Asia-Pacific
- Rest-of-the-World
North America Region to Lead the Oil Field Chemicals Market (by Region)
North America is expected to dominate the oil field chemicals market, driven by the region's robust oil and gas industry, ongoing shale gas exploration, and continuous advancements in drilling and production technologies. The presence of leading oil field chemical manufacturers, coupled with substantial investments in research and development, strengthens the region's competitive position. Furthermore, stringent environmental regulations and an increasing focus on sustainable oil field operations are accelerating the adoption of advanced chemical solutions. With rising drilling activities, particularly in the U.S. and Canada, North America remains a key hub for innovation and expansion of the oil field chemicals market.
Industrial Trends for the Oil Field Chemicals Market
Shift Toward Deepwater and Frontier Exploration
- The oil field chemicals market has been experiencing a notable shift toward deepwater and frontier exploration, driven by the depletion of conventional reserves and the increasing global energy demand. This trend is fueling investments in advanced drilling technologies and specialized chemical solutions designed to enhance oil recovery, ensure well integrity, and withstand extreme environmental conditions. Deepwater operations necessitate the use of high-performance corrosion inhibitors, demulsifiers, and drilling fluids to maintain operational efficiency under high-pressure and high-temperature environments. With major oil and gas players expanding their offshore exploration activities, the demand for tailored oil field chemicals is expected to rise, further reinforcing their role in optimizing production and ensuring operational safety.
- For instance, leading oil companies are increasingly focusing on deepwater exploration, with nearly 70% of their acreage holdings now concentrated in deepwater regions and a similar proportion of their exploration budgets allocated to these projects. Frontier deepwater basins, i.e., areas with no prior production, are delivering exceptionally large discoveries, with an average yield exceeding 80 million barrels of oil equivalent per well, which is over seven times higher than that of wells in mature basins. Additionally, deepwater projects typically exhibit lower carbon intensity per barrel compared to onshore operations, aligning with environmental, social, and governance (ESG) objectives. Consequently, capital investment in new deepwater developments is accelerating, with offshore spending projected to reach a 12-year high by 2025.
Industrial Driver for the Oil Field Chemicals Market
Rising Upstream Exploration and Production Activities and Demand for Enhanced Oil Recovery Techniques
- The oil field chemicals market is expanding due to increasing upstream exploration and production (E&P) activities and the rising demand for enhanced oil recovery (EOR) techniques. As global energy demand continues to grow, operators are intensifying deepwater, ultra-deepwater, and unconventional resource exploration, necessitating the use of advanced drilling fluids, stimulation chemicals, and corrosion inhibitors to optimize well performance and ensure operational efficiency.
- Additionally, mature oil fields are experiencing declining production rates, driving the adoption of EOR techniques such as polymer flooding, surfactant injection, and gas injection to maximize hydrocarbon recovery. These techniques enhance reservoir sweep efficiency and increase extraction yields, making them critical for sustaining long-term oil production.
- As a result, rising investments in E&P activities and the increasing implementation of EOR strategies are fueling the demand for specialized oil field chemicals, reinforcing their role in optimizing reservoir performance, production efficiency, and overall well longevity.
Industrial Restraint for the Oil Field Chemicals Market
Price Volatility of Raw Materials and Supply Chain Disruptions
- The oil field chemicals market is highly susceptible to raw material price fluctuations and supply chain disruptions, which can impact profit margins and constrain oil field chemicals market growth. Many oil field chemicals are derived from base petrochemicals (such as ethylene glycol, methanol, and acrylamide) or other key commodities (such as guar gum from agriculture or mined minerals such as barite). Fluctuations in the prices of these raw materials directly influence the cost of oil field chemical products, making the market vulnerable to external economic factors.
- For instance, the sharp rise in crude oil prices during 2021-2022 led to increased costs for petrochemical feedstocks, subsequently driving up prices for oil field chemicals. In 2022, numerous suppliers identified raw material costs as their biggest challenge, with industry executives highlighting how rising input prices eroded profitability and increased operational costs.
- A notable supply chain disruption occurred in 2021, when shortages of specialty additives, such as friction reducers, which are essential for hydraulic fracturing, emerged due to manufacturing plant outages and global logistics delays. As a result, spot prices surged, and in some cases, suppliers were forced to implement rationing measures to manage limited inventories.
Industrial Opportunity for the Oil Field Chemicals Market
Growth in Sustainable, Eco-Friendly Chemical Solutions
- The increasing demand for sustainable and environment-friendly chemical alternatives is one of the most promising opportunities in the oil field chemicals market. With rising regulatory scrutiny and stakeholder pressure to minimize environmental impact, oil and gas operators are actively seeking high-performance chemical solutions that reduce ecological footprints without compromising efficiency. This shift is transforming sustainable oil field chemicals from a niche segment to a mainstream industry priority. As a result, companies investing in developing and commercializing ""green"" oil field chemicals are well-positioned to gain a competitive edge and meet the sector's evolving needs.
- For instance, there is growing interest in biodegradable fracturing fluid systems, which incorporate plant-based polymers and enzymes as sustainable alternatives to conventional guar-based and biocide-laden formulations. Several oil field service companies have already conducted pilot projects utilizing food-grade additives, demonstrating improved flow-back water treatment efficiency and greater environmental sustainability. If these eco-friendly formulations prove effective on a larger scale, they are likely to witness widespread adoption, particularly in regions with strict water disposal regulations.
Key Players of the Oil Field Chemicals Market
- BASF
- DOW
- Clariant
- Solvay
- Ecolab
- Chevron Phillips Chemical Company LLC
- Croda International Plc
- SLB
- Bakers Hughes Company
- Kemira
- Huntsman International LLC.
- Hextar Kimia Sdn Bhd.
Table of Contents
Executive Summary
Scope and Definition
1 Market: Industry Outlook
- 1.1 Shift Toward Deepwater and Frontier Exploration
- 1.2 Rising Merger and Acquisition Activity in Upstream Portfolios
- 1.3 Increased Deployment of Digital Technologies for Reservoir Optimization
- 1.4 Growing Emphasis on Sustainability and ESG In Exploration and Production
- 1.5 Supply Chain Overview
- 1.5.1 Value Chain Analysis
- 1.5.2 Pricing Analysis
- 1.6 Regulatory Landscape
- 1.7 Research and Development Review
- 1.7.1 Patent Filing Trend (by Country and Company)
- 1.8 Stakeholder Analysis
- 1.8.1 Use Case
- 1.9 Market Dynamics: Overview
- 1.9.1 Market Drivers
- 1.9.1.1 Rising Upstream Exploration and Production Activities and Demand for Enhanced Oil Recovery Techniques
- 1.9.1.2 Technological Advancements in Chemical Formulations
- 1.9.1.3 Regulatory Incentives for Environment-Friendly Chemicals
- 1.9.2 Market Restraints
- 1.9.2.1 Price Volatility of Raw Materials and Supply Chain Disruptions
- 1.9.2.2 Strict Regulatory and Environmental Compliance Requirements
- 1.9.3 Market Opportunities
- 1.9.3.1 Growth in Sustainable, Eco-Friendly Chemical Solutions
- 1.9.3.2 Expansion in Unconventional Oil and Gas Developments
- 1.9.3.3 Strategic partnerships for R&D and market expansion
- 1.9.1 Market Drivers
2 Application
- 2.1 Application Segmentation
- 2.2 Application Summary
- 2.3 Oil Field Chemicals Market (by Application)
- 2.3.1 Cementing and stimulation
- 2.3.1.1 Fracturing
- 2.3.1.2 Cementing and Acidizing
- 2.3.2 Oil production chemicals
- 2.3.3 Drilling fluids
- 2.3.1 Cementing and stimulation
3 Products
- 3.1 Product Segmentation
- 3.2 Product Summary
- 3.3 Oil Field Chemicals Market (by Base Oil)
- 3.3.1 Inhibitors
- 3.3.2 Demulsifiers
- 3.3.3 Rheology Modifiers
- 3.3.4 Friction Reducers
- 3.3.5 Biocides
- 3.3.6 Surfactants
- 3.3.7 Foamers
- 3.3.8 Polymers
- 3.3.9 Others
4 Regions
- 4.1 Regional Summary
- 4.2 North America
- 4.2.1 Regional Overview
- 4.2.2 Driving Factors for Market Growth
- 4.2.3 Factors Challenging the Market
- 4.2.4 Key Companies
- 4.2.5 Application
- 4.2.6 Product
- 4.2.7 North America (by Country)
- 4.2.7.1 U.S.
- 4.2.7.1.1 Application
- 4.2.7.1.2 Product
- 4.2.7.2 Canada
- 4.2.7.2.1 Application
- 4.2.7.2.2 Product
- 4.2.7.3 Mexico
- 4.2.7.3.1 Application
- 4.2.7.3.2 Product
- 4.2.7.1 U.S.
- 4.3 Europe
- 4.3.1 Regional Overview
- 4.3.2 Driving Factors for Market Growth
- 4.3.3 Factors Challenging the Market
- 4.3.4 Key Companies
- 4.3.5 Application
- 4.3.6 Product
- 4.3.7 Europe (by Country)
- 4.3.7.1 Norway
- 4.3.7.1.1 Application
- 4.3.7.1.2 Product
- 4.3.7.2 Germany
- 4.3.7.2.1 Application
- 4.3.7.2.2 Product
- 4.3.7.3 France
- 4.3.7.3.1 Application
- 4.3.7.3.2 Product
- 4.3.7.4 U.K.
- 4.3.7.4.1 Application
- 4.3.7.4.2 Product
- 4.3.7.5 Russia
- 4.3.7.5.1 Application
- 4.3.7.5.2 Product
- 4.3.7.6 Italy
- 4.3.7.6.1 Application
- 4.3.7.6.2 Product
- 4.3.7.7 Rest-of-Europe
- 4.3.7.7.1 Application
- 4.3.7.7.2 Product
- 4.3.7.1 Norway
- 4.4 Asia-Pacific
- 4.4.1 Regional Overview
- 4.4.2 Driving Factors for Market Growth
- 4.4.3 Factors Challenging the Market
- 4.4.4 Key Companies
- 4.4.5 Application
- 4.4.6 Product
- 4.4.7 Asia-Pacific (by Country)
- 4.4.7.1 China
- 4.4.7.1.1 Application
- 4.4.7.1.2 Product
- 4.4.7.2 Japan
- 4.4.7.2.1 Application
- 4.4.7.2.2 Product
- 4.4.7.3 India
- 4.4.7.3.1 Application
- 4.4.7.3.2 Product
- 4.4.7.4 South Korea
- 4.4.7.4.1 Application
- 4.4.7.4.2 Product
- 4.4.7.5 Indonesia
- 4.4.7.5.1 Application
- 4.4.7.5.2 Product
- 4.4.7.6 Malaysia
- 4.4.7.6.1 Application
- 4.4.7.6.2 Product
- 4.4.7.7 Thailand
- 4.4.7.7.1 Application
- 4.4.7.7.2 Product
- 4.4.7.8 Rest-of-Asia-Pacific
- 4.4.7.8.1 Application
- 4.4.7.8.2 Product
- 4.4.7.1 China
- 4.5 Rest-of-the-World
- 4.5.1 Regional Overview
- 4.5.2 Driving Factors for Market Growth
- 4.5.3 Factors Challenging the Market
- 4.5.4 Key Companies
- 4.5.5 Application
- 4.5.6 Product
- 4.5.7 Rest-of-the-World (by Country)
- 4.5.7.1 Brazil
- 4.5.7.1.1 Application
- 4.5.7.1.2 Product
- 4.5.7.2 Saudi Arabia
- 4.5.7.2.1 Application
- 4.5.7.2.2 Product
- 4.5.7.3 Iran
- 4.5.7.3.1 Application
- 4.5.7.3.2 Product
- 4.5.7.4 U.A.E.
- 4.5.7.4.1 Application
- 4.5.7.4.2 Product
- 4.5.7.5 Nigeria
- 4.5.7.5.1 Application
- 4.5.7.5.2 Product
- 4.5.7.6 Algeria
- 4.5.7.6.1 Application
- 4.5.7.6.2 Product
- 4.5.7.7 Others
- 4.5.7.7.1 Application
- 4.5.7.7.2 Product
- 4.5.7.1 Brazil
5 Markets - Competitive Benchmarking & Company Profiles
- 5.1 Next Frontiers
- 5.2 Geographic Assessment
- 5.3 Company Profiles
- 5.3.1 BASF
- 5.3.1.1 Overview
- 5.3.1.2 Top Products/Product Portfolio
- 5.3.1.3 Top Competitors
- 5.3.1.4 End-Use Applications
- 5.3.1.5 Key Personnel
- 5.3.1.6 Analyst View
- 5.3.1.7 Market Share, 2023
- 5.3.2 DOW
- 5.3.2.1 Overview
- 5.3.2.2 Top Products/Product Portfolio
- 5.3.2.3 Top Competitors
- 5.3.2.4 End-Use Applications
- 5.3.2.5 Key Personnel
- 5.3.2.6 Analyst View
- 5.3.2.7 Market Share, 2023
- 5.3.3 Clariant
- 5.3.3.1 Overview
- 5.3.3.2 Top Products/Product Portfolio
- 5.3.3.3 Top Competitors
- 5.3.3.4 End-use Applications
- 5.3.3.5 Key Personnel
- 5.3.3.6 Analyst View
- 5.3.3.7 Market Share, 2023
- 5.3.4 Solvay
- 5.3.4.1 Overview
- 5.3.4.2 Top Products/Product Portfolio
- 5.3.4.3 Top Competitors
- 5.3.4.4 End-use Applications
- 5.3.4.5 Key Personnel
- 5.3.4.6 Analyst View
- 5.3.4.7 Market Share, 2023
- 5.3.5 Ecolab
- 5.3.5.1 Overview
- 5.3.5.2 Top Products/Product Portfolio
- 5.3.5.3 Top Competitors
- 5.3.5.4 End-Use Applications
- 5.3.5.5 Key Personnel
- 5.3.5.6 Analyst View
- 5.3.5.7 Market Share, 2023
- 5.3.6 Chevron Phillips Chemical Company LLC
- 5.3.6.1 Overview
- 5.3.6.2 Top Products/Product Portfolio
- 5.3.6.3 Top Competitors
- 5.3.6.4 End-Use Applications
- 5.3.6.5 Key Personnel
- 5.3.6.6 Analyst View
- 5.3.6.7 Market Share, 2023
- 5.3.7 Croda International Plc
- 5.3.7.1 Overview
- 5.3.7.2 Top Products/Product Portfolio
- 5.3.7.3 Top Competitors
- 5.3.7.4 End-use Applications
- 5.3.7.5 Key Personnel
- 5.3.7.6 Analyst View
- 5.3.7.7 Market Share, 2023
- 5.3.8 SLB
- 5.3.8.1 Overview
- 5.3.8.2 Top Products/Product Portfolio
- 5.3.8.3 Top Competitors
- 5.3.8.4 End-use Applications
- 5.3.8.5 Key Personnel
- 5.3.8.6 Analyst View
- 5.3.8.7 Market Share, 2023
- 5.3.9 Baker Hughes Company
- 5.3.9.1 Overview
- 5.3.9.2 Top Products/Product Portfolio
- 5.3.9.3 Top Competitors
- 5.3.9.4 End-use Applications
- 5.3.9.5 Key Personnel
- 5.3.9.6 Market Share, 2023
- 5.3.10 Kemira
- 5.3.10.1 Overview
- 5.3.10.2 Top Products/Product Portfolio
- 5.3.10.3 Top Competitors
- 5.3.10.4 End-use Applications
- 5.3.10.5 Key Personnel
- 5.3.10.6 Analyst View
- 5.3.10.7 Market Share, 2023
- 5.3.11 Huntsman International LLC.
- 5.3.11.1 Overview
- 5.3.11.2 Top Products/Product Portfolio
- 5.3.11.3 Top Competitors
- 5.3.11.4 End-use Application
- 5.3.11.5 Key Personnel
- 5.3.11.6 Analyst View
- 5.3.11.7 Market Share, 2023
- 5.3.12 Hextar Kimia Sdn Bhd.
- 5.3.12.1 Overview
- 5.3.12.2 Top Products/Product Portfolio
- 5.3.12.3 Top Competitors
- 5.3.12.4 End-use Application
- 5.3.12.5 Key Personnel
- 5.3.12.6 Analyst View
- 5.3.12.7 Market Share, 2023
- 5.3.1 BASF
6 Research Methodology
- 6.1 Data Sources
- 6.1.1 Primary Data Sources
- 6.1.2 Secondary Data Sources
- 6.1.3 Data Triangulation
- 6.2 Market Estimation and Forecast
