|
|
市場調査レポート
商品コード
1648556
農業顧客セグメンテーションの世界市場 - 世界と地域の分析:農場規模、農家年齢層、作物タイプ、農場所有の考察(2024年)Agriculture Customer Segmentation Market - A Global and Regional Analysis: Focus on Farm Size, Farmer Age Group, Crop Type, and Farm Ownership - Analysis Period, 2024 |
||||||
|
|||||||
カスタマイズ可能
|
|||||||

| 農業顧客セグメンテーションの世界市場 - 世界と地域の分析:農場規模、農家年齢層、作物タイプ、農場所有の考察(2024年) |
|
出版日: 2025年02月04日
発行: BIS Research
ページ情報: 英文 129 Pages
納期: 1~5営業日
|

全表示
- 概要
- 図表
- 目次
市場のイントロダクション
農業顧客セグメンテーション市場とは、農業顧客を共通の特徴に基づいて特定のグループに分類し、企業が的を絞った製品、サービス、ソリューションを提供できるようにするプロセスとツールを指します。この市場には、農場規模、作物タイプ、地域、農業技術、購買行動などのセグメントを特定するためのソフトウェア、アナリティクス、コンサルティングサービスが含まれます。セグメンテーションを活用することで、農業関連企業はマーケティング戦略を最適化し、製品開発を改良し、顧客エンゲージメントを強化することができます。この市場は、精密農業、持続可能な活動、ニーズに合わせたイノベーションを推進し、最終的に農業関連企業の収益性と経営効率を高める上で極めて重要です。
産業の影響
EUのGreen Dealなどの取り組みにより持続可能な農法の採用が勢いを増すにつれて、農業顧客セグメンテーション市場は産業に大きな影響を与えることになります。持続可能性とリソースの最適化に向けた動きは、的を絞ったソリューションを提供するための正確な顧客プロファイリングに対する需要の高まりを生み出しています。セグメンテーションにより、農業関連企業は、精密農業、IoT、AIベースの技術を採用する農家など、多様な農家グループ向けに製品やサービスをカスタマイズできるようになります。このようなカスタマイズは、リソースの効率的な配分を促進し、製品開発におけるイノベーションを促進します。
セグメンテーションツールやアナリティクスを提供する産業は、特にステークホルダーが気候変動に対応した目標に沿ったデータ主導の戦略を優先することから、投資が増加する可能性が高いです。また、持続可能性目標との整合性を高めるためにセグメンテーション技術を改良しようとする企業が増えていることから、市場の研究開発と提携も成長すると予測されます。こうした発展は、顧客満足度の向上と業務効率の向上、そして世界中でのレジリエントで持続可能な農業エコシステムへの全体的な移行を支援します。
当レポートでは、世界の農業顧客セグメンテーション市場について調査分析し、セグメンテーションの動向、市場力学、新技術に関するデータや、農場規模、農家年齢層、作物タイプ、農場所有に関する考察を提供しています。
目次
エグゼクティブサマリー
調査範囲
第1章 国の分析
- 米国
- 農場規模
- 農業経済
- カナダ
- 農場規模
- 農業経済
- ドイツ
- 農場規模
- 農業経済
- フランス
- 農場規模
- 農業経済
- イタリア
- 農場規模
- 農業経済
- スペイン
- 農場規模
- 農業経済
- ルーマニア
- 農場規模
- 農業経済
- 中国
- 農場規模
- 農業経済
- 日本
- 農場規模
- 農業経済
- オーストラリア
- 農場規模
- 農業経済
- インド
- 農場規模
- 農業経済
- トルコ
- 農場規模
- 農業経済
- ウクライナ
- 農場規模
- 農業経済
第2章 農業顧客セグメンテーション市場:農家年齢層別
- 技術採用パターン:農家年齢層別
- 若年農家(18~30歳)
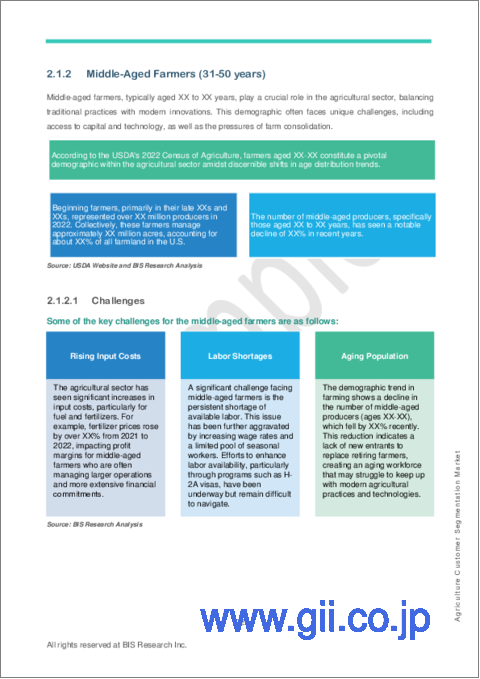
- 中年農家(31~50歳)
- 高齢農家(51歳以上)
- 購買行動と選好に対する年齢の影響
- 年齢に応じた技術の使用に関するケーススタディ
第3章 農業顧客セグメンテーション市場:農場所有別
- 農場所有の種類
- 小規模農場
- 家族経営農場
- 企業農場
- 協同農場
- スマート技術への投資に対する農場所有の影響
第4章 農業顧客セグメンテーション市場:作物タイプ別
- 作物タイプ
- 技術採用:作物タイプ別
- 作物タイプとそのスマート技術の使用に対する影響
- 作物技術の採用における地域差
第5章 結論と提言
- アグリテックスタートアップの拡大
- ターゲットマーケティングと製品開発に対する提言
- 動向
- 有機農業の需要の増加
- 気候変動に強い農法への注目の高まり
- 機会
- 政府の支援と補助金
- 新興経済国の拡大
第6章 調査手法
List of Figures
- Figure 1: Segmentation of Agriculture Customer Segmentation Market
- Figure 2: Farmer's Age Group Impact on Agriculture Customer Segmentation Market
- Figure 3: Farm Ownership Impact on Agriculture Customer Segmentation Market
- Figure 4: Crop Type Impact on Agriculture Customer Segmentation Market
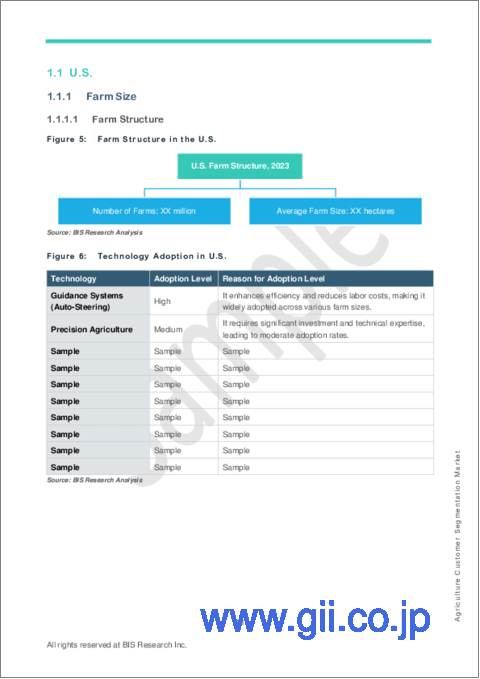
- Figure 5: Farm Structure in the U.S.
- Figure 6: Technology Adoption in U.S.
- Figure 7: Share of Farm Expenditures (in %), by Category, 2023
- Figure 8: Key Highlights of Cost Pattern of U.S. Farms, 2023
- Figure 9: U.S. Total Farm Expenditure, (in $million) 2020-2023
- Figure 10: Per Farm Average Annual Expenditures of Selected States in the U.S., 2023 ($/Farm)
- Figure 11: Barley Production Percentage across U.S. States, 2022
- Figure 12: Corn Production Percentage across U.S. States, 2022
- Figure 13: Oats Production Percentage across U.S. States, 2022
- Figure 14: Soybean Production across U.S. States, 2022
- Figure 15: U.S. Biotic and Abiotic Stress Pattern
- Figure 16: U.S. Labor Availability Metrics
- Figure 17: Farm Structure in Canada
- Figure 18: Technology Adoption in Canada
- Figure 19: Share of Farm Expenditures (by Category), 2023
- Figure 20: Canada Total Farm Expenditure ($ million), 2022-2023
- Figure 21: Barley Production Percentage across Canadian States
- Figure 22: Wheat Production Percentage across Canadian States
- Figure 23: Soybean Production Percentage across Canadian States
- Figure 24: Corn Production Percentage across Canadian States
- Figure 25: Canada Biotic and Abiotic Stress Pattern
- Figure 26: Canada Labor Availability Metrics
- Figure 27: Farm Structure in Germany
- Figure 28: Germany Labor Availability Metrics
- Figure 29: Farm Structure in France
- Figure 30: France Labor Availability Metrics
- Figure 31: Farm Structure
- Figure 32: Farm Structure in Italy
- Figure 33: Percentage of Total Expenses in Italy, 2023
- Figure 34: Italy Labor Availability Metrics
- Figure 35: Farm Structure in Spain
- Figure 36: Percentage of Annual Expenses in Spain, 2022
- Figure 37: Spain Labor Availability Metrics
- Figure 38: Farm Structure in Romania
- Figure 39: Percentage of Annual Expenses in Romania
- Figure 40: Farm Structure in China
- Figure 41: Percentage of Total Expenses in China
- Figure 42: List of Major Crops Grown in China
- Figure 43: China Labor Availability Metrics
- Figure 44: Farm Structure in Japan
- Figure 45: Percentage of Total Expenses in Japan
- Figure 46: List of Major Crops Grown in Japan
- Figure 47: Japan Labor Availability Metrics
- Figure 48: Farm Structure in Australia
- Figure 49: Australia's Average Agriculture Production Cost
- Figure 50: Australia Labor Availability Metrics
- Figure 51: Farm Structure in India
- Figure 52: Percentage Share of Public Expenditure on Agriculture in India
- Figure 53: India Labor Availability Metrics
- Figure 54: Farm Structure in Turkey
- Figure 55: Percentage Share of Expenditure on Agriculture in Turkey
- Figure 56: Turkey Labor Availability Metrics
- Figure 57: Percentage Share of expenditure on agriculture in Ukraine
- Figure 58: Ukraine Labor Availability Metrics
- Figure 59: Empowering the Next Generation: Insights into Young Farmers in Agriculture
- Figure 60: Case Study Highlighting the Contrasting Approaches of Younger and Older Farmers toward Technology Adoption
- Figure 61: Challenges Faced by Smallholder Farms
- Figure 62: Challenges Faced by Family-Owned Farms
- Figure 63: Opportunities for Family-Owned Farms
- Figure 64: Challenges Faced by Corporate Farm
- Figure 65: Opportunities for Corporate Farms
- Figure 66: Opportunities for Corporate Farms
- Figure 67: Impact of Farm Ownership on Investment in Climate-Smart Agricultural Technologies in Ghana
- Figure 68: Global Land Use (by Major Crop Type)
- Figure 69: Growth of Organic Agricultural Land, in Million Hectares, 2018-2022
- Figure 70: Global Distribution of Organic Areas, 2022
- Figure 71: Deviation in Global Surface Temperature, in Degrees Celsius, 2013-2023
- Figure 72: Global Agriculture Customer Segmentation Market: Research Methodology
List of Tables
- Table 1: Country-Wise Analysis of Agriculture Customer Segmentation Market
- Table 2: List of Labor Laws and Regulations
- Table 3: Comprehensive Overview of Policies and Regulations Relevant to Agriculture
- Table 4: List of Labor Laws and Regulations
- Table 5: Comprehensive Overview of Policies and Regulations Relevant to Agriculture
- Table 6: Technology Adoption in Germany
- Table 7: Total Market Size for Tree Nuts, $Million
- Table 8: Total Market Size for Wine, $Million
- Table 9: Germany Biotic and Abiotic Stress Pattern
- Table 10: List of Labor Laws and Regulations
- Table 11: Comprehensive Overview of Policies and Regulations Relevant to Agriculture
- Table 12: Technology Adoption in France
- Table 13: France Biotic and Abiotic Stress Pattern
- Table 14: List of Labor Laws and Regulations
- Table 15: Comprehensive Overview of Policies and Regulations Relevant to Agriculture
- Table 16: Technology Adoption in Italy
- Table 17: List of Main Crops According to the Region
- Table 18: Italy Biotic and Abiotic Stress Pattern
- Table 19: List of Labor Laws and Regulations
- Table 20: Comprehensive Overview of Policies and Regulations Relevant to Agriculture
- Table 21: Technology Adoption in Spain
- Table 22: List of Main Crops According to the Region
- Table 23: Spain Biotic and Abiotic Stress Pattern
- Table 24: List of Labor Laws and Regulations
- Table 25: Comprehensive Overview of Policies and Regulations Relevant to Agriculture
- Table 26: Technology Adoption in Romania
- Table 27: Romania Biotic and Abiotic Stress Factors
- Table 28: List of Labor Laws and Regulations
- Table 29: Comprehensive Overview of Policies and Regulations Relevant to Agriculture
- Table 30: Technology Adoption in China
- Table 31: China Biotic and Abiotic Stress Pattern
- Table 32: List of Labor Laws and Regulations
- Table 33: Comprehensive Overview of Policies and Regulations Relevant to Agriculture
- Table 34: Technology Adoption in Japan
- Table 35: Japan Biotic and Abiotic Stress Pattern
- Table 36: List of Labor Laws and Regulations
- Table 37: Comprehensive Overview of Policies and Regulations Relevant to Agriculture
- Table 38: Technology Adoption in Australia
- Table 39: List of Major Crops Grown in Australia
- Table 40: Australia Biotic and Abiotic Stress Pattern
- Table 41: List of Labor Laws and Regulations
- Table 42: Comprehensive Overview of Policies and Regulations Relevant to Agriculture
- Table 43: Technology Adoption in India
- Table 44: India's Average Agriculture Production Budget
- Table 45: List of Major Crops Grown in India
- Table 46: India Biotic and Abiotic Stress Pattern
- Table 47: List of Labor Laws and Regulations
- Table 48: Comprehensive Overview of Policies and Regulations Relevant to Agriculture
- Table 49: Technology Adoption in Turkey
- Table 50: List of Major Crops Grown in Turkey
- Table 51: Turkey Biotic and Abiotic Stress Pattern
- Table 52: List of Labor Laws and Regulations
- Table 53: Comprehensive Overview of Policies and Regulations Relevant to Agriculture
- Table 54: Farm Structure in Ukraine
- Table 55: Technology Adoption in Ukraine
- Table 56: List of Major Crops Grown in Ukraine
- Table 57: Ukraine Biotic and Abiotic Stress Pattern
- Table 58: Comprehensive Overview of Policies and Regulations Relevant to Agriculture
- Table 59: Illustration of Technology Adoption Patterns by Farmer Age Group
- Table 60: Opportunities for Smallholder Farms
- Table 61: Opportunities for Technology Providers
- Table 62: Regional Variations in Crop Technology Adoption for the Agriculture Customer Segmentation Market
- Table 63: List of Some of the Agri-Tech Start-ups
- Table 64: List of Targeted Customers and Product Types Involved in Smart Agriculture
Introduction to the Agriculture Customer Segmentation
Agriculture Customer Segmentation involves categorizing farmers, agribusinesses, or stakeholders into distinct groups based on shared characteristics to effectively tailor products, services, and marketing strategies. Segmentation criteria may include farm size, crop type, geographical location, farming practices, income levels, and technology adoption rates. By understanding these segments, agribusinesses can better address specific needs, such as precision farming tools for tech-savvy farmers or affordable solutions for smallholders. This approach enhances customer satisfaction, optimizes resource allocation, and drives business growth while fostering sustainable agricultural practices. Effective segmentation supports innovation and builds stronger relationships with diverse agricultural stakeholders.
Market Introduction
The agriculture customer segmentation market refers to the process and tools used to categorize agricultural customers into specific groups based on shared traits, enabling businesses to offer targeted products, services, and solutions. This market includes software, analytics, and consulting services that help identify segments such as farm size, crop type, geographic location, farming techniques, and purchasing behavior. By leveraging segmentation, companies in the agriculture industry can optimize their marketing strategies, improve product development, and enhance customer engagement. This market is critical in driving precision agriculture, sustainable practices, and tailored innovations, ultimately boosting profitability and operational efficiency for agribusinesses.
Industrial Impact
The agriculture customer segmentation market is set for significant industrial impact as the adoption of sustainable agricultural practices, driven by initiatives such as the EU Green Deal, gains momentum. The push toward sustainability and resource optimization creates a heightened demand for precise customer profiling to deliver targeted solutions. Segmentation enables agribusinesses to tailor products and services for diverse farmer groups, such as those adopting precision farming, IoT, or AI-based technologies. This customization fosters the efficient allocation of resources and drives innovation in product development.
Industries offering segmentation tools and analytics are likely to witness increased investment, particularly as stakeholders prioritize data-driven strategies to align with climate-smart goals. Additionally, the market is expected to experience growth in R&D and collaboration as companies seek to refine segmentation techniques for better alignment with sustainability targets. This development supports improved customer satisfaction and operational efficiency and the overall transition to a resilient and sustainable agricultural ecosystem globally.
Countries Considered:
- U.S.
- Canada
- Germany
- France
- Italy
- Spain
- Romania
- China
- Japan
- Australia
- India
- Turkey
Customer Segmentation Parameters
- By Country
- By Farm Size
- By Farm Economics
- By Farmer's Age Group
- Young Farmers
- Middle-Aged Farmers
- Older Farmers
- By Farm Ownership
- Smallholder Farms
- Family-Owned Farms
- Corporate Farms
- Cooperative Farms
- By Crop Type
How can this Report add value to an Organization?
This Report provides actionable insights into the agriculture customer segmentation market, enabling organizations to effectively identify and target specific customer groups. By leveraging data on segmentation trends, market dynamics, and emerging technologies, businesses can tailor their strategies to align with customer needs and sustainability goals. The report helps optimize resource allocation, enhance customer satisfaction, and gain a competitive edge in a rapidly evolving agricultural landscape.
Research Methodology
- The scope of this report focuses on the agricultural customers and their interests at a global level.
- The base currency considered for the market analysis is US$. Currencies other than the US$ have been converted to the US$ for all statistical calculations, considering the average conversion rate for that particular year.
- The currency conversion rate was taken from the historical exchange rate on the FxTop website.
- Nearly all the recent developments from January 2021 to November 2024 have been considered in this research study.
- The information rendered in the report is a result of in-depth primary interviews, surveys, and secondary analysis.
- Where relevant information was not available, proxy indicators and extrapolation were employed.
- Technologies currently used are expected to persist, with no major breakthroughs.
Secondary Research
This research study of the agricultural customer involves extensive secondary research, directories, company websites, and annual reports. It also uses databases, such as ITU, Hoovers, Bloomberg, Businessweek, and Factiva, to collect useful and effective information for an extensive, technical, market-oriented study.
Table of Contents
Executive Summary
Scope of the Study
1 Country Analysis
- 1.1 U.S.
- 1.1.1 Farm Size
- 1.1.1.1 Farm Structure
- 1.1.2 Farm Economics
- 1.1.2.1 Cost Model
- 1.1.2.2 Crop Pattern
- 1.1.2.3 Stress Pattern
- 1.1.2.4 Labor Availability and Awareness
- 1.1.2.5 Government Policies and Regulations
- 1.1.1 Farm Size
- 1.2 Canada
- 1.2.1 Farm Size
- 1.2.1.1 Farm Structure
- 1.2.2 Farm Economics
- 1.2.2.1 Cost Model
- 1.2.2.2 Crop Pattern
- 1.2.2.3 Stress Pattern
- 1.2.2.4 Labor Availability and Awareness
- 1.2.2.5 Government Policies and Regulations
- 1.2.1 Farm Size
- 1.3 Germany
- 1.3.1 Farm Size
- 1.3.1.1 Farm Structure
- 1.3.2 Farm Economics
- 1.3.2.1 Cost Model
- 1.3.2.2 Crop Pattern
- 1.3.2.3 Stress Pattern
- 1.3.2.4 Labor Availability and Awareness
- 1.3.2.5 Government Policies and Regulations
- 1.3.1 Farm Size
- 1.4 France
- 1.4.1 Farm Size
- 1.4.1.1 Farm Structure
- 1.4.2 Farm Economics
- 1.4.2.1 Cost Model
- 1.4.2.2 Crop Pattern
- 1.4.2.3 Stress Pattern
- 1.4.2.4 Labor Availability and Awareness
- 1.4.2.5 Government Policies and Regulations
- 1.4.1 Farm Size
- 1.5 Italy
- 1.5.1 Farm Size
- 1.5.2 Farm Economics
- 1.5.2.1 Cost Model
- 1.5.2.2 Crop Pattern
- 1.5.2.3 Stress Pattern
- 1.5.2.4 Labor Availability and Awareness
- 1.5.2.5 Government Policies and Regulations
- 1.6 Spain
- 1.6.1 Farm Size
- 1.6.1.1 Farm Structure
- 1.6.2 Farm Economics
- 1.6.2.1 Cost Model
- 1.6.2.2 Crop Pattern
- 1.6.2.3 Stress Pattern
- 1.6.2.4 Labor Availability and Awareness
- 1.6.2.5 Government Policies and Regulations
- 1.6.1 Farm Size
- 1.7 Romania
- 1.7.1 Farm Size
- 1.7.1.1 Farm Structure
- 1.7.2 Farm Economics
- 1.7.2.1 Cost Model
- 1.7.2.2 Crop Pattern
- 1.7.2.3 Stress Pattern
- 1.7.2.4 Labor Availability and Awareness
- 1.7.2.5 Government Policies and Regulations
- 1.7.1 Farm Size
- 1.8 China
- 1.8.1 Farm Size
- 1.8.1.1 Farm Structure
- 1.8.2 Farm Economics
- 1.8.2.1 Cost Model
- 1.8.2.2 Crop Pattern
- 1.8.2.3 Stress Pattern
- 1.8.2.4 Labor Availability and Awareness
- 1.8.2.5 Government Policies and Regulations
- 1.8.1 Farm Size
- 1.9 Japan
- 1.9.1 Farm Size
- 1.9.1.1 Farm Structure
- 1.9.2 Farm Economics
- 1.9.2.1 Cost Model
- 1.9.2.2 Crop Pattern
- 1.9.2.3 Stress Pattern
- 1.9.2.4 Labor Availability and Awareness
- 1.9.2.5 Government Policies and Regulations
- 1.9.1 Farm Size
- 1.1 Australia
- 1.10.1 Farm Size
- 1.10.1.1 Farm Structure
- 1.10.2 Farm Economics
- 1.10.2.1 Cost Model
- 1.10.2.2 Crop Pattern
- 1.10.2.3 Stress Pattern
- 1.10.2.4 Labor Availability and Awareness
- 1.10.2.5 Government Policies and Regulations
- 1.10.1 Farm Size
- 1.11 India
- 1.11.1 Farm Size
- 1.11.1.1 Farm Structure
- 1.11.2 Farm Economics
- 1.11.2.1 Cost Model
- 1.11.2.2 Crop Pattern
- 1.11.2.3 Stress Pattern
- 1.11.2.4 Labor Availability and Awareness
- 1.11.2.5 Government Policies and Regulations
- 1.11.1 Farm Size
- 1.12 Turkey
- 1.12.1 Farm Size
- 1.12.1.1 Farm Structure
- 1.12.2 Farm Economics
- 1.12.2.1 Cost Model
- 1.12.2.2 Crop Pattern
- 1.12.2.3 Stress Pattern
- 1.12.2.4 Labor Availability and Awareness
- 1.12.2.5 Government Policies and Regulations
- 1.12.1 Farm Size
- 1.13 Ukraine
- 1.13.1 Farm Size
- 1.13.1.1 Farm Structure
- 1.13.2 Farm Economics
- 1.13.2.1 Cost Model
- 1.13.2.2 Crop Pattern
- 1.13.2.3 Stress Pattern
- 1.13.2.4 Labor Availability and Awareness
- 1.13.2.5 Government Policies and Regulations
- 1.13.1 Farm Size
2 Agriculture Customer Segmentation Market (by Farmer's Age Group)
- 2.1 Technology Adoption Patterns by Farmer's Age Group
- 2.1.1 Young Farmers (18-30 years)
- 2.1.1.1 Challenges
- 2.1.1.2 Opportunities
- 2.1.2 Middle-Aged Farmers (31-50 years)
- 2.1.2.1 Challenges
- 2.1.2.2 Opportunities
- 2.1.3 Older Farmers (51 years and above)
- 2.1.3.1 Challenges
- 2.1.3.2 Opportunities
- 2.1.1 Young Farmers (18-30 years)
- 2.2 Impact of Age on Buying Behavior and Preferences
- 2.3 Case Studies on Age-Based Technology Usage
3 Agriculture Customer Segmentation Market (by Farm Ownership)
- 3.1 Types of Farms Ownerships
- 3.1.1 Smallholder Farms
- 3.1.1.1 Challenges
- 3.1.1.2 Opportunities
- 3.1.2 Family-Owned Farms
- 3.1.2.1 Challenges
- 3.1.2.2 Opportunities
- 3.1.3 Corporate Farms
- 3.1.3.1 Challenges
- 3.1.3.2 Opportunities
- 3.1.4 Cooperative Farms
- 3.1.4.1 Challenges
- 3.1.4.2 Opportunities
- 3.1.5 Farm Ownership Influence on Investment in Smart Technologies
- 3.1.1 Smallholder Farms
4 Agriculture Customer Segmentation Market (by Crop Type)
- 4.1 Crop Type
- 4.1.1 Technology Adoption (by Crop Type)
- 4.1.2 Crop Type and its Impact on Smart Technology Use
- 4.1.3 Regional Variations in Crop Technology Adoption
5 Conclusions and Recommendations
- 5.1 Expansion of Agri-Tech Startups
- 5.2 Recommendations for Targeted Marketing and Product Development
- 5.3 Trends
- 5.3.1 Increasing Demand for Organic Farming Practices
- 5.3.2 Growing Focus on Climate-Resilient Farming Practices
- 5.4 Opportunities
- 5.4.1 Government Support and Subsidies
- 5.4.2 Expansion in Emerging Economies
6 Research Methodology
- 6.1 Data Sources
- 6.1.1 Primary Data Sources
- 6.1.2 Secondary Data Sources
