|
|
市場調査レポート
商品コード
1657954
欧州のスマートハーベスト市場:用途別、製品別、国別 - 分析と予測(2024年~2033年)Europe Smart Harvest Market: Focus on Application, Product, and Country - Analysis and Forecast, 2024-2033 |
||||||
|
|||||||
カスタマイズ可能
|
|||||||


| 欧州のスマートハーベスト市場:用途別、製品別、国別 - 分析と予測(2024年~2033年) |
|
出版日: 2025年02月19日
発行: BIS Research
ページ情報: 英文 83 Pages
納期: 1~5営業日
|

全表示
- 概要
- 図表
- 目次
欧州のスマートハーベストの市場規模は、2024年の15億9,530万米ドルから2033年には31億350万米ドルに達し、2024年から2033年の予測期間中のCAGRは7.67%になると予測されています。
欧州のスマートハーベスト市場は、同地域の持続可能な農業へのシフトと先進農業技術の採用増加により、大幅な成長が見込まれています。機械学習と人工知能の進歩により収穫手順が変化し、精度と生産性が向上しています。さらに、持続可能な農業と食糧安全保障を支援する政府の強力な取り組みにより、スマート収穫ソリューションへの多額の投資が推進されています。その結果、市場は絶え間ないイノベーションに見舞われており、主要参入企業は環境の持続可能性、生産性、資源効率を高める革新的な方法を生み出しています。このような環境の変化を考えると、スマートハーベスティング技術は、欧州の農業近代化の試みにとって不可欠です。
| 主要市場統計 | |
|---|---|
| 予測期間 | 2024年~2033年 |
| 2024年の評価 | 15億9,530万米ドル |
| 2033年予測 | 31億350万米ドル |
| CAGR | 7.67% |
欧州では、持続可能性、効率性、生産性を向上させるために最先端の農業技術を利用するケースが増えており、スマートハーベスト市場は大きく拡大しています。伝統的な農法は、食糧需要の増大と資源の最適化の必要性に対応して、ロボット工学、機械学習、人工知能(AI)を統合したスマート収穫ソリューションによって変革されつつあります。精密収穫はこれらの技術によって可能になり、労働力への依存度を下げながら作物の収量と品質を向上させます。
食糧安全保障と持続可能な農業を支援する政府プログラムは、市場成長を推進する重要な要因です。自動収穫システムの採用は、欧州連合(EU)がスマート農業に重点を置き、農業技術革新に資金を提供することで加速しています。また、収穫プロセスは、自律型収穫装置とIoT対応センサーの利用増加によってさらに最適化され、リアルタイムの意思決定が向上しています。
気候変動や環境問題が農法に影響を及ぼす中、スマート収穫技術は長期的な持続可能性に不可欠です。欧州のスマートハーベスト市場は、自動化とAI主導の分析における継続的な開発により大きく成長すると予想され、現代の農業を変革し、より生産的で環境に優しい農業への移行を支援します。
当レポートでは、欧州のスマートハーベスト市場について調査し、市場の概要とともに、用途別、製品別、国別の動向、および市場に参入する企業のプロファイルなどを提供しています。
目次
エグゼクティブサマリー
第1章 市場
- 動向:現在および将来の影響評価
- サプライチェーンの概要
- 研究開発レビュー
- 規制状況
- ステークホルダー分析
- 市場力学:概要
- 市場における主要製品のアーキテクチャ/技術比較
第2章 地域
- 地域別概要
- 促進要因と抑制要因
- 欧州
第3章 市場-競合ベンチマーキングと企業プロファイル
- 今後の見通し
- 地理的評価
- Agrobot
- Dogtooth Technologies Limited
- OCTINION
- Organifarms GmbH
- AVL Motion B.V.
- Fieldwork Robotics
- AMB Rousset
第4章 調査手法
List of Figures
- Figure 1: Smart Harvest Market (by Region), $Million, 2024, 2028, and 2033
- Figure 2: Europe Smart Harvest Market (by Site of Operation), $Million, 2024, 2028, and 2033
- Figure 3: Europe Smart Harvest Market (by Crop Type), $Million, 2024, 2028, and 2033
- Figure 4: Europe Smart Harvest Market (by Product), $Million, 2024, 2028, and 2033
- Figure 5: Europe Smart Harvest Market, Recent Developments
- Figure 6: Supply Chain and Risks within the Supply Chain
- Figure 7: Smart Harvest Market, Global Pricing Snapshot, by Product, $/Unit, 2024, 2028, and 2033
- Figure 8: Patent Analysis (by Country), January 2021 and December 2023
- Figure 9: Patent Analysis (by Company), January 2021 and December 2023
- Figure 10: Germany Smart Harvest Market, $Million, 2023-2033
- Figure 11: France Smart Harvest Market, $Million, 2023-2033
- Figure 12: Italy Smart Harvest Market, $Million, 2023-2033
- Figure 13: Spain Smart Harvest Market, $Million, 2023-2033
- Figure 14: U.K. Smart Harvest Market, $Million, 2023-2033
- Figure 15: Rest-of-Europe Smart Harvest Market, $Million, 2023-2033
- Figure 16: Strategic Initiatives, 2021-2023
- Figure 17: Share of Strategic Initiatives, 2021-2023
- Figure 18: Data Triangulation
- Figure 19: Top-Down and Bottom-Up Approach
- Figure 20: Assumptions and Limitations
List of Tables
- Table 1: Market Snapshot
- Table 2: Smart Harvest Market, Opportunities across Regions
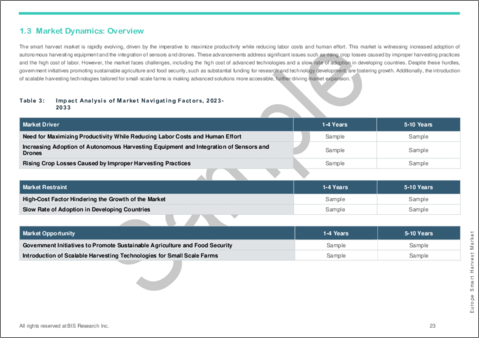
- Table 3: Impact Analysis of Market Navigating Factors, 2023-2033
- Table 4: Technical Parameters Comparison for Smart Harvesters
- Table 5: Smart Harvest Market (by Region), $Million, 2023-2033
- Table 6: Europe Smart Harvest Market (by Site of Operation), $Million, 2023-2033
- Table 7: Europe Smart Harvest Market (by Crop Type), $Million, 2023-2033
- Table 8: Europe Smart Harvest Market (by Product), $Million, 2023-2033
- Table 9: Germany Smart Harvest Market (by Site of Operation), $Million, 2023-2033
- Table 10: Germany Smart Harvest Market (by Crop Type), $Million, 2023-2033
- Table 11: Germany Smart Harvest Market (by Product), $Million, 2023-2033
- Table 12: France Smart Harvest Market (by Site of Operation), $Million, 2023-2033
- Table 13: France Smart Harvest Market (by Crop Type), $Million, 2023-2033
- Table 14: France Smart Harvest Market (by Product), $Million, 2023-2033
- Table 15: Italy Smart Harvest Market (by Site of Operation), $Million, 2023-2033
- Table 16: Italy Smart Harvest Market (by Crop Type), $Million, 2023-2033
- Table 17: Italy Smart Harvest Market (by Product), $Million, 2023-2033
- Table 18: Spain Smart Harvest Market (by Site of Operation), $Million, 2023-2033
- Table 19: Spain Smart Harvest Market (by Crop Type), $Million, 2023-2033
- Table 20: Spain Smart Harvest Market (by Product), $Million, 2023-2033
- Table 21: U.K. Smart Harvest Market (by Site of Operation), $Million, 2023-2033
- Table 22: U.K. Smart Harvest Market (by Crop Type), $Million, 2023-2033
- Table 23: U.K. Smart Harvest Market (by Product), $Million, 2023-2033
- Table 24: Rest-of-Europe Smart Harvest Market (by Site of Operation), $Million, 2023-2033
- Table 25: Rest-of-Europe Smart Harvest Market (by Crop Type), $Million, 2023-2033
- Table 26: Rest-of-Europe Smart Harvest Market (by Product), $Million, 2023-2033
- Table 27: Market Share, Robotic Harvester Manufacturers, 2023
- Table 28: Market Share, Smart Harvester Manufacturers, 2023
Introduction to Europe Smart Harvest Market
The Europe smart harvest market is projected to reach $3,103.5 million by 2033 from $1,595.3 million in 2024, growing at a CAGR of 7.67% during the forecast period of 2024-2033. The Europe Smart Harvest Market is expected to grow significantly, driven by the region's shift toward sustainable agriculture and increased adoption of advanced farming technologies. Harvesting procedures are changing as a result of advancements in machine learning and artificial intelligence, which increase accuracy and productivity. Furthermore, significant investments in smart harvesting solutions are being driven by robust government initiatives that support sustainable agriculture and food security. As a result, the market is experiencing constant innovation, with major players creating innovative ways to boost environmental sustainability, productivity, and resource efficiency. Given this changing environment, smart harvesting technologies are essential to Europe's attempts to modernize its agriculture.
Market Introduction
| KEY MARKET STATISTICS | |
|---|---|
| Forecast Period | 2024 - 2033 |
| 2024 Evaluation | $1,595.3 Million |
| 2033 Forecast | $3,103.5 Million |
| CAGR | 7.67% |
The market for smart harvests in Europe is expanding significantly as the region uses more and more cutting-edge agricultural technologies to increase sustainability, efficiency, and productivity. Traditional farming practices are being transformed by smart harvesting solutions that integrate robotics, machine learning, and artificial intelligence (AI) in response to the growing demand for food and the need to optimize resources. Precision harvesting is made possible by these technologies, which increase crop yield and quality while lowering reliance on labor.
Government programs that support food security and sustainable agriculture are important factors propelling market growth. The adoption of automated harvesting systems is being accelerated by the European Union's emphasis on smart farming and its funding initiatives for agri-tech innovations. The harvesting process is also being further optimized by the increasing use of autonomous harvesting equipment and IoT-enabled sensors, which improve real-time decision-making.
As climate change and environmental concerns affect farming methods, smart harvest technologies are essential to long-term sustainability. The Europe Smart Harvest Market is expected to grow significantly due to ongoing developments in automation and AI-driven analytics, which will transform contemporary farming and aid in the region's shift to a more productive and environmentally friendly agricultural industry.
Market Segmentation:
Segmentation 1: by Site of Operation
- On Field
- Controlled Environment
- Greenhouses
- Indoor Farms
Segmentation 2: by Crop Type
- Grain Crops
- Fruits and Vegetables
- Others
Segmentation 3: by Product
- Robotic Harvester
- Smart Harvester
- Self-Propelled
- Tractor Mounted
- Harvest Dynamic Monitoring
Segmentation 4: by Country
- Germany
- France
- Spain
- U.K.
- Italy
- Rest-of-Europe
How can this report add value to an organization?
Product/Innovation Strategy: This report provides a comprehensive product/innovation strategy for the Europe smart harvest market, identifying opportunities for market entry, technology adoption, and sustainable growth. It offers actionable insights, helping organizations leverage smart harvest to meet environmental standards, gain a competitive edge, and capitalize on the increasing demand for eco-friendly solutions in agriculture.
Growth/Marketing Strategy: This report offers a comprehensive growth and marketing strategy designed specifically for the Europe smart harvest market. It presents a targeted approach to identifying specialized market segments, establishing a competitive advantage, and implementing creative marketing initiatives aimed at optimizing market share and financial performance. By harnessing these strategic recommendations, organizations can elevate their market presence, seize emerging prospects, and efficiently propel revenue expansion.
Competitive Strategy: This report crafts a strong competitive strategy tailored to the Europe smart harvest market. It evaluates market rivals, suggests methods to stand out, and offers guidance for maintaining a competitive edge. By adhering to these strategic directives, companies can position themselves effectively in the face of market competition, ensuring sustained prosperity and profitability.
Key Market Players and Competition Synopsis
The companies that are profiled in the report have been selected based on inputs gathered from primary experts and analyzing company coverage, product portfolio, and market penetration.
Some of the prominent names in this market are:
- Agrobot
- Dogtooth Technologies Limited
- OCTINION
- Organifarms GmbH
- AVL Motion B.V.
- Fieldwork Robotics
- AMB Rousset
Table of Contents
Executive Summary
Scope and Definition
1 Markets
- 1.1 Trends: Current and Future Impact Assessment
- 1.1.1 Trends: Current and Future Impact Assessment
- 1.1.1.1 Advancements in Satellite Imaging Technologies to Forecast Harvest Yield and Potential Disruptions
- 1.1.1.2 Introduction of Agriculture 4.0
- 1.1.1 Trends: Current and Future Impact Assessment
- 1.2 Supply Chain Overview
- 1.2.1 Value Chain Analysis
- 1.2.2 Market Map
- 1.2.2.1 Europe Smart Harvest Market- by Product
- 1.2.2.1.1 Robotic Harvester
- 1.2.2.1.2 Smart Harvester
- 1.2.2.1.3 Harvest Dynamic Monitoring
- 1.2.2.1 Europe Smart Harvest Market- by Product
- 1.2.3 Pricing Forecast
- 1.3 Research and Development Review
- 1.3.1 Patent Filing Trend (by Country and Company)
- 1.4 Regulatory Landscape
- 1.5 Stakeholder Analysis
- 1.5.1 Use Case
- 1.5.1.1 Use Case Examination:
- 1.5.1.1.1 Feil Agriculture & Service
- 1.5.1.1.2 Automation of Crop Yield Assessment:
- 1.5.1.1.3 Flaskamp Contracting Business
- 1.5.1.1.4 Augmenta NVRA - Enhancing Efficiency in the Smart Harvest Market
- 1.5.1.1.5 Analyst View
- 1.5.1.1 Use Case Examination:
- 1.5.1 Use Case
- 1.6 Market Dynamics: Overview
- 1.6.1 Market Drivers
- 1.6.1.1 Need for Maximizing Productivity While Reducing Labor Costs and Human Effort
- 1.6.1.2 Increasing Adoption of Autonomous Harvesting Equipment and Integration of Sensors and Drones
- 1.6.1.3 Rising Crop Losses Caused by Improper Harvesting Practices
- 1.6.2 Market Restraints
- 1.6.2.1 High-Cost Factor Hindering the Growth of the Market
- 1.6.2.2 Slow Rate of Adoption in Developing Countries
- 1.6.3 Market Opportunities
- 1.6.3.1 Government Initiatives to Promote Sustainable Agriculture and Food Security
- 1.6.3.2 Introduction of Scalable Harvesting Technologies for Small Scale Farms
- 1.6.1 Market Drivers
- 1.7 Architectural/Technical Comparison of Key Products in the Market
2 Regions
- 2.1 Regional Summary
- 2.2 Drivers and Restraints
- 2.3 Europe
- 2.3.1 Regional Overview
- 2.3.2 Driving Factors for Market Growth
- 2.3.3 Factors Challenging the Market
- 2.3.4 Application
- 2.3.5 Product
- 2.3.6 Germany
- 2.3.6.1 Application
- 2.3.6.2 Product
- 2.3.7 France
- 2.3.7.1 Application
- 2.3.7.2 Product
- 2.3.8 Italy
- 2.3.8.1 Application
- 2.3.8.2 Product
- 2.3.9 Spain
- 2.3.9.1 Application
- 2.3.9.2 Product
- 2.3.10 U.K.
- 2.3.10.1 Application
- 2.3.10.2 Product
- 2.3.11 Rest-of-Europe
- 2.3.11.1 Application
- 2.3.11.2 Product
3 Markets - Competitive Benchmarking & Company Profiles
- 3.1 Next Frontiers
- 3.2 Geographic Assessment
- 3.2.1 Agrobot
- 3.2.1.1 Overview
- 3.2.1.2 Top Products/Product Portfolio
- 3.2.1.3 Top Competitors
- 3.2.1.4 Target Customers
- 3.2.1.5 Key Personnel
- 3.2.1.6 Analyst View
- 3.2.1.7 Market Share, 2023
- 3.2.2 Dogtooth Technologies Limited
- 3.2.2.1 Overview
- 3.2.2.2 Top Products/Product Portfolio
- 3.2.2.3 Top Competitors
- 3.2.2.4 Target Customers
- 3.2.2.5 Key Personnel
- 3.2.2.6 Analyst View
- 3.2.2.7 Market Share, 2023
- 3.2.3 OCTINION
- 3.2.3.1 Overview
- 3.2.3.2 Top Products/Product Portfolio
- 3.2.3.3 Top Competitors
- 3.2.3.4 Target Customers
- 3.2.3.5 Key Personnel
- 3.2.3.6 Analyst View
- 3.2.4 Organifarms GmbH
- 3.2.4.1 Overview
- 3.2.4.2 Top Products/Product Portfolio
- 3.2.4.3 Top Competitors
- 3.2.4.4 Target Customers
- 3.2.4.5 Key Personnel
- 3.2.4.6 Analyst View
- 3.2.5 AVL Motion B.V.
- 3.2.5.1 Overview
- 3.2.5.2 Top Products/Product Portfolio
- 3.2.5.3 Top Competitors
- 3.2.5.4 Target Customers
- 3.2.5.5 Key Personnel
- 3.2.5.6 Analyst View
- 3.2.6 Fieldwork Robotics
- 3.2.6.1 Overview
- 3.2.6.2 Top Products/Product Portfolio
- 3.2.6.3 Top Competitors
- 3.2.6.4 Target Customers
- 3.2.6.5 Key Personnel
- 3.2.6.6 Analyst View
- 3.2.7 AMB Rousset
- 3.2.7.1 Overview
- 3.2.7.2 Top Products/Product Portfolio
- 3.2.7.3 Top Competitors
- 3.2.7.4 Target Customers
- 3.2.7.5 Key Personnel
- 3.2.7.6 Analyst View
- 3.2.7.7 Market Share, 2023
- 3.2.1 Agrobot
4 Research Methodology
- 4.1 Data Sources
- 4.1.1 Primary Data Sources
- 4.1.2 Secondary Data Sources
- 4.1.3 Data Triangulation
- 4.2 Market Estimation and Forecast

