|
|
市場調査レポート
商品コード
1460110
欧州のメタノール生産、貯蔵、輸送市場:メタノール生産・貯蔵・輸送サービス別 - 地域別分析(2023年~2033年)Europe Methanol Production, Storage, and Transportation Market: Focus on Methanol Production and Storage and Transportation Services - A Regional Analysis, 2023-2033 |
||||||
|
|||||||
カスタマイズ可能
|
|||||||


| 欧州のメタノール生産、貯蔵、輸送市場:メタノール生産・貯蔵・輸送サービス別 - 地域別分析(2023年~2033年) |
|
出版日: 2024年04月08日
発行: BIS Research
ページ情報: 英文
納期: 1~5営業日
|

全表示
- 概要
- 図表
- 目次
欧州のメタノール生産・貯蔵・輸送の市場規模は、数量ベースで2023年に854万トンと測定され、今後数年間で大幅な成長がみられ、2033年には3,126万5,400トンに達すると予測されています。
この成長は、様々な産業におけるメタノール生産・貯蔵・輸送の原料としての需要の増加、よりクリーンで持続可能な燃料オプションへのシフト、代替燃料としてのメタノール生産・貯蔵・輸送の利用を促進する政府の取り組みなど、いくつかの要因によってもたらされます。メタノールの生産・貯蔵・輸送は、温室効果ガスの排出を削減し、持続可能な目標を達成するための有望なソリューションであり、二酸化炭素排出量の削減を目指す産業にとって魅力的な選択肢となっています。欧州のメタノール生産・貯蔵・輸送市場は、こうした動向から恩恵を受けると予想され、企業は生産効率の向上とコスト削減のための研究開発に投資しています。欧州におけるメタノール生産・貯蔵・輸送市場の需要拡大に対応しようとする企業にとって、生産インフラと輸送ネットワークへの戦略的投資は極めて重要です。重要なパートナーシップを確立し、将来を見据えた戦略を採用することで、企業は欧州メタノール生産・貯蔵・輸送市場のリーダーとしての地位を確立し、業界の将来を形成し、市場の進化するニーズに応える上で重要な役割を果たすことができます。
| 主要市場統計 | |
|---|---|
| 予測期間 | 2023年~2033年 |
| 2023年の評価 | 854万トン |
| 2033年予測 | 3,126万5,400トン |
| CAGR | 13.86% |
欧州のメタノール生産・貯蔵・輸送セクターでは、技術的進歩と市場拡大を中心とした主要参入企業の戦略的試みが目立っています。スペインのC2X CepsaとポルトガルのMadoqua Venturesは、2028年までにメタノール生産技術を強化し、それぞれ300キロトン(KT)と260キロトンの生産能力を目指します。スペインの有利な立地とインフラは、メタノール生産の理想的なハブとして位置づけられ、C2Xセプサや他の企業の成長を促進します。一方、再生可能エネルギーに重点を置くポルトガルは、持続可能なメタノール生産技術を発展させるというMadoqua Venturesのコミットメントと一致しています。スペインのレプソルとフランスのエリセは、2028年までにそれぞれ237KTと200KTのメタノール生産、貯蔵、輸送の商業化に注力しています。スペインの強固な産業基盤はレプソルの努力を支え、エリセはフランスの再生可能エネルギーへの取り組みから利益を得ています。さらに、オランダのLowlands MethanolとデンマークのGreen2xは、2028年までにそれぞれ120 KTと320 KTのグリーンメタノール生産能力で市場に貢献することを目指しています。オランダの戦略的立地とインフラストラクチャー、デンマークの持続可能性への注力は、欧州メタノール生産・貯蔵・輸送市場におけるこれらの企業の成長を促進します。
当レポートでは、欧州のメタノール生産、貯蔵、輸送市場について調査し、市場の概要とともに、メタノール生産・貯蔵・輸送サービス別、地域別の動向、および市場に参入する企業のプロファイルなどを提供しています。
目次
エグゼクティブサマリー
第1章 市場
- 動向:現在および将来の影響評価
- サプライチェーンの概要
- ステークホルダー分析
- 市場力学の概要
第2章 欧州のメタノール生産、貯蔵、輸送市場、製品別
- 欧州メタノール生産・貯蔵・輸送市場、生産タイプ別
- グリーンメタノール生産
- 従来のメタノール生産
第3章 欧州のメタノール生産、貯蔵、輸送市場、国別
- ドイツ
- オランダ
- 英国
- スペイン
- ポルトガル
- デンマーク
- スウェーデン
- フィンランド
- ノルウェー
- イタリア
- クロアチア
- アイスランド
- その他
第4章 調査手法
List of Figures
- Figure 1: Conventional Methanol Production (by Country), Thousand Tons, 2023, 2026, 2033
- Figure 2: Europe Green Methanol Production (by Country), Thousand Tons, 2023, 2033
- Figure 3: Key Events
- Figure 4: Supply Chain and Risks within the Supply Chain
- Figure 5: Value Chain Analysis
- Figure 6: Pricing Forecast, Methanol Market Services Asia (MMSA) Spot Avg, $/Ton, 2018-2028
- Figure 7: Pricing Forecast, MMSA Contract, $/Ton, 2018-2028
- Figure 8: Rest-of-Europe Production Volume, Current and Future Scenarios, Thousand Tons, 2022-2033
- Figure 9: Data Triangulation
- Figure 10: Top-Down and Bottom-Up Approach
- Figure 11: Assumptions and Limitations
List of Tables
- Table 1: Market Snapshot
- Table 2: Opportunities across Regions
- Table 3: Impact Analysis of Market Navigating Factors, 2023-2033
- Table 4: European Production Volume, Current and Future Scenarios, Thousand Tons, 2022-2033
- Table 5: Key Producers and Production Capacities
- Table 6: European Production Volume, Current and Future Scenarios, Thousand Tons, 2022-2033
- Table 7: Germany Production Volume, Current and Future Scenarios, Thousand Tons, 2022-2033
- Table 8: Germany Production Volume, Current and Future Scenarios, Thousand Tons, 2022-2033
- Table 9: Key Producers and Production Capacities
- Table 10: Netherlands Production Volume, Current and Future Scenarios, Thousand Tons, 2022-2033
- Table 11: Netherlands Production Volume, Current and Future Scenarios, Thousand Tons, 2022-2033
- Table 12: Key Producers and Production Capacities
- Table 13: U.K. Production Volume, Current and Future Scenarios, Thousand Tons, 2022-2033
- Table 14: U.K. Production Volume, Current and Future Scenarios, Thousand Tons, 2022-2033
- Table 15: Spain Production Volume, Current and Future Scenarios, Thousand Tons, 2022-2033
- Table 16: Spain Production Volume, Current and Future Scenarios, Thousand Tons, 2022-2033
- Table 17: Key Producers and Production Capacities
- Table 18: Portugal Production Volume, Current and Future Scenarios, Thousand Tons, 2022-2033
- Table 19: Portugal Production Volume, Current and Future Scenarios, Thousand Tons, 2022-2033
- Table 20: Key Producers and Production Capacities
- Table 21: Denmark Production Volume, Current and Future Scenarios, Thousand Tons, 2022-2033
- Table 22: Denmark Production Volume, Current and Future Scenarios, Thousand Tons, 2022-2033
- Table 23: Key Producers and Production Capacities
- Table 24: Sweden Production Volume, Current and Future Scenarios, Thousand Tons, 2022-2033
- Table 25: Sweden Production Volume, Current and Future Scenarios, Thousand Tons, 2022-2033
- Table 26: Key Producers and Production Capacities
- Table 27: Finland Production Volume, Current and Future Scenarios, Thousand Tons, 2022-2033
- Table 28: Finland Production Volume, Current and Future Scenarios, Thousand Tons, 2022-2033
- Table 29: Key Producers and Production Capacities
- Table 30: Norway Production Volume, Current and Future Scenarios, Thousand Tons, 2022-2033
- Table 31: Norway Production Volume, Current and Future Scenarios, Thousand Tons, 2022-2033
- Table 32: Key Producers and Production Capacities
- Table 33: Italy Production Volume, Current and Future Scenarios, Thousand Tons, 2022-2033
- Table 34: Italy Production Volume, Current and Future Scenarios, Thousand Tons, 2022-2033
- Table 35: Key Producers and Production Capacities
- Table 36: Croatia Production Volume, Current and Future Scenarios, Thousand Tons, 2022-2033
- Table 37: Croatia Production Volume, Current and Future Scenarios, Thousand Tons, 2022-2033
- Table 38: Iceland Production Volume, Current and Future Scenarios, Thousand Tons, 2022-2033
- Table 39: Iceland Production Volume, Current and Future Scenarios, Thousand Tons, 2022-2033
- Table 40: Key Producers and Production Capacities
- Table 41: Rest-of-Europe Production Volume, Current and Future Scenarios, Thousand Tons, 2022-2033
- Table 42: Key Producers and Production Capacities
Europe Methanol Production, Storage, and Transportation Market Overview
The Europe methanol production, storage, and transportation market in terms of volume was measured at 8,540.0 thousand tons in 2023, and it is expected to witness significant growth in the coming years, reaching 31,265.4 thousand tons by 2033. This growth is driven by several factors, including increasing demand for methanol production, storage, and transportation as a feedstock in various industries, the shift toward cleaner and more sustainable fuel options, and government initiatives promoting using methanol production, storage, and transportation as an alternative fuel. Methanol production, storage, and transportation offers a promising solution for reducing greenhouse gas emissions and meeting sustainability goals, making it an attractive option for industries looking to reduce their carbon footprint. The market for methanol production, storage, and transportation in Europe is expected to benefit from these trends, with companies investing in research and development to enhance production efficiency and reduce costs. Strategic investments in production infrastructure and transportation networks will be crucial for companies looking to capitalize on the growing demand for methanol production, storage, and transportation market in Europe. By establishing key partnerships and adopting forward-thinking strategies, companies can position themselves as leaders in the Europe methanol production, storage, and transportation market, playing a crucial role in shaping the future of the industry and meeting the evolving needs of the market.
Market Introduction
| KEY MARKET STATISTICS | |
|---|---|
| Forecast Period | 2023 - 2033 |
| 2023 Evaluation | 8,540.0 Thousand Tons |
| 2033 Forecast | 31,265.4 Thousand Tons |
| CAGR | 13.86% |
The Europe methanol production, storage, and transportation sector is witnessing notable strategic endeavors from key players centered on technological advancements and market expansion. C2X Cepsa in Spain and Madoqua Ventures in Portugal aim to enhance methanol production technology by 2028, with capacities of 300 kiloton (KT) and 260 KT, respectively. Spain's advantageous location and infrastructure position it as an ideal hub for methanol production, facilitating growth for C2X Cepsa and other firms. Meanwhile, Portugal's focus on renewable energy aligns with Madoqua Ventures' commitment to advancing methanol production technology sustainably. Repsol in Spain and Elyse in France are focused on commercializing methanol production, storage, and transportation, with capacities of 237 KT and 200 KT, respectively, by 2028. Spain's robust industrial base supports Repsol's efforts, while Elyse benefits from France's renewable energy commitment. Additionally, Lowlands Methanol in the Netherlands and Green2x in Denmark aim to contribute to the market with capacities of 120 KT and 320 KT of green methanol production, respectively, by 2028. The Netherlands' strategic location and infrastructure, along with Denmark's focus on sustainability, drive growth for these companies in the Europe methanol production, storage, and transportation market.
Industrial Impact
The Europe methanol production, storage, and transportation market study offers a detailed analysis of both conventional and green methanol sectors, covering production volume, key producers, supply chain, and market dynamics. It comprehensively examines key European countries' market landscapes, including Germany, the Netherlands, the U.K., Spain, Portugal, Denmark, Sweden, Finland, Norway, Italy, Croatia, Iceland, and Rest-of-Europe. Through primary interviews with industry experts and extensive secondary research, the study aims to uncover market trends, growth drivers, and challenges, utilizing analytical tools and predictive models for forecasting. Its focus is on understanding current and future trends in the Europe methanol production, storage, and transportation market.
Market Segmentation:
Segmentation 1: by Product
- Methanol
- Green Methanol
The market analysis of the European methanol production, storage, and transportation sector offers a detailed examination of both conventional methanol production, storage, and transportation and green methanol production, storage, and transportation industries. It explores crucial aspects such as production volume across different countries, key players, supply chain evaluation, and market dynamics for both variants of methanol.
Segmentation 2: by Country
- Germany
- Netherlands
- U.K.
- Spain
- Portugal
- Denmark
- Sweden
- Finland
- Norway
- Italy
- Croatia
- Iceland
- Rest -of-the-Europe
Germany to Dominate the Europe Methanol Production, Storage, and Transportation Market (by Country)
Germany's advancements in methanol production, storage, and transportation synthesis from industrial waste gases, showcased by Fraunhofer ISE, solidify its leadership in the Europe methanol production, storage, and transportation market. Despite challenges such as high installation costs, Germany's proactive R&D efforts position it favorably. Meanwhile, OCI Netherlands, despite shutting down its methanol plant due to high natural gas costs, remains optimistic about the global market's long-term prospects. The Russia-Ukraine conflict has further supported methanol production, storage, and transportation prices amidst rising energy costs. OCI's hedging strategy for natural gas secures stability, indicating resilience and strategic foresight in navigating market fluctuations.
Recent Developments in the Europe Methanol Production, Storage, and Transportation Market
- In September 2023, Spanish oil company Cepsa and Danish developer C2X, majority-owned by A.P. Moller-Maersk parent company AP Moller, announced plans to construct Europe's largest green methanol production, storage, and transportation project in Huelva, southern Spain. This project aimed to produce 300,000 tons of green methanol production, storage, and transportation annually, utilizing a combination of green hydrogen and captured CO2, with an estimated cost of up to $1.08 billion.
- Waterfront Shipping and Mitsui OSK Lines (MOL) marked a milestone in early 2023 by completing the world's first net-zero voyage fueled by bio-methanol, showcasing a viable pathway to decarbonize the shipping industry.
- The Methanol Institute (MI) collaborated with Finland's GENA Solutions Oy in February 2024 to establish a comprehensive database tracking 131 global methanol production projects, with a projected capacity of 19.5 million metric tons by 2028. This surge, including low-carbon methanol production, storage, and transportation projects, is seen as pivotal for the low-carbon transition in sectors such as shipping and aviation.
Demand - Drivers, Challenges, and Opportunities
Market Drivers: Increased Government Activities toward Low-Carbon Infrastructure
- European nations are actively enforcing regulations to boost the adoption of e-methanol as a carbon-neutral fuel. Incentives, subsidies, and tax benefits are fueling demand among businesses and consumers, aligning with Europe's commitment to carbon neutrality and reducing the carbon footprint through e-methanol production and utilization.
- An illustrative example is the European Green Deal, which aims to achieve climate neutrality in Europe by 2050, reflecting the continent's ambitious climate targets. E-methanol, produced using renewable energy and emitting no CO2 during combustion, supports these goals by offering a means to decarbonize diverse sectors such as transportation, industry, power generation, and chemical manufacturing. The resonance with these ambitious objectives is driving a growing demand for e-methanol in Europe.
Market Challenges: Toxicity, Density, and Flammable Potential of Methanol
- Methanol production, storage, and transportation poses potential hazards due to its toxicity, with lethal consequences if ingested. Additionally, it has the tendency to absorb moisture from the atmosphere, potentially causing phase separation in methanol/gasoline blends. Furthermore, methanol production, storage, and transportation exhibits corrosive properties toward certain metals and is incompatible with certain plastics, resins, and rubber materials. Therefore, careful consideration and selection of compatible metals, plastics, and elastomers are imperative when working with methanol.
- The ingestion of methanol exceeding 20 ml can result in lethality, while smaller amounts are associated with irreversible blindness. Methanol production, storage, and transportation shares similarities in metabolism and toxicity with ethylene glycol. The toxic effects of methanol production, storage, and transportation are attributed to its degradation products, namely formaldehyde and formate. Therefore, cautious measures should be observed when handling and dispensing methanol production, storage, and transportation to mitigate potential risks.
Market Opportunities: Adoption of E-Methanol as a Shipping Fuel
- E-methanol emerges as a highly adaptable and sustainable marine fuel, seamlessly integrating into existing ship engines and fuel systems with minimal modifications. This versatility reduces barriers to entry, accelerating the maritime industry's shift toward environment-friendly fuel alternatives. Given the international reach of the maritime sector, the demand for universally applicable sustainable fuel solutions is crucial, and e-methanol precisely fulfills this need. It holds the potential to transform the global maritime sector, effectively addressing both local and worldwide environmental challenges.
- The maritime shipping industry is actively pursuing decarbonization, with major players such as Amazon and Ikea committing to carbon-neutral fuels. Green methanol, categorized as bio-methanol and e-methanol, is gaining prominence as a low-carbon shipping fuel, notably favored by leading container lines. Bio-methanol involves renewable feedstocks, while e-methanol is synthesized using green hydrogen and captured carbon dioxide. Policy incentives, such as the European Union Emission Trading System (EU ETS) and FuelEU regulations, may drive adoption. However, challenges include the need for substantial capacity growth and distribution hurdles, as major production centers are distant from key bunkering ports, necessitating a shipping infrastructure overhaul to enable the widespread use of green methanol.
How can this report add value to an organization?
Product/Innovation Strategy: The product segment helps the reader understand the different applications of Europe methanol production, storage, and transportation market. The market is poised for significant expansion with ongoing technological advancements, increased investments, and growing awareness of the use of methanol.
Growth/Marketing Strategy: The Europe methanol production, storage, and transportation market has been growing at a rapid pace. The market offers enormous opportunities for existing and emerging market players. Some of the strategies covered in this segment are mergers and acquisitions, product launches, partnerships and collaborations, business expansions, and investments. The strategies preferred by companies to maintain and strengthen their market position primarily include partnerships and collaborations.
Research Methodology
Market Estimation and Forecast
This research study involves the usage of extensive secondary sources, such as certified publications, articles from recognized authors, white papers, annual reports of companies, directories, and major databases to collect useful and effective information for an extensive, technical, market-oriented, and commercial study of the Europe methanol production, storage, and transportation market.
The process of market engineering involves the calculation of the market statistics, market size estimation, market forecast, market crackdown, and data triangulation (the methodology for such quantitative data processes is explained in further sections). The primary research study has been undertaken to gather information and validate the market numbers for segmentation types and industry trends of the key players in the market.
Primary Research
The primary sources involve industry experts from the Europe methanol production, storage, and transportation market and various stakeholders in the ecosystem. Respondents such as CEOs, vice presidents, marketing directors, and technology and innovation directors have been interviewed to obtain and verify both qualitative and quantitative aspects of this research study.
The key data points taken from primary sources include:
- validation and triangulation of all the numbers and graphs
- validation of reports segmentation and key qualitative findings
- understanding the competitive landscape
- validation of the numbers of various markets for market type
- percentage split of individual markets for geographical analysis
Secondary Research
This research study involves the usage of extensive secondary research, directories, company websites, and annual reports. It also makes use of databases, such as Hoovers, Bloomberg, Businessweek, and Factiva, to collect useful and effective information for an extensive, technical, market-oriented, and commercial study of the global market. In addition to the aforementioned data sources, the study has been undertaken with the help of other data sources and websites, such as GFI and Delft University of Technology.
Secondary research was done in order to obtain crucial information about the industry's value chain, revenue models, the market's monetary chain, the total pool of key players, and the current and potential use cases and applications.
The key data points taken from secondary research include:
- segmentations and percentage shares
- data for market value
- key industry trends of the top players of the market
- qualitative insights into various aspects of the market, key trends, and emerging areas of innovation
- quantitative data for mathematical and statistical calculations
Table of Contents
Executive Summary
Scope and Definition
1 Markets
- 1.1 Trends: Current and Future Impact Assessment
- 1.1.1 Growing Order Book of Newbuilds for Methanol-Fueled Ships and Retrofits
- 1.1.2 Growing Emphasis on Clean-Burning Fuels
- 1.2 Supply Chain Overview
- 1.2.1 Value Chain Analysis
- 1.2.2 Pricing Forecast
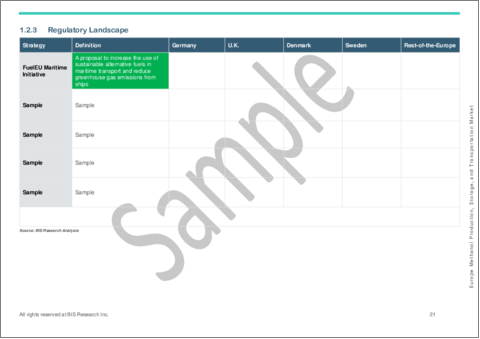
- 1.2.3 Regulatory Landscape
- 1.3 Stakeholder Analysis
- 1.4 Market Dynamics Overview
- 1.4.1 Market Driver
- 1.4.1.1 Increased Government Activities toward Low-Carbon Infrastructure
- 1.4.1.2 Major Investments in Green Methanol Production
- 1.4.2 Market Restraint
- 1.4.2.1 Toxicity, Density, and Flammable Potential of Methanol
- 1.4.3 Market Opportunity
- 1.4.3.1 Adoption of E-Methanol as a Shipping Fuel
- 1.4.3.2 Strategic Partnerships and Collaborations
- 1.4.1 Market Driver
2 Europe Methanol Production, Storage and Transportation Market by Products
- 2.1 Europe Methanol Production, Storage, and Transportation Market (by Production Type)
- 2.1.1 Green Methanol Production
- 2.1.1.1 European Production Volume, Current and Future Scenarios, Thousand Tons, 2022-2033
- 2.1.1.2 Key Producers and Production Capacities
- 2.1.1.3 Supply Chain Analysis
- 2.1.2 Conventional Methanol Production
- 2.1.2.1 European Production Volume, Current and Future Scenarios, Thousand Tons, 2022-2033
- 2.1.2.2 Supply Chain Analysis
- 2.1.1 Green Methanol Production
3 Europe Methanol Production, Storage, and Transportation Market (by Country)
- 3.1 Germany
- 3.1.1 Methanol Production Volumes (2022-2033)
- 3.1.1.1 Green Methanol
- 3.1.1.2 Conventional Methanol
- 3.1.2 Key Producers and Production Capacities
- 3.1.3 Supply and Storage Service Providers
- 3.1.3.1 Nearest Port Locations
- 3.1.3.2 Supply Chain Analysis
- 3.1.3.3 Supply Modes
- 3.1.1 Methanol Production Volumes (2022-2033)
- 3.2 Netherlands
- 3.2.1 Methanol Production Volumes (2022-2033)
- 3.2.1.1 Green Methanol
- 3.2.1.2 Conventional Methanol
- 3.2.2 Key Producers and Production Capacities
- 3.2.3 Supply and Storage Service Providers
- 3.2.3.1 Nearest Port Locations
- 3.2.3.2 Supply Chain Analysis
- 3.2.3.3 Supply Modes
- 3.2.1 Methanol Production Volumes (2022-2033)
- 3.3 U.K.
- 3.3.1 Methanol Production Volumes (2022-2033)
- 3.3.1.1 Green Methanol
- 3.3.1.2 Conventional Methanol
- 3.3.2 Supply and Storage Service Providers
- 3.3.2.1 Nearest Port Locations
- 3.3.2.2 Supply Chain Analysis
- 3.3.2.3 Supply Modes
- 3.3.1 Methanol Production Volumes (2022-2033)
- 3.4 Spain
- 3.4.1 Methanol Production Volumes (2022-2033)
- 3.4.1.1 Green Methanol
- 3.4.1.2 Conventional Methanol
- 3.4.2 Key Producers and Production Capacities
- 3.4.3 Supply and Storage Service Providers
- 3.4.3.1 Nearest Port Locations
- 3.4.3.2 Supply Chain Analysis
- 3.4.3.3 Supply Modes
- 3.4.1 Methanol Production Volumes (2022-2033)
- 3.5 Portugal
- 3.5.1 Methanol Production Volumes (2022-2033)
- 3.5.1.1 Green Methanol
- 3.5.1.2 Conventional Methanol
- 3.5.2 Key Producers and Production Capacities
- 3.5.3 Supply and Storage Service Providers
- 3.5.3.1 Nearest Port Locations
- 3.5.3.2 Supply Chain Analysis
- 3.5.3.3 Supply Modes
- 3.5.1 Methanol Production Volumes (2022-2033)
- 3.6 Denmark
- 3.6.1 Methanol Production Volumes (2022-2033)
- 3.6.1.1 Green Methanol
- 3.6.1.2 Conventional Methanol
- 3.6.2 Key Producers and Production Capacities
- 3.6.3 Supply and Storage Service Providers
- 3.6.3.1 Nearest Port Locations
- 3.6.3.2 Supply Chain Analysis
- 3.6.3.3 Supply Modes
- 3.6.1 Methanol Production Volumes (2022-2033)
- 3.7 Sweden
- 3.7.1 Methanol Production Volumes (2022-2033)
- 3.7.1.1 Green Methanol
- 3.7.1.2 Conventional Methanol
- 3.7.2 Key Producers and Production Capacities
- 3.7.3 Supply and Storage Service Providers
- 3.7.3.1 Nearest Port Locations
- 3.7.3.2 Supply Chain Analysis
- 3.7.3.3 Supply Modes
- 3.7.1 Methanol Production Volumes (2022-2033)
- 3.8 Finland
- 3.8.1 Methanol Production Volumes (2022-2033)
- 3.8.1.1 Green Methanol
- 3.8.1.2 Conventional Methanol
- 3.8.2 Key Producers and Production Capacities
- 3.8.3 Supply and Storage Service Providers
- 3.8.3.1 Nearest Port Locations
- 3.8.3.2 Supply Chain Analysis
- 3.8.3.3 Supply Modes
- 3.8.1 Methanol Production Volumes (2022-2033)
- 3.9 Norway
- 3.9.1 Methanol Production Volumes (2022-2033)
- 3.9.1.1 Green Methanol
- 3.9.1.2 Conventional Methanol
- 3.9.2 Key Producers and Production Capacities
- 3.9.3 Supply and Storage Service Providers
- 3.9.3.1 Nearest Port Locations
- 3.9.3.2 Supply Chain Analysis
- 3.9.3.3 Supply Modes
- 3.9.1 Methanol Production Volumes (2022-2033)
- 3.1 Italy
- 3.10.1 Methanol Production Volumes (2022-2033)
- 3.10.1.1 Green Methanol
- 3.10.1.2 Conventional Methanol
- 3.10.2 Key Producers and Production Capacities
- 3.10.3 Supply and Storage Service Providers
- 3.10.3.1 Nearest Port Locations
- 3.10.3.2 Supply Chain Analysis
- 3.10.3.3 Supply Modes
- 3.10.1 Methanol Production Volumes (2022-2033)
- 3.11 Croatia
- 3.11.1 Methanol Production Volumes (2022-2033)
- 3.11.1.1 Green Methanol
- 3.11.1.2 Conventional Methanol
- 3.11.2 Supply and Storage Service Providers
- 3.11.2.1 Nearest Port Locations
- 3.11.2.2 Supply Chain Analysis
- 3.11.2.3 Supply Modes
- 3.11.1 Methanol Production Volumes (2022-2033)
- 3.12 Iceland
- 3.12.1 Methanol Production Volumes (2022-2033)
- 3.12.1.1 Green Methanol
- 3.12.1.2 Conventional Methanol
- 3.12.2 Key Producers and Production Capacities
- 3.12.3 Supply and Storage Service Providers
- 3.12.3.1 Supply Chain Analysis
- 3.12.3.2 Supply Modes
- 3.12.1 Methanol Production Volumes (2022-2033)
- 3.13 Rest-of-Europe
- 3.13.1 Methanol Production Volumes (2022-2033)
- 3.13.1.1 Green Methanol
- 3.13.1.2 Conventional Methanol
- 3.13.2 Key Producers and Production Capacities
- 3.13.3 Supply and Storage Service Providers
- 3.13.3.1 Nearest Port Locations
- 3.13.3.2 Supply Chain Analysis
- 3.13.3.3 Supply Modes
- 3.13.1 Methanol Production Volumes (2022-2033)
4 Research Methodology
- 4.1 Data Sources
- 4.1.1 Primary Data Sources
- 4.1.2 Secondary Data Sources
- 4.1.3 Data Triangulation
- 4.2 Market Estimation and Forecast
