|
|
市場調査レポート
商品コード
1430513
アジア太平洋の低炭素アルミニウム市場:分析と予測(2022年~2031年)Asia-Pacific Low Carbon Aluminum Market: Analysis and Forecast, 2022-2031 |
||||||
|
|||||||
カスタマイズ可能
|
|||||||

| アジア太平洋の低炭素アルミニウム市場:分析と予測(2022年~2031年) |
|
出版日: 2024年02月22日
発行: BIS Research
ページ情報: 英文 96 Pages
納期: 1~5営業日
|

全表示
- 概要
- 図表
- 目次
| 主要市場統計 | |
|---|---|
| 予測期間 | 2022年~2031年 |
| 2022年評価 | 161億9,000万米ドル |
| 2031年予測 | 224億6,000万米ドル |
| CAGR | 3.7% |
アジア太平洋の低炭素アルミニウムの市場規模(中国を除く)は、2022年の161億9,000万米ドルから2031年には224億6,000万米ドルに達し、予測期間の2022年~2031年年のCAGRは3.7%になると予測されています。
低炭素アルミニウムの需要増大は、軽量素材を利用する電気自動車の人気の高まりに後押しされています。様々な分野の中でも、自動車産業は脱炭素化への取り組みが著しく、低炭素アルミニウムの普及につながっています。政府の規制は、低炭素アルミニウムの使用をさらに奨励し、自動車の軽量化に役立つため、燃費効率が向上します。さらに、低炭素アルミニウムはCO2排出量の削減にも貢献するため、自動車用途では環境に優しい選択肢となっています。
アジア太平洋の低炭素アルミニウム市場は、同地域における電気自動車(EV)の普及が大きな原動力となって力強い成長を遂げています。EVメーカーは、車両の効率と航続距離を向上させるため、低炭素アルミニウムのような軽量素材を優先しています。特に自動車産業はこの動向の最前線にあり、脱炭素化への取り組みに注力し、低炭素アルミニウムの大幅な普及を目の当たりにしています。二酸化炭素排出量の削減を目的とした政府の取り組みや規制は、環境に優しい材料の使用を奨励することで市場の成長をさらに後押ししています。さらに、APAC地域の急速な工業化とインフラ整備は、建設・製造分野での低炭素アルミニウムの需要増加に寄与しています。これらの要因から、APACの低炭素アルミニウム市場は、様々な産業において持続可能な成長と革新のための有望な機会を提供しています。
当レポートでは、アジア太平洋の低炭素アルミニウム市場について調査し、市場の概要とともに、エンドユーザー別、由来別、国別の動向、および市場に参入する企業のプロファイルなどを提供しています。
目次
エグゼクティブサマリー
調査範囲
第1章 市場
- 業界の展望
- 動向:現在と未来
- サプライチェーン分析
- 低炭素アルミニウム市場のエコシステム
- COVID-19が低炭素アルミニウム市場に与える影響
- ビジネスダイナミクス
- スタートアップの情勢
第2章 地域
- 中国
- 市場
- 用途
- 製品
- アジア太平洋と日本
- 市場
- 用途
- 製品
第3章 市場-競合ベンチマーキングと企業プロファイル
- 競合ベンチマーキング
- 競合マトリックス
- 主要企業の生産源別製品マトリックス
- 主要企業の市場シェア分析、2021年
- 企業プロファイル
- Vedanta Aluminum and Power
- China Hongqiao Group Limited
- Capral Limited
- South32
- PT Indonesia Asahan Aluminium
第4章 調査手法
List of Figures
- Figure 1: Asia-Pacific Low-Carbon Aluminum Market, $Billion, 2021, 2022, and 2031
- Figure 2: Asia-Pacific Low-Carbon Aluminum Market (by End User), $Billion, 2021 and 2031
- Figure 3: Asia-Pacific Low-Carbon Aluminum Market (by Source of Production), $Billion, 2021 and 2031
- Figure 4: Asia-Pacific Low-Carbon Aluminum Market (by Product), $Billion, 2021 and 2031
- Figure 5: Low-Carbon Aluminum Market (by Region), $Billion, 2021 and 2031
- Figure 6: Share of Renewable vs. Conventional Energy Sources with Private Participation in Emerging Markets and Developing Economies (EMDEs), by Projects
- Figure 7: Share of Renewable vs. Conventional Energy Sources with Private Participation in Emerging Markets and Developing Economies (EMDEs), by Investment
- Figure 8: Supply Chain Analysis of the Low-Carbon Aluminum Market
- Figure 9: Aircraft Deliveries (by Region, Number of Aircraft), 2018-2022
- Figure 10: Automotive Production Units, 2019-2021
- Figure 11: Embodied Carbon (Carbon Footprint) per Kg of Primary Aluminium Ingot
- Figure 12: Research Methodology
- Figure 13: Top-Down and Bottom-Up Approach
- Figure 14: Low-Carbon Aluminum Market: Influencing Factors
- Figure 15: Assumptions and Limitations
List of Tables
- Table 1: Consortiums and Associations
- Table 2: Regulatory/Certification Bodies
- Table 3: Key Product Developments
- Table 4: Key Market Developments (2018-2021)
- Table 5: Key Partnerships and Joint Ventures
- Table 6: Low-Carbon Aluminum Market (by Region), Kilotons, 2021-2031
- Table 7: Low-Carbon Aluminum Market (by Region), $Billion, 2021-2031
- Table 8: China Low-Carbon Aluminum Market (by End User), Kilotons, 2021-2031
- Table 9: China Low-Carbon Aluminum Market (by End User), $Billion, 2021-2031
- Table 10: China Low-Carbon Aluminum Market (by Source of Production), Kilotons, 2021-2031
- Table 11: China Low-Carbon Aluminum Market (by Source of Production), $Billion, 2021-2031
- Table 12: China Low-Carbon Aluminum Market (by Product), Kilotons, 2021-2031
- Table 13: China Low-Carbon Aluminum Market (by Product), $Billion, 2021-2031
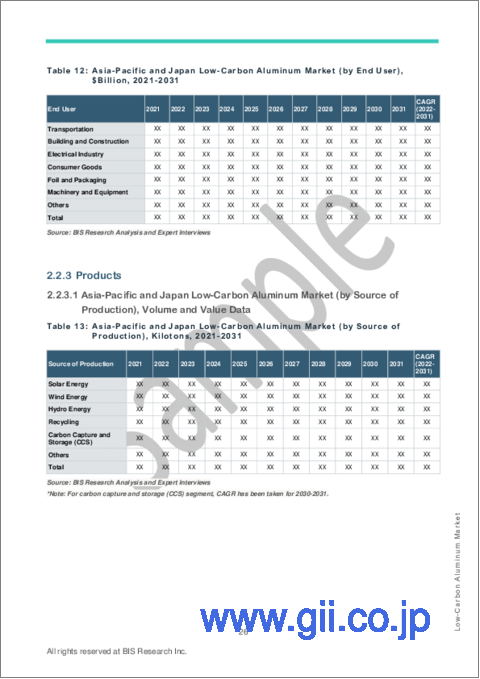
- Table 14: Asia-Pacific and Japan Low-Carbon Aluminum Market (by End User), Kilotons, 2021-2031
- Table 15: Asia-Pacific and Japan Low-Carbon Aluminum Market (by End User), $Billion, 2021-2031
- Table 16: Asia-Pacific and Japan Low-Carbon Aluminum Market (by Source of Production), Kilotons, 2021-2031
- Table 17: Asia-Pacific and Japan Low-Carbon Aluminum Market (by Source of Production), $Billion, 2021-2031
- Table 18: Asia-Pacific and Japan Low-Carbon Aluminum Market (by Product), Kilotons, 2021-2031
- Table 19: Asia-Pacific and Japan Low-Carbon Aluminum Market (by Product), $Billion, 2021-2031
- Table 20: Japan Low-Carbon Aluminum Market (by End User), Kilotons, 2021-2031
- Table 21: Japan Low-Carbon Aluminum Market (by End User), $Billion, 2021-2031
- Table 22: Japan Low-Carbon Aluminum Market (by Source of Production), Kilotons, 2021-2031
- Table 23: Japan Low-Carbon Aluminum Market (by Source of Production), $Billion, 2021-2031
- Table 24: Japan Low-Carbon Aluminum Market (by Product), Kilotons, 2021-2031
- Table 25: Japan Low-Carbon Aluminum Market (by Product), $Billion, 2021-2031
- Table 26: South Korea Low-Carbon Aluminum Market (by End User), Kilotons, 2021-2031
- Table 27: South Korea Low-Carbon Aluminum Market (by End User), $Billion, 2021-2031
- Table 28: South Korea Low-Carbon Aluminum Market (by Source of Production), Kilotons, 2021-2031
- Table 29: South Korea Low-Carbon Aluminum Market (by Source of Production), $Billion, 2021-2031
- Table 30: South Korea Low-Carbon Aluminum Market (by Product), Kilotons, 2021-2031
- Table 31: South Korea Low-Carbon Aluminum Market (by Product), $Billion, 2021-2031
- Table 32: India Low-Carbon Aluminum Market (by End User), Kilotons, 2021-2031
- Table 33: India Low-Carbon Aluminum Market (by End User), $Billion, 2021-2031
- Table 34: India Low-Carbon Aluminum Market (by Source of Production), Kilotons, 2021-2031
- Table 35: India Low-Carbon Aluminum Market (by Source of Production), $Billion, 2021-2031
- Table 36: India Low-Carbon Aluminum Market (by Product), Kilotons, 2021-2031
- Table 37: India Low-Carbon Aluminum Market (by Product), $Billion, 2021-2031
- Table 38: ASEAN Low-Carbon Aluminum Market (by End User), Kilotons, 2021-2031
- Table 39: ASEAN Low-Carbon Aluminum Market (by End User), $Billion, 2021-2031
- Table 40: ASEAN Low-Carbon Aluminum Market (by Source of Production), Kilotons, 2021-2031
- Table 41: ASEAN Low-Carbon Aluminum Market (by Source of Production), $Billion, 2021-2031
- Table 42: ASEAN Low-Carbon Aluminum Market (by Product), Kilotons, 2021-2031
- Table 43: ASEAN Low-Carbon Aluminum Market (by Product), $Billion, 2021-2031
- Table 44: Rest-of-Asia-Pacific and Japan Low-Carbon Aluminum Market (by End User), Kilotons, 2021-2031
- Table 45: Rest-of-Asia-Pacific and Japan Low-Carbon Aluminum Market (by End User), $Billion, 2021-2031
- Table 46: Rest-of-Asia-Pacific and Japan Low-Carbon Aluminum Market (by Source of Production), Kilotons, 2021-2031
- Table 47: Rest-of-Asia-Pacific and Japan Low-Carbon Aluminum Market (by Source of Production), $Billion, 2021-2031
- Table 48: Rest-of-Asia-Pacific and Japan Low-Carbon Aluminum Market (by Product), Kilotons, 2021-2031
- Table 49: Rest-of-Asia-Pacific and Japan Low-Carbon Aluminum Market (by Product), $Billion, 2021-2031
- Table 50: Product Matrix of Key Companies, By Source of Production
- Table 51: Market Shares of Key Companies, 2021
The Asia-Pacific Low Carbon Aluminum Market (excluding China) Expected to Reach $22.46 Billion by 2031
Introduction to Asia-Pacific Low-Carbon Aluminum Market
| KEY MARKET STATISTICS | |
|---|---|
| Forecast Period | 2022 - 2031 |
| 2022 Evaluation | $16.19 Billion |
| 2031 Forecast | $22.46 Billion |
| CAGR | 3.7% |
The Asia-Pacific low-carbon aluminum market (excluding China) is projected to reach $22.46 billion by 2031 from $16.19 billion in 2022, growing at a CAGR of 3.7% during the forecast period 2022-2031. The growing demand for low-carbon aluminum is being driven by the rising popularity of electric vehicles, which utilize lightweight materials. Among various sectors, the automotive industry stands out for its significant efforts toward decarbonization, leading to widespread adoption of low-carbon aluminum. Government regulations further incentivize the use of low-carbon aluminum, as it aids in reducing vehicle weight, thereby enhancing fuel efficiency. Additionally, low-carbon aluminum contributes to reducing CO2 emissions, making it an environmentally friendly choice for automotive applications.
Market Introduction
The Asia-Pacific (APAC) low-carbon aluminum market is experiencing robust growth, largely driven by the increasing adoption of electric vehicles (EVs) in the region. EV manufacturers prioritize lightweight materials like low-carbon aluminum to improve vehicle efficiency and range. The automotive industry, in particular, is at the forefront of this trend, focusing on decarbonization efforts and witnessing significant uptake of low-carbon aluminum. Government initiatives and regulations aimed at reducing carbon emissions further bolster market growth by incentivizing the use of environmentally friendly materials. Moreover, the APAC region's rapid industrialization and infrastructure development contribute to the rising demand for low-carbon aluminum in construction and manufacturing sectors. With these factors in play, the APAC low-carbon aluminum market presents promising opportunities for sustainable growth and innovation across various industries.
Market Segmentation
Segmentation 1: by End User
- Transportation
- Building and Construction
- Electrical Industry
- Consumer Goods
- Foil and Packaging
- Machinery and Equipment
- Others
Segmentation 2: by Source of Production
- Solar Energy
- Wind Energy
- Hydro Energy
- Recycling
- Carbon Capture and Storage (CCS)
- Others
Segmentation 3: by Product
- Flat-Rolled
- Castings
- Extrusion
- Forgings
- Rod and Bar
- Others
Segmentation 4: by Country
- Japan
- India
- South Korea
- ASEAN
- Rest-of-Asia-Pacific and Japan
How can this report add value to an organization?
Product/Innovation Strategy: The product segment helps the reader understand the different sources of production and products involved in the low-carbon aluminum market. The source of production segment has been segmented into solar energy, wind energy, hydro energy, recycling, carbon capture and storage (CCS), and others. The product segment has been segmented into flat-rolled, castings, extrusion, forgings, rod and bar, and others. Moreover, the study provides the reader with a detailed understanding of the low-carbon aluminum market based on end users, including transportation, building and construction, the electrical industry, consumer goods, foil and packaging, machinery and equipment, and others. The increasing adoption of low-carbon aluminum in manufacturing components in sustainable technologies is expected to fuel the growth of the market.
Growth/Marketing Strategy: The APAC low-carbon aluminum market has seen major development by key players operating in the market, such as business expansions, partnerships, collaborations, mergers and acquisitions, and joint ventures. The favored strategy for the companies has been business expansions to strengthen their position in the low-carbon aluminum market.
Competitive Strategy: Key players in the APAC low-carbon aluminum market analyzed and profiled in the study involve low-carbon aluminum producers and the overall ecosystem. Moreover, a detailed competitive benchmarking of the players operating in the low-carbon aluminum market has been done to help the reader understand how players stack against each other, presenting a clear market landscape. Additionally, comprehensive competitive strategies such as partnerships, agreements, acquisitions, and collaborations will aid the reader in understanding the untapped revenue pockets in the market.
Key Market Players and Competition Synopsis
The companies that are profiled have been selected based on thorough secondary research, which includes analyzing company coverage, product portfolio, market penetration, and insights gathered from primary experts.
Some prominent names established in this market are:
- Vedanta Aluminum and Power
- Capral Limited
- South32
- Indonesia Asahan Aluminium
Table of Contents
Executive Summary
Scope of the Study
1 Markets
- 1.1 Industry Outlook
- 1.1.1 Trends: Current and Future
- 1.1.1.1 Increasing Investments in Low-Carbon Aluminum
- 1.1.1.2 Government Activities toward the Establishment of Low-carbon Infrastructure
- 1.1.2 Supply Chain Analysis
- 1.1.3 Ecosystem of Low-Carbon Aluminum Market
- 1.1.3.1 Consortiums and Associations
- 1.1.3.2 Regulatory/Certification Bodies
- 1.1.3.3 Government Programs
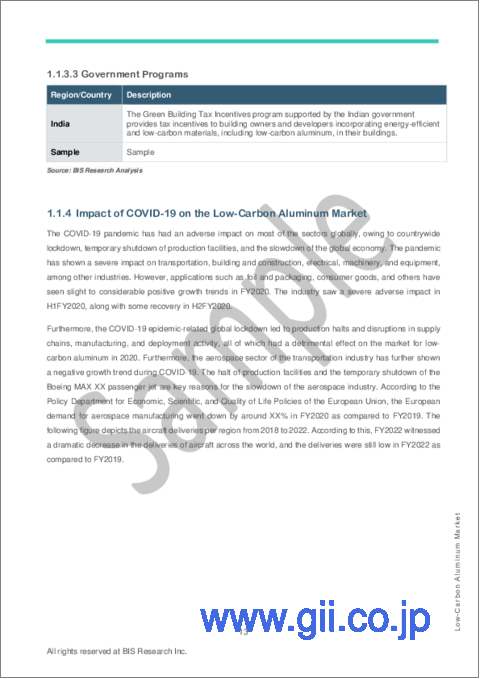
- 1.1.4 Impact of COVID-19 on the Low-Carbon Aluminum Market
- 1.1.1 Trends: Current and Future
- 1.2 Business Dynamics
- 1.2.1 Business Drivers
- 1.2.1.1 Increasing Attention of Governments toward Decarbonization of Core Contributing Commodities
- 1.2.1.2 Growing Research and Development Activities to Achieve Near Zero Emissions
- 1.2.2 Business Challenges
- 1.2.2.1 Lower Recycling Rates for Aluminum in Various Industries
- 1.2.2.2 Volatile Low-Carbon Aluminum Prices
- 1.2.3 Business Strategies
- 1.2.3.1 Product Developments
- 1.2.3.2 Market Developments
- 1.2.4 Corporate Strategies
- 1.2.4.1 Partnerships and Joint Ventures
- 1.2.5 Business Opportunities
- 1.2.5.1 Low-Carbon Aluminum in Niche Segments such as Ultra-Low-CO2 Grades
- 1.2.5.2 Climate Mitigation Initiatives to Increase Demand for Sustainably Sourced Aluminum
- 1.2.1 Business Drivers
- 1.3 Start-Up Landscape
- 1.3.1 Key Start-Ups in the Ecosystem
2 Regions
- 2.1 China
- 2.1.1 Market
- 2.1.1.1 Buyer Attributes
- 2.1.1.2 Key Producers and Suppliers in China
- 2.1.1.3 Regulatory Landscape
- 2.1.1.4 Business Drivers
- 2.1.1.5 Business Challenges
- 2.1.2 Applications
- 2.1.2.1 China Low-Carbon Aluminum Market (by End User), Volume and Value Data
- 2.1.3 Products
- 2.1.3.1 China Low-Carbon Aluminum Market (by Source of Production), Volume and Value Data
- 2.1.3.2 China Low-Carbon Aluminum Market (by Product), Volume and Value Data
- 2.1.1 Market
- 2.2 Asia-Pacific and Japan
- 2.2.1 Markets
- 2.2.1.1 Key Producers and Suppliers in Asia-Pacific and Japan
- 2.2.1.2 Business Drivers
- 2.2.1.3 Business Challenges
- 2.2.2 Applications
- 2.2.2.1 Asia-Pacific and Japan Low-Carbon Aluminum Market (by End User), Volume and Value Data
- 2.2.3 Products
- 2.2.3.1 Asia-Pacific and Japan Low-Carbon Aluminum Market (by Source of Production), Volume and Value Data
- 2.2.3.2 Asia-Pacific and Japan Low-Carbon Aluminum Market (by Product), Volume and Value Data
- 2.2.3.3 Japan
- 2.2.3.3.1 Markets
- 2.2.3.3.1.1 Buyer Attributes
- 2.2.3.3.1.2 Key Producers and Suppliers in Japan
- 2.2.3.3.1.3 Regulatory Landscape
- 2.2.3.3.1.4 Business Drivers
- 2.2.3.3.1.5 Business Challenges
- 2.2.3.3.2 Applications
- 2.2.3.3.2.1 Japan Low-Carbon Aluminum Market (by End User), Volume and Value Data
- 2.2.3.3.3 Products
- 2.2.3.3.3.1 Japan Low-Carbon Aluminum Market (by Source of Production), Volume and Value Data
- 2.2.3.3.3.2 Japan Low-Carbon Aluminum Market (by Product), Volume and Value Data
- 2.2.3.3.1 Markets
- 2.2.3.4 South Korea
- 2.2.3.4.1 Markets
- 2.2.3.4.1.1 Buyer Attributes
- 2.2.3.4.1.2 Key Producers and Suppliers in South Korea
- 2.2.3.4.1.3 Regulatory Landscape
- 2.2.3.4.1.4 Business Drivers
- 2.2.3.4.1.5 Business Challenges
- 2.2.3.4.2 Applications
- 2.2.3.4.2.1 South Korea Low-Carbon Aluminum Market (by End User), Volume and Value Data
- 2.2.3.4.3 Products
- 2.2.3.4.3.1 South Korea Low-Carbon Aluminum Market (by Source of Production), Volume and Value Data
- 2.2.3.4.3.2 South Korea Low-Carbon Aluminum Market (by Product), Volume and Value Data
- 2.2.3.4.1 Markets
- 2.2.3.5 India
- 2.2.3.5.1 Markets
- 2.2.3.5.1.1 Buyer Attributes
- 2.2.3.5.1.2 Key Producers and Suppliers in India
- 2.2.3.5.1.3 Regulatory Landscape
- 2.2.3.5.1.4 Business Drivers
- 2.2.3.5.1.5 Business Challenges
- 2.2.3.5.2 Applications
- 2.2.3.5.2.1 India Low-Carbon Aluminum Market (by End User), Volume and Value Data
- 2.2.3.5.3 Products
- 2.2.3.5.3.1 India Low-Carbon Aluminum Market (by Source of Production), Volume and Value Data
- 2.2.3.5.3.2 India Low-Carbon Aluminum Market (by Product), Volume and Value Data
- 2.2.3.5.1 Markets
- 2.2.3.6 ASEAN
- 2.2.3.6.1 Markets
- 2.2.3.6.1.1 Buyer Attributes
- 2.2.3.6.1.2 Key Producers and Suppliers in ASEAN
- 2.2.3.6.1.3 Business Drivers
- 2.2.3.6.1.4 Business Challenges
- 2.2.3.6.2 Applications
- 2.2.3.6.2.1 ASEAN Low-Carbon Aluminum Market (by End User), Volume and Value Data
- 2.2.3.6.3 Products
- 2.2.3.6.3.1 ASEAN Low-Carbon Aluminum Market (by Source of Production), Volume and Value Data
- 2.2.3.6.3.2 ASEAN Low-Carbon Aluminum Market (by Product), Volume and Value Data
- 2.2.3.6.1 Markets
- 2.2.3.7 Rest-of-Asia-Pacific and Japan
- 2.2.3.7.1 Markets
- 2.2.3.7.1.1 Buyer Attributes
- 2.2.3.7.1.2 Key Producers and Suppliers in the Rest-of-Asia-Pacific and Japan
- 2.2.3.7.1.3 Business Drivers
- 2.2.3.7.1.4 Business Challenges
- 2.2.3.7.2 Applications
- 2.2.3.7.2.1 Rest-of-Asia-Pacific and Japan Low-Carbon Aluminum Market (by End User), Volume and Value Data
- 2.2.3.7.3 Products
- 2.2.3.7.3.1 Rest-of-Asia-Pacific and Japan Low-Carbon Aluminum Market (by Source of Production), Volume and Value Data
- 2.2.3.7.3.2 Rest-of-Asia-Pacific and Japan Low-Carbon Aluminum Market (by Product), Volume and Value Data
- 2.2.3.7.1 Markets
- 2.2.1 Markets
3 Markets - Competitive Benchmarking and Company Profiles
- 3.1 Competitive Benchmarking
- 3.1.1 Competitive Position Matrix
- 3.1.2 Product Matrix of Key Companies, By Source of Production
- 3.1.3 Market Share Analysis of Key Companies, 2021
- 3.2 Company Profiles
- 3.2.1 Vedanta Aluminum and Power
- 3.2.1.1 Company Overview
- 3.2.1.1.1 Role of Vedanta Aluminum and Power in the Low-Carbon Aluminum Market
- 3.2.1.1.2 Production Sites
- 3.2.1.1.3 Product Portfolio
- 3.2.1.2 Business Strategies
- 3.2.1.2.1 Market Developments and Product Developments
- 3.2.1.3 Analyst View
- 3.2.1.1 Company Overview
- 3.2.2 China Hongqiao Group Limited
- 3.2.2.1 Company Overview
- 3.2.2.1.1 Role of China Hongqiao Group Limited in the Low-Carbon Aluminum Market
- 3.2.2.1.2 Production Sites
- 3.2.2.1.3 Product Portfolio
- 3.2.2.2 Business Strategies
- 3.2.2.2.1 Product Developments and Market Developments
- 3.2.2.3 Corporate Strategies
- 3.2.2.3.1 Partnerships, Collaborations, Agreements, Investments, and Contracts
- 3.2.2.4 R&D Analysis
- 3.2.2.5 Analyst View
- 3.2.2.1 Company Overview
- 3.2.3 Capral Limited
- 3.2.3.1 Company Overview
- 3.2.3.1.1 Role of Capral Limited in the Low-Carbon Aluminum Market
- 3.2.3.1.2 Production Sites
- 3.2.3.1.3 Product Portfolio
- 3.2.3.2 Business Strategies
- 3.2.3.2.1 Product Developments and Market Developments
- 3.2.3.3 Corporate Strategies
- 3.2.3.3.1 Partnerships, Collaborations, Agreements, Investments, and Contracts
- 3.2.3.4 Analyst View
- 3.2.3.1 Company Overview
- 3.2.4 South32
- 3.2.4.1 Company Overview
- 3.2.4.1.1 Role of South32 in the Low-Carbon Aluminum Market
- 3.2.4.1.2 Production Sites
- 3.2.4.1.3 Product Portfolio
- 3.2.4.2 Analyst View
- 3.2.4.1 Company Overview
- 3.2.5 PT Indonesia Asahan Aluminium
- 3.2.5.1 Company Overview
- 3.2.5.1.1 Role of PT Indonesia Asahan Aluminium in the Low-Carbon Aluminum Market
- 3.2.5.1.2 Production Sites
- 3.2.5.1.3 Product Portfolio
- 3.2.5.2 Analyst View
- 3.2.5.1 Company Overview
- 3.2.1 Vedanta Aluminum and Power
4 Research Methodology
- 4.1 Primary Data Sources
- 4.2 BIS Data Sources
- 4.3 Assumptions and Limitations

