|
|
市場調査レポート
商品コード
1403556
欧州のスマート作物モニタリング市場:分析・予測 (2023-2028年)Europe Smart Crop Monitoring Market: Analysis and Forecast, 2023-2028 |
||||||
カスタマイズ可能
|
|||||||


| 欧州のスマート作物モニタリング市場:分析・予測 (2023-2028年) |
|
出版日: 2024年01月08日
発行: BIS Research
ページ情報: 英文 67 Pages
納期: 1~5営業日
|

- 全表示
- 概要
- 図表
- 目次
英国を除く欧州のスマート作物モニタリングの市場規模は、2023年の10億4,000万米ドルから、予測期間中は16.18%のCAGRで推移し、2028年には22億米ドルの規模に成長すると予測されています。
農業における最適な作物収量と効果的な資源利用に対する需要の高まりが、作物モニタリング市場の拡大に拍車をかけると予測されています。さらに、AI、機械学習、リモートセンシングなどの技術開発も、作物モニタリングの成長をさらに促進すると予測されています。
| 主要市場統計 | |
|---|---|
| 予測期間 | 2023-2028年 |
| 2023年評価 | 10億4,000万米ドル |
| 2028年予測 | 22億米ドル |
| CAGR | 16.18% |
スマート作物モニタリングにより作物の健康状態をモニタリングすることで、農家はより多くの情報に基づいた決断を下し、生産性を高め、資源を節約し、持続可能な農法を実施することができます。
スマート作物スカウティングやスマート散布は、投入資材の最適化と作物収量の増加のために非常に有望です。農家は、農薬や除草剤をより正確に散布することで、効率的かつ効果的に使用し、無駄を省き、さらには作物の収量を向上させることができます。
こうした問題への対応として、スマート農業モニタリングの需要が高まると予測されます。これらの技術は、作物の健康状態や土壌の状態に関するリアルタイムのデータを農家に提供することができるため、農家は投入資材をより正確に、適切なタイミングで散布することができます。これにより、無駄を省くと同時に、作物の健康と生産量を向上させることができます。
当レポートでは、欧州のスマート作物モニタリングの市場を調査し、市場の背景・概要、市場成長への各種影響因子の分析、エコシステムと進行中のプログラム、市場規模の推移・予測、各種区分・主要国別の詳細分析、競合情勢、主要企業の分析などをまとめています。
市場セグメンテーション:
セグメンテーション1:用途別
- 病気と害虫の検出
- 栄養管理
- 雑草管理
- 作物保険
- その他
セグメンテーション2:製品別
- センサー技術
- ドローン
- ロボット
- ハンドヘルド機器
- ソフトウェア・モバイルアプリケーション
セグメンテーション3:国別
- ドイツ
- フランス
- イタリア
- スペイン
- オランダ
- ベルギー
- スイス
- その他
目次
調査範囲
エグゼクティブサマリー
第1章 市場
- 業界の展望
- エコシステム/進行中のプログラム
- 事業力学
- 事業促進要因
- 事業上の課題
- 事業機会
- 現在の動向
- 市場戦略と展開
第2章 地域
- 欧州
- 欧州(国別)
- 英国
第3章 市場:競合ベンチマーキング・企業プロファイル
- 競合ベンチマーキング
- 競合マトリックス
- 市場シェア分析
- 企業プロファイル
- CNH Industrial N.V.
- AGRIVI
- Robert Bosch GmbH
- Airbus
- Small Robot Company
第4章 調査手法
List of Figures
- Figure 1: Factors Affecting Global Crop Production
- Figure 2: Smart Monitoring Market, $Billion, 2022-2028
- Figure 3: Market Dynamics for Smart Crop Monitoring Market
- Figure 4: Smart Crop Monitoring Market (by Application), $Million, 2022-2028
- Figure 5: Smart Crop Monitoring Market (by Product), $Million, 2022-2028
- Figure 6: Smart Crop Monitoring Market (by Region), 2022
- Figure 7: Plant Nutrient Consumption in U.S., 1960-2015
- Figure 8: EU Farm and Farmland by Land Size Class, 2018
- Figure 9: Cyber Attack Incidents with $1Million+ Reported Losses, 2009-2019
- Figure 10: Advantages of AI and ML in Smart Crop Monitoring
- Figure 11: Advantages of MTaaS
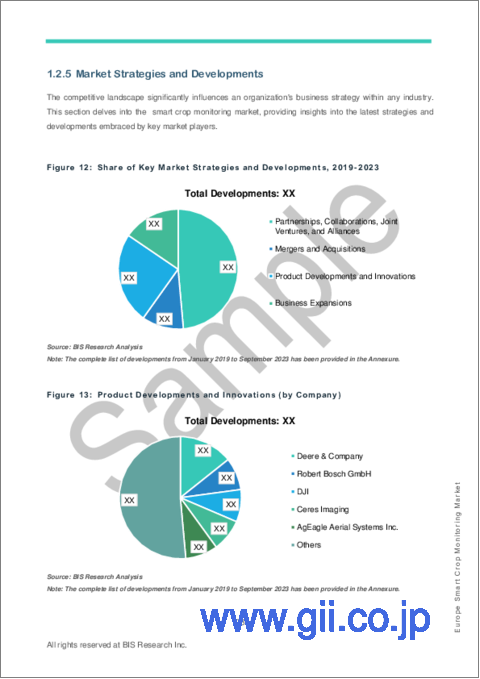
- Figure 12: Share of Key Market Strategies and Developments, 2019-2023
- Figure 13: Product Developments and Innovations (by Company)
- Figure 14: Partnerships, Collaborations, Joint Ventures, and Alliances
- Figure 15: Business Expansions
- Figure 16: Mergers and Acquisitions
- Figure 17: Competitive Market: High and Low Matrix for Smart Crop Monitoring Market
- Figure 18: Market Share Analysis of Smart Crop Monitoring Companies, 2022
- Figure 19: CNH Industrial N.V.: Product and Customer Portfolio Analysis
- Figure 20: AGRIVI: Product and Customer Portfolio Analysis
- Figure 21: Robert Bosch GmbH: Product and Customer Portfolio Analysis
- Figure 22: Airbus: Product and Customer Portfolio Analysis
- Figure 23: Small Robot Company: Product and Customer Portfolio Analysis
- Figure 24: Data Triangulation
- Figure 25: Top-Down and Bottom-Up Approach
- Figure 26: Assumptions and Limitations
List of Tables
- Table 1: Consortiums and Associations
- Table 2: Key Regulatory Bodies on the Smart Crop Monitoring Market
- Table 3: Government Initiatives and Impacts
“The Europe Smart Crop Monitoring Market (excluding U.K.) Expected to Reach $2.20 Billion by 2028.”
Introduction to Europe Smart Crop Monitoring Market
The Europe smart crop monitoring market (excluding U.K.) was valued at $1.04 billion in 2023, and it is expected to grow with a CAGR of 16.18% during the forecast period 2023-2028 to reach $2.20 billion by 2028. The increasing demand for optimum crop yields and effective resource usage in agriculture is projected to fuel the expansion of the crop monitoring market. Furthermore, developments in technologies such as AI, machine learning, and remote sensing are projected to drive crop monitoring growth even further.
| KEY MARKET STATISTICS | |
|---|---|
| Forecast Period | 2023 - 2028 |
| 2023 Evaluation | $1.04 Billion |
| 2028 Forecast | $2.20 Billion |
| CAGR | 16.18% |
Market Introduction
Smart crop monitoring is the use of advanced technology such as satellite images, drones, sensors, and data analytics to precisely and efficiently monitor and manage agricultural crops. It entails collecting, analyzing, and interpreting data in real time to optimize many aspects of farming such as irrigation, pest management, fertilizer use, and general crop health. Crop health monitoring enables farmers to make more informed decisions, increase productivity, conserve resources, and implement sustainable agricultural methods, resulting in higher yields and lower environmental impact.
Smart crop scouting and spraying have enormous promise for input optimization and increased crop yields. Farmers may ensure that pesticides and herbicides are used efficiently and effectively by spraying them more precisely, avoiding waste and even improving crop yields.
In response to these problems, demand for smart agricultural monitoring is projected to rise. These technologies can offer farmers with real-time data on crop health and soil conditions, allowing them to apply inputs more precisely and at the right moment. This saves waste while simultaneously improving crop health and production.
Market Segmentation:
Segmentation 1: by Application
- Disease and Pest Detection
- Nutrient Management
- Weed Management
- Crop Insurance
- Others
Segmentation 2: by Product
- Sensor Technology
- Drones
- Robots
- Handheld Devices
- Software and Mobile Applications
Segmentation 3: by Country
- Germany
- France
- Italy
- Spain
- Netherlands
- Belgium
- Switzerland
- Rest-of-Europe
How can this report add value to an organization?
Product/Innovation Strategy: In the realm of smart crop monitoring, technological advancements are transforming agricultural landscapes. Smart crop monitoring solutions utilize diverse technologies such as IoT sensors, drones, and data analytics. These tools offer precise insights into crop health, optimizing irrigation, pest management, and harvest times. Innovations such as satellite imaging and remote sensing provide a holistic view of fields, empowering farmers to make informed decisions. The market encompasses a range of solutions, from real-time monitoring platforms to AI-driven predictive analysis, enabling farmers to enhance productivity and reduce resource wastage significantly.
Growth/Marketing Strategy: The Europe smart crop monitoring market has witnessed remarkable growth strategies by key players. Business expansions, collaborations, and partnerships have been pivotal. Companies are venturing into global markets, forging alliances, and engaging in research collaborations to enhance their technological prowess. Collaborative efforts between tech companies and agricultural experts are driving the development of cutting-edge monitoring tools. Additionally, strategic joint ventures are fostering the integration of diverse expertise, amplifying the market presence of these solutions. This collaborative approach is instrumental in developing comprehensive, user-friendly, and efficient smart crop monitoring systems.
Competitive Strategy: In the competitive landscape of smart crop monitoring, manufacturers are diversifying their product portfolios to cover various crops and farming practices. Market segments include soil analysis tools, disease detection systems, and climate analysis solutions. Competitive benchmarking illuminates the strengths of market players, emphasizing their unique offerings and regional strengths. Partnerships with research institutions and agricultural organizations are driving innovation.
Table of Contents
Scope of the Study
Executive Summary
1. Markets
- 1.1. Industry Outlook
- 1.1.1. Ecosystem/Ongoing Programs
- 1.1.1.1. Consortiums and Associations
- 1.1.1.2. Regulatory Bodies
- 1.1.1.3. Government Initiatives and Impacts
- 1.1.1. Ecosystem/Ongoing Programs
- 1.2. Business Dynamics
- 1.2.1. Business Drivers
- 1.2.1.1. Need for Input Optimization
- 1.2.1.2. Growth in Farmland Consolidation
- 1.2.2. Business Challenges
- 1.2.2.1. Cyber and Online Data Security
- 1.2.2.2. Lack of Connectivity and Technical Awareness
- 1.2.3. Business Opportunities
- 1.2.3.1. Focus on Sustainability
- 1.2.3.2. Increase in Number of Cooperative Farming
- 1.2.4. Ongoing Trends
- 1.2.4.1. Integration with AI and ML
- 1.2.4.2. Monitoring Technology-as-a-Service (MTaaS)
- 1.2.5. Market Strategies and Developments
- 1.2.1. Business Drivers
2. Region
- 2.1. Europe
- 2.1.1. Europe (by Country)
- 2.1.1.1. Germany
- 2.1.1.2. France
- 2.1.1.3. Spain
- 2.1.1.4. Italy
- 2.1.1.5. Netherlands
- 2.1.1.6. Switzerland
- 2.1.1.7. Belgium
- 2.1.1.8. Rest-of-Europe
- 2.1.1. Europe (by Country)
- 2.2. U.K.
3. Markets - Competitive Benchmarking & Company Profiles
- 3.1. Competitive Benchmarking
- 3.1.1. Competitive Position Matrix
- 3.1.2. Market Share Analysis
- 3.2. Company Profiles
- 3.2.1. CNH Industrial N.V.
- 3.2.1.1. Company Overview
- 3.2.1.1.1. Product and Customer Portfolio Analysis
- 3.2.1.1. Company Overview
- 3.2.2. AGRIVI
- 3.2.2.1. Company Overview
- 3.2.2.1.1. Product and Customer Portfolio Analysis
- 3.2.2.1. Company Overview
- 3.2.3. Robert Bosch GmbH
- 3.2.3.1. Company Overview
- 3.2.3.1.1. Product and Customer Portfolio Analysis
- 3.2.3.1. Company Overview
- 3.2.4. Airbus
- 3.2.4.1. Company Overview
- 3.2.4.1.1. Product and Customer Portfolio Analysis
- 3.2.4.1. Company Overview
- 3.2.5. Small Robot Company
- 3.2.5.1. Company Overview
- 3.2.5.1.1. Product and Customer Portfolio Analysis
- 3.2.5.1. Company Overview
- 3.2.1. CNH Industrial N.V.
4. Research Methodology
- 4.1. Data Sources
- 4.1.1. Primary Data Sources
- 4.1.2. Secondary Data Sources
- 4.1.3. Data Triangulation
- 4.2. Market Estimation and Forecast
