|
|
市場調査レポート
商品コード
1403554
アジア太平洋のバイオ複合材料市場:分析と予測(2023年~2032年)Asia-Pacific Bio-Composite Materials Market: Analysis and Forecast, 2023-2032 |
||||||
|
|||||||
カスタマイズ可能
|
|||||||

| アジア太平洋のバイオ複合材料市場:分析と予測(2023年~2032年) |
|
出版日: 2024年01月08日
発行: BIS Research
ページ情報: 英文 108 Pages
納期: 1~5営業日
|

全表示
- 概要
- 図表
- 目次
アジア太平洋のバイオ複合材料の市場規模(中国を除く)は、2023年に41億6,000万米ドルと評価されており、今後17.83%のCAGRで拡大し、2032年には182億3,000万米ドルに達すると予測されています。
アジア太平洋のバイオ複合材料市場は、自動車、建設、包装、消費財など様々な産業における環境に優しい生分解性材料に対する意識の高まりと採用が最も重要な要因であり、多くの要因によって成長が見込まれています。
| 主要市場統計 | |
|---|---|
| 予測期間 | 2023年~2032年 |
| 2023年の評価額 | 41億6,000万米ドル |
| 2032年予測 | 182億3,000万米ドル |
| CAGR | 17.83% |
アジア太平洋のバイオ複合材料市場は成長段階にあり、バイオ複合材料を提供する企業が急増しています。天然繊維や木質繊維などのバイオ複合材料における最近の技術進歩や、建設プロジェクトの増加、自動車産業、再生可能エネルギー需要、電子機器・消費財分野などが、バイオ複合材料の世界の採用を促進しています。さらに、環境に優しく持続可能な材料に対する需要の増加により、多くの業界関係者がバイオ複合材料市場の将来に期待を寄せています。環境に優しい材料への世界の投資の増加は、主にその環境負荷の低さと費用対効果によってもたらされています。さらに、バイオ複合材料は、持続可能性と性能の面で従来の代替品を凌駕する可能性を秘めています。
当レポートでは、アジア太平洋のバイオ複合材料市場について調査し、市場の概要とともに、用途別、材料タイプ別、製品タイプ別、加工技術別、国別の動向、および市場に参入する企業のプロファイルなどを提供しています。
目次
エグゼクティブサマリー
調査範囲
第1章 市場
- 業界の見通し
- ビジネスダイナミクス
- ビジネスの促進要因
- ビジネスの抑制要因
- 事業戦略
- 経営戦略
- ビジネスの機会
第2章 地域
- 中国
- アジア太平洋と日本
第3章 市場-競合ベンチマーキングと企業プロファイル
- 競合ベンチマーキング
- 競合地位マトリックス
- 主要企業の製品マトリックス(材料タイプ別)
- 企業プロファイル
- Anhui Guofeng Wood-Plastic Composite Co., Ltd
- Nanjing Xuhua Sundi New Building Materials Co., Ltd
第4章 調査手法
List of Figures
- Figure 1: Bio-Composite Materials Market, $Billion, 2022, 2023, and 2032
- Figure 2: Bio-Composite Materials Market (by Application), $Billion, 2022 and 2032
- Figure 3: Bio-Composite Materials Market (by Material Type), $Billion, 2022 and 2032
- Figure 4: Bio-Composite Materials Market (by Product Type), $Billion, 2022 and 2032
- Figure 5: Bio-Composite Materials Market (by Processing Technique), $Billion, 2022 and 2032
- Figure 6: Bio-Composite Materials Market (by Region), $Billion, 2022 and 2032
- Figure 7: Supply Chain Analysis of the Bio-Composite Materials Market
- Figure 8: China Bio-Composite Materials Market, $Million, 2022-2032
- Figure 9: China Bio-Composite Materials Market (by Application), Volume, 2022, 2023, and 2032
- Figure 10: China Bio-Composite Materials Market (by Application), Value, 2022, 2023, and 2032
- Figure 11: China Bio-Composite Materials Market (by Material Type), Volume, 2022, 2023, and 2032
- Figure 12: China Bio-Composite Materials Market (by Material Type), Value, 2022, 2023, and 2032
- Figure 13: China Bio-Composite Materials Market (by Product Type), Volume, 2022, 2023, and 2032
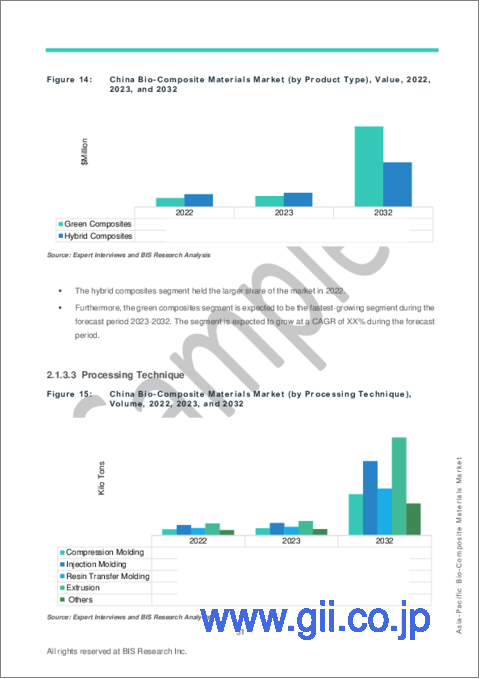
- Figure 14: China Bio-Composite Materials Market (by Product Type), Value, 2022, 2023, and 2032
- Figure 15: China Bio-Composite Materials Market (by Processing Technique), Volume, 2022, 2023, and 2032
- Figure 16: China Bio-Composite Materials Market (by Processing Technique), Value, 2022, 2023, and 2032
- Figure 17: Asia-Pacific and Japan Bio-Composite Materials Market, $Million, 2022-2032
- Figure 18: Asia-Pacific and Japan Bio-Composite Materials Market (by Application), Volume, 2022, 2023, and 2032
- Figure 19: Asia-Pacific and Japan Bio-Composite Materials Market (by Application), Value, 2022, 2023, and 2032
- Figure 20: Asia-Pacific and Japan Bio-Composite Materials Market (by Material Type), Volume, 2022, 2023, and 2032
- Figure 21: Asia-Pacific and Japan Bio-Composite Materials Market (by Material Type), Value, 2022, 2023, and 2032
- Figure 22: Asia-Pacific and Japan Bio-Composite Materials Market (by Product Type), Volume, 2022, 2023, and 2032
- Figure 23: Asia-Pacific and Japan Bio-Composite Materials Market (by Product Type), Value, 2022, 2023, and 2032
- Figure 24: Asia-Pacific and Japan Bio-Composite Materials Market (by Processing Technique), Volume, 2022, 2023, and 2032
- Figure 25: Asia-Pacific and Japan Bio-Composite Materials Market (by Processing Technique), Value, 2022, 2023, and 2032
- Figure 26: Japan Bio-Composite Materials Market, $Million, 2022-2032
- Figure 27: Japan Bio-Composite Materials Market (by Application), Volume, 2022, 2023, and 2032
- Figure 28: Japan Bio-Composite Materials Market (by Application), Value, 2022, 2023, and 2032
- Figure 29: Japan Bio-Composite Materials Market (by Material Type), Volume, 2022, 2023, and 2032
- Figure 30: Japan Bio-Composite Materials Market (by Material Type), Value, 2022, 2023, and 2032
- Figure 31: Japan Bio-Composite Materials Market (by Product Type), Volume, 2022, 2023, and 2032
- Figure 32: Japan Bio-Composite Materials Market (by Product Type), Value, 2022, 2023, and 2032
- Figure 33: Japan Bio-Composite Materials Market (by Processing Technique), Volume, 2022, 2023, and 2032
- Figure 34: Japan Bio-Composite Materials Market (by Processing Technique), Value, 2022, 2023, and 2032
- Figure 35: South Korea Bio-Composite Materials Market, $Million, 2022-2032
- Figure 36: South Korea Bio-Composite Materials Market (by Application), Volume, 2022, 2023, and 2032
- Figure 37: South Korea Bio-Composite Materials Market (by Application), Value, 2022, 2023, and 2032
- Figure 38: South Korea Bio-Composite Materials Market (by Material Type), Volume, 2022, 2023, and 2032
- Figure 39: South Korea Bio-Composite Materials Market (by Material Type), Value, 2022, 2023, and 2032
- Figure 40: South Korea Bio-Composite Materials Market (by Product Type), Volume, 2022, 2023, and 2032
- Figure 41: South Korea Bio-Composite Materials Market (by Product Type), Value, 2022, 2023, and 2032
- Figure 42: South Korea Bio-Composite Materials Market (by Processing Technique), Volume, 2022, 2023, and 2032
- Figure 43: South Korea Bio-Composite Materials Market (by Processing Technique), Value, 2022, 2023, and 2032
- Figure 44: India Bio-Composite Materials Market, $Million, 2022-2032
- Figure 45: India Bio-Composite Materials Market (by Application), Volume, 2022, 2023, and 2032
- Figure 46: India Bio-Composite Materials Market (by Application), Value, 2022, 2023, and 2032
- Figure 47: India Bio-Composite Materials Market (by Material Type), Volume, 2022, 2023, and 2032
- Figure 48: India Bio-Composite Materials Market (by Material Type), Value, 2022, 2023, and 2032
- Figure 49: India Bio-Composite Materials Market (by Product Type), Volume, 2022, 2023, and 2032
- Figure 50: India Bio-Composite Materials Market (by Product Type), Value, 2022, 2023, and 2032
- Figure 51: India Bio-Composite Materials Market (by Processing Technique), Volume, 2022, 2023, and 2032
- Figure 52: India Bio-Composite Materials Market (by Processing Technique), Value, 2022, 2023, and 2032
- Figure 53: Rest-of-Asia-Pacific and Japan Bio-Composite Materials Market, $Million, 2022-2032
- Figure 54: Rest-of-Asia-Pacific and Japan Bio-Composite Materials Market (by Application), Volume, 2022, 2023, and 2032
- Figure 55: Rest-of-Asia-Pacific and Japan Bio-Composite Materials Market (by Application), Value, 2022, 2023, and 2032
- Figure 56: Rest-of-Asia-Pacific and Japan Bio-Composite Materials Market (by Material Type), Volume, 2022, 2023, and 2032
- Figure 57: Rest-of-Asia-Pacific and Japan Bio-Composite Materials Market (by Material Type), Value, 2022, 2023, and 2032
- Figure 58: Rest-of-Asia-Pacific and Japan Bio-Composite Materials Market (by Product Type), Volume, 2022, 2023, and 2032
- Figure 59: Rest-of-Asia-Pacific and Japan Bio-Composite Materials Market (by Product Type), Value, 2022, 2023, and 2032
- Figure 60: Rest-of-Asia-Pacific and Japan Bio-Composite Materials Market (by Processing Technique), Volume, 2022, 2023, and 2032
- Figure 61: Rest-of-Asia-Pacific and Japan Bio-Composite Materials Market (by Processing Technique), Value, 2022, 2023, and 2032
- Figure 62: Research Methodology
- Figure 63: Top-Down/Bottom-Up Approach
- Figure 64: Bio-Composite Materials Market: Influencing Factors
- Figure 65: Assumptions and Limitations
List of Tables
- Table 1: Stakeholders of the Bio-Composite Materials Market
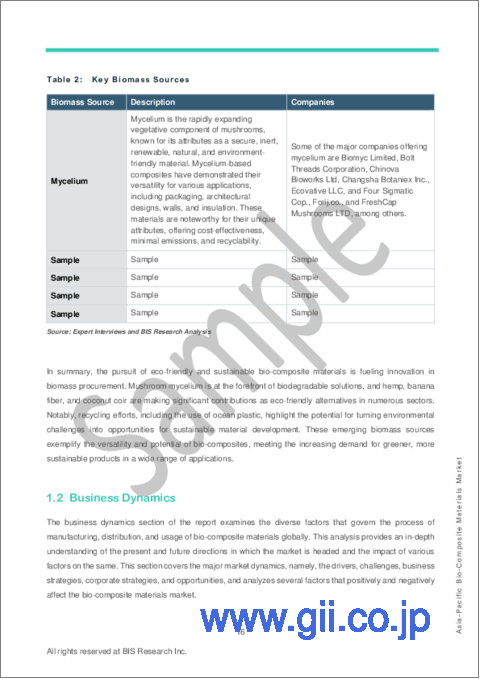
- Table 2: Key Biomass Sources
- Table 3: Key Product and Market Development
- Table 4: Key Mergers and Acquisitions, Partnerships, Collaborations, and Joint Ventures
- Table 5: Bio-Composite Materials Market (by Region), Kilo Tons, 2022-2032
- Table 6: Bio-Composite Materials Market (by Region), $Million, 2022-2032
- Table 7: Product Matrix of Key Companies (by Material Type)
“The Asia-Pacific Bio-Composite Materials Market (excluding China) Expected to Reach $18.23 Billion by 2032.”
Introduction to Asia-Pacific (APAC) Bio-Composite Materials Market
The Asia-Pacific bio-composite materials market (excluding China) was valued at $4.16 billion in 2023, and it is expected to grow at a CAGR of 17.83% and reach $18.23 billion by 2032. The Asia-Pacific bio-composite materials market is expected to grow due to a number of factors, the most important of which is rising awareness and adoption of eco-friendly and biodegradable materials in a variety of industries, including automotive, construction, packaging, and consumer goods, among others.
| KEY MARKET STATISTICS | |
|---|---|
| Forecast Period | 2023 - 2032 |
| 2023 Evaluation | $4.16 Billion |
| 2032 Forecast | $18.23 Billion |
| CAGR | 17.83% |
Market Introduction
The Asia-Pacific bio-composite materials market is in a growing phase, with a rapid increase in the number of companies offering bio-composite materials. Recent technological advancements in bio-composite materials, such as natural fibers and wood fibers, as well as an increasing number of construction projects, the automotive industry, renewable energy demand, and the electronics and consumer goods sectors, are driving the global adoption of bio-composite materials. Furthermore, due to the increasing demand for environmentally friendly and sustainable materials, many industry players are looking forward to the future of the bio-composite materials market. The increased global investment in eco-friendly materials is being driven primarily by their low environmental impact and cost-effectiveness. Furthermore, bio-composite materials have the potential to outperform traditional alternatives in terms of sustainability and performance.
Market Segmentation:
Segmentation 1: by Application
- Automotive
- Construction
- Aerospace
- Consumer Goods
- Packaging
- Electronics
- Renewable Energy
- Others
Segmentation 2: by Material Type
- Natural Fibers
- Wood Fibers
- Bio-Polymers
- Next-Generation Materials
- Recycled Materials
- Synthetic Polymers
- Others
Segmentation 3: by Product Type
- Green Composites
- Hybrid Composites
Segmentation 4: by Processing Technique
- Compression Molding
- Injection Molding
- Resin Transfer Molding
- Extrusion
- Others
Segmentation 5: by Country
- Japan
- South Korea
- India
- Rest-of-Asia-Pacific and Japan
How can this report add value to an organization?
Product/Innovation Strategy: The product segment helps the reader to understand the different types involved in the Asia-Pacific bio-composite materials market. Moreover, the study provides the reader with a detailed understanding of the Asia-Pacific bio-composite materials market based on the application (automotive, construction, aerospace, consumer goods, packaging, electronics, renewable energy, and others). The bio-composite materials market is gaining traction in applications on the back of sustainability concerns and their higher tensile strength and toughness, among others. Bio-composite materials are also being used for controlling greenhouse gas (GHG) emissions. Moreover, partnerships and collaborations are expected to play a crucial role in strengthening market position over the coming years, with the companies focusing on bolstering their technological capabilities and gaining a dominant market share in the bio-composite materials industry.
Growth/Marketing Strategy: The Asia-Pacific bio-composite materials market has been growing at a rapid pace. The market offers enormous opportunities for existing and emerging market players. Some of the strategies covered in this segment are mergers and acquisitions, product launches, partnerships and collaborations, business expansions, and investments. The strategies preferred by companies to maintain and strengthen their market position primarily include partnerships, agreements, and collaborations.
Competitive Strategy: The key players in the Asia-Pacific bio-composite materials market analyzed and profiled in the study include bio-composite materials suppliers that develop, maintain, and market bio-composite materials. Moreover, a detailed competitive benchmarking of the players operating in the bio-composite materials market has been done to help the reader understand the ways in which players stack against each other, presenting a clear market landscape. Additionally, comprehensive competitive strategies such as partnerships, agreements, and collaborations will aid the reader in understanding the untapped revenue pockets in the market.
Table of Contents
Executive Summary
Scope of the Study
1. Markets
- 1.1. Industry Outlook
- 1.1.1. Trends: Current and Future
- 1.1.1.1. Growing Utilization of Bio-Composite in the Packaging Industry
- 1.1.1.2. Utilization of Lignocellulosic Biomass in Biofuel Production
- 1.1.2. Supply Chain Analysis
- 1.1.3. Comparison Analysis between Bio-Composite and Conventional Composite Materials
- 1.1.4. Emerging Biomass Sources for Bio-Composite Materials
- 1.1.1. Trends: Current and Future
- 1.2. Business Dynamics
- 1.2.1. Business Drivers
- 1.2.1.1. Increasing Government Regulations Pertaining to the Utilization of Eco-Friendly Products
- 1.2.1.2. Growing Demand for lightweight Materials across Various End-Use Industries
- 1.2.1.3. Advancements in Manufacturing Processes and Rising Initiatives by Key Market Players
- 1.2.2. Business Restraints
- 1.2.2.1. Thermal Instability and Comparatively Low Strength as Compared to Conventional Composite Materials
- 1.2.2.2. Elevated Production Costs Associated with Bio-Composites
- 1.2.2.3. Availability of Low-Cost and High-Performing Alternatives
- 1.2.3. Business Strategies
- 1.2.3.1. Product and Market Development
- 1.2.4. Corporate Strategies
- 1.2.4.1. Mergers and Acquisitions, Partnerships, Collaborations, and Joint Ventures
- 1.2.5. Business Opportunities
- 1.2.5.1. Potential for Price Reduction through Economies of Scale
- 1.2.5.2. Increasing Demand for Lightweight and Environment-Friendly Materials in the Automotive Sector in China
- 1.2.5.3. Rising Trend of Sustainable Construction Practices Worldwide
- 1.2.1. Business Drivers
2. Regions
- 2.1. China
- 2.1.1. Market
- 2.1.1.1. Business Drivers
- 2.1.1.2. Business Challenges
- 2.1.2. Application, Value and Volume Data
- 2.1.3. Product, Value and Volume Data
- 2.1.3.1. Material Type
- 2.1.3.2. Product Type
- 2.1.3.3. Processing Technique
- 2.1.1. Market
- 2.2. Asia-Pacific and Japan
- 2.2.1. Market
- 2.2.1.1. Business Drivers
- 2.2.1.2. Business Challenges
- 2.2.2. Application, Value and Volume Data
- 2.2.3. Product, Value and Volume Data
- 2.2.3.1. Material Type
- 2.2.3.2. Product Type
- 2.2.3.3. Processing Technique
- 2.2.4. Asia-Pacific and Japan (by Country)
- 2.2.4.1. Japan
- 2.2.4.1.1. Market
- 2.2.4.1.2. Application, Value and Volume Data
- 2.2.4.1.3. Product, Value and Volume Data
- 2.2.4.1.3.1. Material Type
- 2.2.4.1.3.2. Product Type
- 2.2.4.1.3.3. Processing Technique
- 2.2.4.2. South Korea
- 2.2.4.2.1. Market
- 2.2.4.2.2. Application, Value and Volume Data
- 2.2.4.2.3. Product, Value and Volume Data
- 2.2.4.2.3.1. Material Type
- 2.2.4.2.3.2. Product Type
- 2.2.4.2.3.3. Processing Technique
- 2.2.4.3. India
- 2.2.4.3.1. Market
- 2.2.4.3.2. Application, Value and Volume Data
- 2.2.4.3.3. Product, Value and Volume Data
- 2.2.4.3.3.1. Material Type
- 2.2.4.3.3.2. Product Type
- 2.2.4.3.3.3. Processing Technique
- 2.2.4.4. Rest-of-Asia-Pacific and Japan
- 2.2.4.4.1. Market
- 2.2.4.4.2. Application, Value and Volume Data
- 2.2.4.4.3. Product, Value and Volume Data
- 2.2.4.4.3.1. Material Type
- 2.2.4.4.3.2. Product Type
- 2.2.4.4.3.3. Processing Technique
- 2.2.4.1. Japan
- 2.2.1. Market
3. Markets - Competitive Benchmarking & Company Profiles
- 3.1. Competitive Benchmarking
- 3.1.1. Competitive Position Matrix
- 3.1.2. Product Matrix of Key Companies (by Material Type)
- 3.2. Company Profiles
- 3.2.1. Anhui Guofeng Wood-Plastic Composite Co., Ltd
- 3.2.1.1. Overview
- 3.2.1.2. Top Products / Product Portfolio
- 3.2.1.3. Top Competitors
- 3.2.1.4. Target Customers/End-Users
- 3.2.1.5. Key Personnel
- 3.2.1.6. Analyst View
- 3.2.1.7. Market Share
- 3.2.2. Nanjing Xuhua Sundi New Building Materials Co., Ltd
- 3.2.2.1. Overview
- 3.2.2.2. Top Products / Product Portfolio
- 3.2.2.3. Top Competitors
- 3.2.2.4. Target Customers/End-Users
- 3.2.2.5. Key Personnel
- 3.2.2.6. Analyst View
- 3.2.2.7. Market Share
- 3.2.1. Anhui Guofeng Wood-Plastic Composite Co., Ltd
4. Research Methodology
- 4.1. Primary Data Sources
- 4.2. BIS Data Sources
- 4.3. Assumptions and Limitations
