|
|
市場調査レポート
商品コード
1481276
欧州のバイオ複合材料市場:用途・製品タイプ・材料タイプ・加工技術・国別の分析・予測 (2023-2032年)Europe Bio-Composite Materials Market: Focus on Application, Product Type, Material Type, Processing Technique, and Country - Analysis and Forecast, 2023-2032 |
||||||
|
|||||||
カスタマイズ可能
|
|||||||

| 欧州のバイオ複合材料市場:用途・製品タイプ・材料タイプ・加工技術・国別の分析・予測 (2023-2032年) |
|
出版日: 2024年05月20日
発行: BIS Research
ページ情報: 英文 105 Pages
納期: 1~5営業日
|

全表示
- 概要
- 図表
- 目次
英国を除く欧州のバイオ複合材料の市場規模は、2023年の18億9,300万米ドルから、予測期間中は14.79%のCAGRで推移し、2032年には65億4,860万米ドルに達すると予測されています。
バイオ複合材料市場の成長は、自動車、建設、包装、消費財などの多様な分野で、持続可能で分解可能な材料に対する認識と利用が高まっていることなど、複合的な要因によって牽引されると予想されています。
| 主要市場統計 | |
|---|---|
| 予測期間 | 2023-2032年 |
| 2023年評価 | 18億9,300万米ドル |
| 2032年予測 | 65億4,860万米ドル |
| CAGR | 14.79% |
欧州のバイオ複合材料市場は、さまざまな要因によって大幅な成長を遂げています。まず、環境意識の高まりと持続可能な実践を促進する厳しい規制が、この地域のさまざまな産業でバイオベースおよび生分解性材料の採用を促進しています。自動車産業では、軽量で環境に優しい部品のためにバイオ複合材料を採用し、建設産業では持続可能な建築ソリューションのためにこれらの材料を取り入れています。包装や消費財の分野では、二酸化炭素排出量を削減し、製品の持続可能性を高めるバイオ複合材料の利点を認識しつつあります。政府のイニシアチブや支援政策も市場の拡大をさらに後押しし、R&Dを促し、バイオ複合材技術の革新を促進しています。持続可能なイニシアチブの最前線にある欧州では、バイオ複合材料市場は、環境問題に対処し、進化する消費者の嗜好に応えることを目指すメーカーやステークホルダーに有利な機会を示しています。
市場の分類
セグメンテーション1:用途別
- 自動車
- 建設
- 航空宇宙
- 消費財
- 包装
- エレクトロニクス
- 再生可能エネルギー
- その他
セグメンテーション2:材料タイプ別
- 天然繊維
- 木質繊維
- バイオポリマー
- 次世代材料
- リサイクル材料
- 合成ポリマー
- その他
セグメンテーション3:製品タイプ別
- グリーン複合材料
- ハイブリッド複合材料
セグメンテーション4:加工技術別
- 圧縮成形
- 射出成形
- 樹脂トランスファー成形
- 押出成形
- その他
セグメンテーション5:国別
- ドイツ
- フランス
- イタリア
- スペイン
- その他
当レポートでは、欧州のバイオ複合材料の市場を調査し、業界の動向、市場成長促進要因・抑制要因、市場規模の推移・予測、各種区分別の詳細分析、競合情勢、主要企業のプロファイルなどをまとめています。
目次
エグゼクティブサマリー
調査範囲
第1章 市場
- 業界展望
- 動向:現在と将来
- サプライチェーン分析
- バイオ複合材料と従来の複合材料の比較分析
- バイオ複合材料のための新たなバイオマス資源
- 事業力学
- 事業促進要因
- 事業上の制約
- 事業戦略
- 企業戦略
- 事業機会
第2章 地域
- 欧州
- 市場
- 用途別
- 製品別
- 国別
- 英国
- 市場
- 用途別
- 製品別
第3章 市場:競合ベンチマーキング・企業プロファイル
- 競合ベンチマーキング
- 競合ポジションマトリックス
- 企業プロファイル
- Bcomp Ltd.
- Meshlin Composites Zrt.
- Tecnaro GmbH
- UPM
第4章 調査手法
List of Figures
- Figure 1: Europe Bio-Composite Materials Market, $Billion, 2022, 2023, and 2032
- Figure 2: Europe Bio-Composite Materials Market (by Application), $Billion, 2022 and 2032
- Figure 3: Europe Bio-Composite Materials Market (by Material Type), $Billion, 2022 and 2032
- Figure 4: Europe Bio-Composite Materials Market (by Product Type), $Billion, 2022 and 2032
- Figure 5: Europe Bio-Composite Materials Market (by Processing Technique), $Billion, 2022 and 2032
- Figure 6: Bio-Composite Materials Market (by Region), $Billion, 2022 and 2032
- Figure 7: Supply Chain Analysis of the Bio-Composite Materials Market
- Figure 8: Europe Bio-Composite Materials Market, $Million, 2022-2032
- Figure 9: Europe Bio-Composite Materials Market (by Application), Volume, 2022, 2023, and 2032
- Figure 10: Europe Bio-Composite Materials Market (by Application), Value, 2022, 2023, and 2032
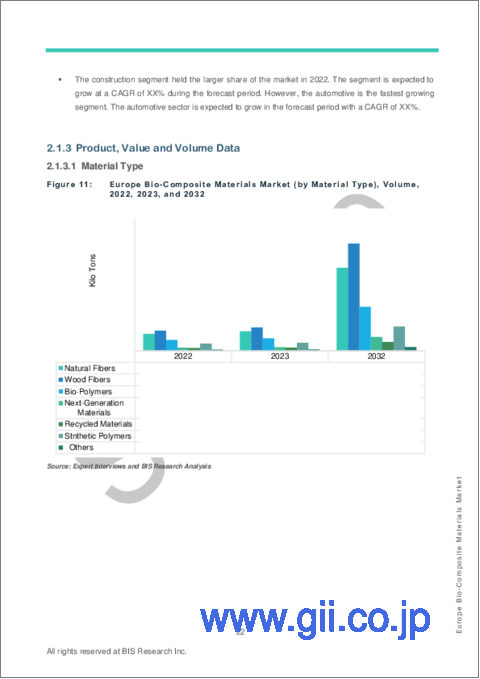
- Figure 11: Europe Bio-Composite Materials Market (by Material Type), Volume, 2022, 2023, and 2032
- Figure 12: Europe Bio-Composite Materials Market (by Material Type), Value, 2022, 2023, and 2032
- Figure 13: Europe Bio-Composite Materials Market (by Product Type), Volume, 2022, 2023, and 2032
- Figure 14: Europe Bio-Composite Materials Market (by Product Type), Value, 2022, 2023, and 2032
- Figure 15: Europe Bio-Composite Materials Market (by Processing Technique), Volume, 2022, 2023, and 2032
- Figure 16: Europe Bio-Composite Materials Market (by Processing Technique), Value, 2022, 2023, and 2032
- Figure 17: Germany Bio-Composite Materials Market, $Million, 2022-2032
- Figure 18: Germany Bio-Composite Materials Market (by Application), Volume, 2022, 2023, and 2032
- Figure 19: Germany Bio-Composite Materials Market (by Application), Value, 2022, 2023, and 2032
- Figure 20: Germany Bio-Composite Materials Market (by Material Type), Volume, 2022, 2023, and 2032
- Figure 21: Germany Bio-Composite Materials Market (by Material Type), Value, 2022, 2023, and 2032
- Figure 22: Germany Bio-Composite Materials Market (by Product Type), Volume, 2022, 2023, and 2032
- Figure 23: Germany Bio-Composite Materials Market (by Product Type), Value, 2022, 2023, and 2032
- Figure 24: Germany Bio-Composite Materials Market (by Processing Technique), Volume, 2022, 2023, and 2032
- Figure 25: Germany Bio-Composite Materials Market (by Processing Technique), Value, 2022, 2023, and 2032
- Figure 26: France Bio-Composite Materials Market, $Million, 2022-2032
- Figure 27: France Bio-Composite Materials Market (by Application), Volume, 2022, 2023, and 2032
- Figure 28: France Bio-Composite Materials Market (by Application), Value, 2022, 2023, and 2032
- Figure 29: France Bio-Composite Materials Market (by Material Type), Volume, 2022, 2023, and 2032
- Figure 30: France Bio-Composite Materials Market (by Material Type), Value, 2022, 2023, and 2032
- Figure 31: France Bio-Composite Materials Market (by Product Type), Volume, 2022, 2023, and 2032
- Figure 32: France Bio-Composite Materials Market (by Product Type), Value, 2022, 2023, and 2032
- Figure 33: France Bio-Composite Materials Market (by Processing Technique), Volume, 2022, 2023, and 2032
- Figure 34: France Bio-Composite Materials Market (by Processing Technique), Value, 2022, 2023, and 2032
- Figure 35: Italy Bio-Composite Materials Market, $Million, 2022-2032
- Figure 36: Italy Bio-Composite Materials Market (by Application), Volume, 2022, 2023, and 2032
- Figure 37: Italy Bio-Composite Materials Market (by Application), Value, 2022, 2023, and 2032
- Figure 38: Italy Bio-Composite Materials Market (by Material Type), Volume, 2022, 2023, and 2032
- Figure 39: Italy Bio-Composite Materials Market (by Material Type), Value, 2022, 2023, and 2032
- Figure 40: Italy Bio-Composite Materials Market (by Product Type), Volume, 2022, 2023, and 2032
- Figure 41: Italy Bio-Composite Materials Market (by Product Type), Value, 2022, 2023, and 2032
- Figure 42: Italy Bio-Composite Materials Market (by Processing Technique), Volume, 2022, 2023, and 2032
- Figure 43: Italy Bio-Composite Materials Market (by Processing Technique), Value, 2022, 2023, and 2032
- Figure 44: Spain Bio-Composite Materials Market, $Million, 2022-2032
- Figure 45: Spain Bio-Composite Materials Market (by Application), Volume, 2022, 2023, and 2032
- Figure 46: Spain Bio-Composite Materials Market (by Application), Value, 2022, 2023, and 2032
- Figure 47: Spain Bio-Composite Materials Market (by Material Type), Volume, 2022, 2023, and 2032
- Figure 48: Spain Bio-Composite Materials Market (by Material Type), Value, 2022, 2023, and 2032
- Figure 49: Spain Bio-Composite Materials Market (by Product Type), Volume, 2022, 2023, and 2032
- Figure 50: Spain Bio-Composite Materials Market (by Product Type), Value, 2022, 2023, and 2032
- Figure 51: Spain Bio-Composite Materials Market (by Processing Technique), Volume, 2022, 2023, and 2032
- Figure 52: Spain Bio-Composite Materials Market (by Processing Technique), Value, 2022, 2023, and 2032
- Figure 53: Rest-of-Europe Bio-Composite Materials Market, $Million, 2022-2032
- Figure 54: Rest-of-Europe Bio-Composite Materials Market (by Application), Volume, 2022, 2023, and 2032
- Figure 55: Rest-of-Europe Bio-Composite Materials Market (by Application), Value, 2022, 2023, and 2032
- Figure 56: Rest-of-Europe Bio-Composite Materials Market (by Material Type), Volume, 2022, 2023, and 2032
- Figure 57: Rest-of-Europe Bio-Composite Materials Market (by Material Type), Value, 2022, 2023, and 2032
- Figure 58: Rest-of-Europe Bio-Composite Materials Market (by Product Type), Volume, 2022, 2023, and 2032
- Figure 59: Rest-of-Europe Bio-Composite Materials Market (by Product Type), Value, 2022, 2023, and 2032
- Figure 60: Rest-of-Europe Bio-Composite Materials Market (by Processing Technique), Volume, 2022, 2023, and 2032
- Figure 61: Rest-of-Europe Bio-Composite Materials Market (by Processing Technique), Value, 2022, 2023, and 2032
- Figure 62: U.K. Bio-Composite Materials Market, $Million, 2022-2032
- Figure 63: U.K. Bio-Composite Materials Market (by Application), Volume, 2022, 2023, and 2032
- Figure 64: U.K. Bio-Composite Materials Market (by Application), Value, 2022, 2023, and 2032
- Figure 65: U.K. Bio-Composite Materials Market (by Material Type), Volume, 2022, 2023, and 2032
- Figure 66: U.K. Bio-Composite Materials Market (by Material Type), Value, 2022, 2023, and 2032
- Figure 67: U.K. Bio-Composite Materials Market (by Product Type), Volume, 2022, 2023, and 2032
- Figure 68: U.K. Bio-Composite Materials Market (by Product Type), Value, 2022, 2023, and 2032
- Figure 69: U.K. Bio-Composite Materials Market (by Processing Technique), Volume, 2022, 2023, and 2032
- Figure 70: U.K. Bio-Composite Materials Market (by Processing Technique), Value, 2022, 2023, and 2032
- Figure 71: Research Methodology
- Figure 72: Top-Down/Bottom-Up Approach
- Figure 73: Bio-Composite Materials Market: Influencing Factors
- Figure 74: Assumptions and Limitations
List of Tables
- Table 1: Stakeholders of the Bio-Composite Materials Market
- Table 2: Key Biomass Sources
- Table 3: Key Product and Market Development
- Table 4: Key Mergers and Acquisitions, Partnerships, Collaborations, and Joint Ventures
- Table 5: Bio-Composite Materials Market (by Region), Kilo Tons, 2022-2032
- Table 6: Bio-Composite Materials Market (by Region), $Million, 2022-2032
Introduction to Europe Bio-Composite Materials Market
The Europe bio-composite materials market (excluding U.K.) was valued at $1,893.0 million in 2023, and it is expected to grow at a CAGR of 14.79% and reach $6,548.6 million by 2032. The growth in the bio-composite materials market is expected to be driven by a combination of factors, predominantly propelled by increasing recognition and utilization of environmentally sustainable and decomposable materials across diverse sectors like automotive, construction, packaging, and consumer goods, among others.
| KEY MARKET STATISTICS | |
|---|---|
| Forecast Period | 2023 - 2032 |
| 2023 Evaluation | $1,893.0 Million |
| 2032 Forecast | $6,548.6 Million |
| CAGR | 14.79% |
Market Introduction
The Europe bio-composite materials market is witnessing substantial growth driven by a convergence of factors. Increasing environmental consciousness and stringent regulations promoting sustainable practices are fostering the adoption of bio-based and biodegradable materials across various industries in the region. The automotive sector is embracing bio-composites for lightweight and eco-friendly components, while the construction industry is incorporating these materials for sustainable building solutions. Additionally, the packaging and consumer goods sectors are recognizing the benefits of bio-composites in reducing carbon footprint and enhancing product sustainability. Government initiatives and supportive policies further bolster market expansion, encouraging research and development efforts and fostering innovation in bio-composite technologies. With Europe at the forefront of sustainable initiatives, the bio-composite materials market presents lucrative opportunities for manufacturers and stakeholders aiming to address environmental concerns and meet evolving consumer preferences.
Market Segmentation:
Segmentation 1: by Application
- Automotive
- Construction
- Aerospace
- Consumer Goods
- Packaging
- Electronics
- Renewable Energy
- Others
Segmentation 2: by Material Type
- Natural Fibers
- Wood Fibers
- Bio-Polymers
- Next-Generation Materials
- Recycled Materials
- Synthetic Polymers
- Others
Segmentation 3: by Product Type
- Green Composites
- Hybrid Composites
Segmentation 4: by Processing Technique
- Compression Molding
- Injection Molding
- Resin Transfer Molding
- Extrusion
- Others
Segmentation 5: by Country
- Germany
- France
- Italy
- Spain
- Rest-of-Europe
How can this report add value to an organization?
Product/Innovation Strategy: The product segment helps the reader to understand the different types involved in the bio-composite materials market. Moreover, the study provides the reader with a detailed understanding of the bio-composite materials market based on the application (automotive, construction, aerospace, consumer goods, packaging, electronics, renewable energy, and others). The bio-composite materials market is gaining traction in applications on the back of sustainability concerns and their higher tensile strength and toughness, among others. Bio-composite materials are also being used for controlling greenhouse gas (GHG) emissions. Moreover, partnerships and collaborations are expected to play a crucial role in strengthening market position over the coming years, with the companies focusing on bolstering their technological capabilities and gaining a dominant market share in the bio-composite materials industry.
Growth/Marketing Strategy: The Europe bio-composite materials market has been growing at a rapid pace. The market offers enormous opportunities for existing and emerging market players. Some of the strategies covered in this segment are mergers and acquisitions, product launches, partnerships and collaborations, business expansions, and investments. The strategies preferred by companies to maintain and strengthen their market position primarily include partnerships, agreements, and collaborations.
Competitive Strategy: The key players in the Europe bio-composite materials market analyzed and profiled in the study include bio-composite materials suppliers that develop, maintain, and market bio-composite materials. Moreover, a detailed competitive benchmarking of the players operating in the bio-composite materials market has been done to help the reader understand the ways in which players stack against each other, presenting a clear market landscape. Additionally, comprehensive competitive strategies such as partnerships, agreements, and collaborations will aid the reader in understanding the untapped revenue pockets in the market.
Key Market Players and Competition Synopsis
The companies that are profiled have been selected based on inputs gathered from primary experts and analyzing company coverage, product portfolio, and market penetration.
Some of the prominent names in this market are:
- Bcomp Ltd.
- Meshlin Composites Zrt.
- Tecnaro GmbH
- UPM
Table of Contents
Executive Summary
Scope of the Study
1 Markets
- 1.1 Industry Outlook
- 1.1.1 Trends: Current and Future
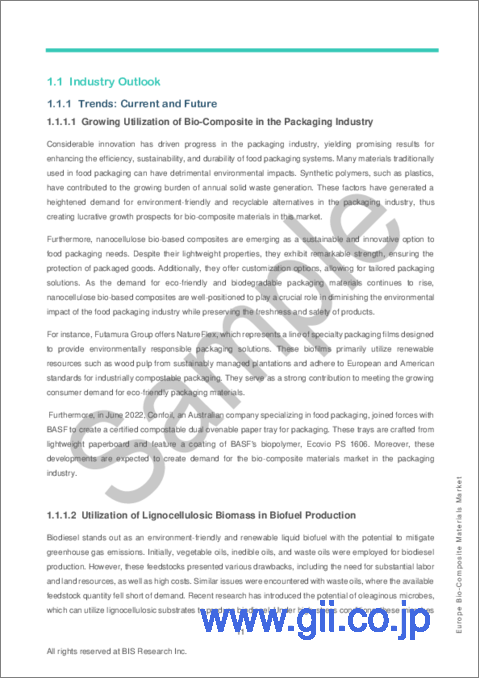
- 1.1.1.1 Growing Utilization of Bio-Composite in the Packaging Industry
- 1.1.1.2 Utilization of Lignocellulosic Biomass in Biofuel Production
- 1.1.2 Supply Chain Analysis
- 1.1.3 Comparison Analysis between Bio-Composite and Conventional Composite Materials
- 1.1.4 Emerging Biomass Sources for Bio-Composite Materials
- 1.1.1 Trends: Current and Future
- 1.2 Business Dynamics
- 1.2.1 Business Drivers
- 1.2.1.1 Increasing Government Regulations Pertaining to the Utilization of Eco-Friendly Products
- 1.2.1.2 Growing Demand for lightweight Materials across Various End-Use Industries
- 1.2.1.3 Advancements in Manufacturing Processes and Rising Initiatives by Key Market Players
- 1.2.2 Business Restraints
- 1.2.2.1 Thermal Instability and Comparatively Low Strength as Compared to Conventional Composite Materials
- 1.2.2.2 Elevated Production Costs Associated with Bio-Composites
- 1.2.2.3 Availability of Low-Cost and High-Performing Alternatives
- 1.2.3 Business Strategies
- 1.2.3.1 Product and Market Development
- 1.2.4 Corporate Strategies
- 1.2.4.1 Mergers and Acquisitions, Partnerships, Collaborations, and Joint Ventures
- 1.2.5 Business Opportunities
- 1.2.5.1 Potential for Price Reduction through Economies of Scale
- 1.2.5.2 Increasing Demand for Lightweight and Environment-Friendly Materials in the Automotive Sector in China
- 1.2.5.3 Rising Trend of Sustainable Construction Practices Worldwide
- 1.2.1 Business Drivers
2 Regions
- 2.1 Europe
- 2.1.1 Market
- 2.1.1.1 Business Drivers
- 2.1.1.2 Business Challenges
- 2.1.2 Application, Value and Volume Data
- 2.1.3 Product, Value and Volume Data
- 2.1.3.1 Material Type
- 2.1.3.2 Product Type
- 2.1.3.3 Processing Technique
- 2.1.4 Europe (by Country)
- 2.1.4.1 Germany
- 2.1.4.1.1 Market
- 2.1.4.1.2 Application, Value and Volume Data
- 2.1.4.1.3 Product, Value and Volume Data
- 2.1.4.1.3.1 Material Type
- 2.1.4.1.3.2 Product Type
- 2.1.4.1.3.3 Processing Technique
- 2.1.4.2 France
- 2.1.4.2.1 Market
- 2.1.4.2.2 Application, Value and Volume Data
- 2.1.4.2.3 Product, Value and Volume Data
- 2.1.4.2.3.1 Material Type
- 2.1.4.2.3.2 Product Type
- 2.1.4.2.3.3 Processing Technique
- 2.1.4.3 Italy
- 2.1.4.3.1 Market
- 2.1.4.3.2 Application, Value and Volume Data
- 2.1.4.3.3 Product, Value and Volume Data
- 2.1.4.3.3.1 Material Type
- 2.1.4.3.3.2 Product Type
- 2.1.4.3.3.3 Processing Technique
- 2.1.4.4 Spain
- 2.1.4.4.1 Market
- 2.1.4.4.2 Application, Value and Volume Data
- 2.1.4.4.3 Product, Value and Volume Data
- 2.1.4.4.3.1 Material Type
- 2.1.4.4.3.2 Product Type
- 2.1.4.4.3.3 Processing Technique
- 2.1.4.5 Rest-of-Europe
- 2.1.4.5.1 Market
- 2.1.4.5.2 Application, Value and Volume Data
- 2.1.4.5.3 Product, Value and Volume Data
- 2.1.4.5.3.1 Material Type
- 2.1.4.5.3.2 Product Type
- 2.1.4.5.3.3 Processing Technique
- 2.1.4.1 Germany
- 2.1.1 Market
- 2.2 U.K.
- 2.2.1 Market
- 2.2.1.1 Business Drivers
- 2.2.1.2 Business Challenges
- 2.2.2 Application, Value and Volume Data
- 2.2.3 Product, Value and Volume Data
- 2.2.3.1 Material Type
- 2.2.3.2 Product Type
- 2.2.3.3 Processing Technique
- 2.2.1 Market
3 Markets - Competitive Benchmarking & Company Profiles
- 3.1 Competitive Benchmarking
- 3.1.1 Competitive Position Matrix
- 3.2 Company Profiles
- 3.2.1 Bcomp Ltd.
- 3.2.1.1 Overview
- 3.2.1.2 Top Products / Product Portfolio
- 3.2.1.3 Top Competitors
- 3.2.1.4 Target Customers/End-Users
- 3.2.1.5 Key Personnel
- 3.2.1.6 Analyst View
- 3.2.1.7 Market Share
- 3.2.2 Meshlin Composites Zrt.
- 3.2.2.1 Overview
- 3.2.2.2 Top Products / Product Portfolio
- 3.2.2.3 Top Competitors
- 3.2.2.4 Target Customers/End-Users
- 3.2.2.5 Key Personnel
- 3.2.2.6 Analyst View
- 3.2.2.7 Market Share
- 3.2.3 Tecnaro GmbH
- 3.2.3.1 Overview
- 3.2.3.2 Top Products / Product Portfolio
- 3.2.3.3 Top Competitors
- 3.2.3.4 Target Customers/End-Users
- 3.2.3.5 Key Personnel
- 3.2.3.6 Analyst View
- 3.2.3.7 Market Share
- 3.2.4 UPM
- 3.2.4.1 Overview
- 3.2.4.2 Top Products / Product Portfolio
- 3.2.4.3 Top Competitors
- 3.2.4.4 Target Customers/End-Users
- 3.2.4.5 Key Personnel
- 3.2.4.6 Analyst View
- 3.2.4.7 Market Share
- 3.2.1 Bcomp Ltd.
4 Research Methodology
- 4.1 Primary Data Sources
- 4.2 BIS Data Sources
- 4.3 Assumptions and Limitations
