|
|
市場調査レポート
商品コード
1397352
バイオプロセスバリデーションの世界市場:エンドユーザー、製品タイプ、試験タイプ、地域別、競合情勢- 分析と予測、2024-2033年Global Bioprocess Validation Market: Focus on End Users, Product, Test Type, Region and Competitive Landscape - Analysis and Forecast, 2024-2033 |
||||||
|
|
|||||||
|
● お客様のご希望に応じて、既存データの加工や未掲載情報(例:国別セグメント)の追加などの対応が可能です。 詳細はお問い合わせください。 |
|||||||


| バイオプロセスバリデーションの世界市場:エンドユーザー、製品タイプ、試験タイプ、地域別、競合情勢- 分析と予測、2024-2033年 |
|
出版日: 2023年12月17日
発行: BIS Research
ページ情報: 英文 147 Pages
納期: 1~5営業日
|
- 全表示
- 概要
- 図表
- 目次
バイオプロセスバリデーションの市場は、厳格な規制基準とバイオ治療薬へのニーズの高まりに後押しされ、大きな成長を示すと予測されています。
米国FDAのガイドラインとcGMP規制に沿ったバイオプロセスバリデーションには、生物製剤やバイオ医薬品の製造に関連する手順、取り組み、エビデンスの綿密な文書化が含まれます。この包括的な文書化により、医薬品有効成分 (API) と不純物の評価に重点を置いた、製品試験の全段階におけるコンプライアンスが保証されます。
当レポートでは、世界のバイオプロセスバリデーションの市場を調査し、市場の背景・概要、市場成長への各種影響因子の分析、技術・特許の動向、法規制環境、市場規模の推移・予測、各種区分・地域別の詳細分析、競合情勢、主要企業の分析などをまとめています。
市場の分類
セグメンテーション1:エンドユーザー別
- 製薬・バイオテクノロジー企業
- 開発・製造受託機関
- その他
セグメンテーション2:試験タイプ別
- 抽出性および溶出性試験サービス
- 微生物試験サービス
- 物理化学試験サービス
- 完全性試験サービス
- 適合性試験サービス
- その他
セグメンテーション3:プロセスコンポーネント別
- フィルターエレメント
- メディアコンテナおよびメディアバッグ
- 冷凍・解凍処理用バッグ
- バイオリアクター
- 搬送システム
- その他
セグメンテーション4:地域別
- 北米
- 欧州
- アジア太平洋
- ラテンアメリカ
- 中東・アフリカ
目次
エグゼクティブサマリー
範囲と定義
第1章 市場
- 動向:現在および将来の影響評価
- サプライチェーンの概要
- バリューチェーン分析
- マーケットマップ
- R&Dレビュー
- 国・企業別の特許出願動向
- 規制状況
- 主な世界的出来事の影響分析:COVID-19
- 市場力学の概要
- 市場促進要因
- 市場抑制要因
- 市場機会
第2章 用途
- 用途の分類
- 用途の概要
- 世界のバイオプロセスバリデーション市場 (エンドユーザー別)
- 製薬およびバイオテクノロジー企業
- 受託開発・製造組織
- その他
第3章 製品
- 製品の分類
- 製品概要
- 世界のバイオプロセスバリデーション市場 (製品別)
- 市場概要
- 世界のバイオプロセスバリデーション市場 (試験タイプ別)
- 抽出性および溶出性試験サービス
- 微生物試験サービス
- 物理化学試験サービス
- 完全性試験サービス
- 適合性試験サービス
- その他
- 世界のバイオプロセスバリデーション市場 (プロセスコンポーネント別)
- フィルターエレメント
- メディアコンテナおよびメディアバッグ
- 冷凍・解凍処理用バッグ
- バイオリアクター
- 搬送システム
- その他
第4章 地域
- 地域概要
- 促進要因・抑制要因
- 北米
- 欧州
- アジア太平洋
- ラテンアメリカ
- 中東・アフリカ
第5章 市場:競合ベンチマーキング・企業プロファイル
- 次のフロンティア
- 地域的評価
- Merck KGgA
- Sartorius AG
- Eurofins Scientific
- Thermo Fisher Scientific Inc.
- Hangzhou Cobetter Filtration Equipment Co.,Ltd
- Meissner Filtration Products, Inc.
- Almac Group
- Danaher Corporation
- SGS Societe Generale de Surveillance SA.
- Charles River Laboratories
- Lonza
- Labcorp Drug Development
- BIOZEEN
- WuXi Biologics
- Pacific Biolabs
第6章 調査手法
List of Figures
- Figure 1: Global Bioprocess Validation Market, By Region, 2022, 2026, and 2033
- Figure 2: Global Bioprocess Validation Market, Pricing/Cost Analysis
- Figure 3: Global Bioprocess Validation Market, by Stage, 2022, 2026, and 2033
- Figure 4: Global Bioprocess Validation Market, by Mode, 2022, 2026, and 2033
- Figure 5: Global Bioprocess Validation Market, by End User, 2022, 2026, and 2033
- Figure 6: Global Bioprocess Validation Market, by Test Type, 2022, 2026, and 2033
- Figure 7: Global Bioprocess Validation Market, by Process Component, 2022, 2026, and 2033
- Figure 8: Global Bioprocess Validation Market, Recent Developments
- Figure 9: Supply chain and Identifying Risks within the Supply Chain
- Figure 10: Global Bioprocess Validation Market, January 2020-December 2023
- Figure 11: Global Bioprocess Validation Market, January 2020-December 2023
- Figure 12: Impact Analysis of Market Navigating Factors
- U.S. Bioprocess Validation Market, By End User ($ Million), 2022, 2026 and 2033
- Figure 13: Canada Bioprocess Validation Market, By End User ($ Million), 2022, 2026 and 2033
- Figure 14: Germany Bioprocess Validation Market, By End User ($ Million), 2022, 2026 and 2033
- Figure 15: U.K. Bioprocess Validation Market, By End User ($ Million), 2022, 2026 and 2033
- Figure 16: France Bioprocess Validation Market, By End User ($ Million), 2022, 2026 and 2033
- Figure 17: Italy Bioprocess Validation Market, By End User ($ Million), 2022, 2026 and 2033
- Figure 18: Spain Bioprocess Validation Market, By End User ($ Million), 2022, 2026 and 2033
- Figure 19: Rest of Europe Bioprocess Validation Market, By End User ($ Million), 2022, 2026 and 2033
- Figure 20: China Bioprocess Validation Market, By End User ($ Million), 2022, 2026 and 2033
- Figure 21: Japan Bioprocess Validation Market, By End User ($ Million), 2022, 2026 and 2033
- Figure 22: South Korea Bioprocess Validation Market, By End User ($ Million), 2022, 2026 and 2033
- Figure 23: Australia Bioprocess Validation Market, By End User ($ Million), 2022, 2026 and 2033
- Figure 24: India Bioprocess Validation Market, By End User ($ Million), 2022, 2026 and 2033
- Figure 25: Rest-of-Asia-Pacific Bioprocess Validation Market, By End User ($ Million), 2022, 2026 and 2033
- Figure 26: Brazil Bioprocess Validation Market, By End User ($ Million), 2022, 2026 and 2033
- Figure 27: Mexico Bioprocess Validation Market, By End User ($ Million), 2022, 2026 and 2033
- Figure 28: Rest-of-Latin America Bioprocess Validation Market, By End User ($ Million), 2022, 2026 and 2033
- Figure 29: Strategic Initiatives, 2020 - 2023
- Figure 30: Share of Strategic Initiatives
- Figure 31: Data Triangulation
- Figure 32: Top-Down and Bottom-Up Approach
- Figure 33: Assumptions and Limitations
List of Tables
- Table 1: Market Snapshot
- Table 2: Global Bioprocess Validation Market, Opportunities
- Table 3: Global Bioprocess Validation Market, by Test Type, $Million, 2022-2033
- Table 4: Global Bioprocess Validation Market, by Process Component, $Million, 2022-2033
- Table 5: Global Bioprocess Validation Market, By Region, ($ Million), 2022-2033
- Table 6: North America Bioprocess Validation Market, By End User ($ Million), 2022-2033
- Table 7: North America Bioprocess Validation Market, By Test Type ($ Million), 2022-2033
- Table 8: U.S. Bioprocess Validation Market, By End User ($ Million), 2022-2033
- Table 9: Canada Bioprocess Validation Market, By End User ($ Million), 2022-2033
- Table 10: Europe Bioprocess Validation Market, By End User ($ Million), 2022-2033
- Table 11: Europe Bioprocess Validation Market, By Test Type ($ Million), 2022-2033
- Table 12: Germany Bioprocess Validation Market, By End User ($ Million), 2022-2033
- Table 13: U.K. Bioprocess Validation Market, By End User ($ Million), 2022-2033
- Table 14: France Bioprocess Validation Market, By End User ($ Million), 2022-2033
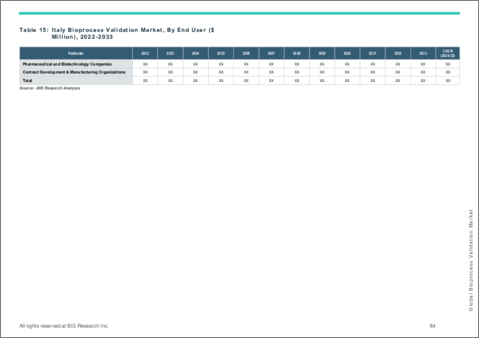
- Table 15: Italy Bioprocess Validation Market, By End User ($ Million), 2022-2033
- Table 16: Spain Bioprocess Validation Market, By End User ($ Million), 2022-2033
- Table 17: Rest of Europe Bioprocess Validation Market, By End User ($ Million), 2022-2033
- Table 18: Asia Pacific Bioprocess Validation Market, By End User ($ Million), 2022-2033
- Table 19: Asia Pacific Bioprocess Validation Market, By Test Type ($ Million), 2022-2033
- Table 20: China Bioprocess Validation Market, By End User ($ Million), 2022-2033
- Table 21: Japan Bioprocess Validation Market, By End User ($ Million), 2022-2033
- Table 22: South Korea Bioprocess Validation Market, By End User ($ Million), 2022-2033
- Table 23: Australia Bioprocess Validation Market, By End User ($ Million), 2022-2033
- Table 24: India Bioprocess Validation Market, By End User ($ Million), 2022-2033
- Table 25: Rest-of-Asia-Pacific Bioprocess Validation Market, By End User ($ Million), 2022-2033
- Table 26: Latin America Bioprocess Validation Market, By End User ($ Million), 2022-2033
- Table 27: Latin America Bioprocess Validation Market, By Test Type ($ Million), 2022-2033
- Table 28: Brazil Bioprocess Validation Market, By End User ($ Million), 2022-2033
- Table 29: Mexico Bioprocess Validation Market, By End User ($ Million), 2022-2033
- Table 30: Rest-of-Latin America Bioprocess Validation Market, By End User ($ Million), 2022-2033
- Table 31: Middle East & Africa Bioprocess Validation Market, By End User ($ Million), 2022-2033
- Table 32: Middle East & Africa Bioprocess Validation Market, By Test Type ($ Million), 2022-2033
- Table 33: Market Share
“The bioprocess validation market is poised for significant growth, fueled by stringent regulatory standards and an increasing need for biotherapeutics.”
Bioprocess validation, aligning with US FDA guidelines and cGMP regulations, involves meticulous documentation of procedures, activities, and evidence related to the production of biological and biopharmaceutical products. This comprehensive documentation ensures compliance across all stages of product testing, emphasizing the assessment of active pharmaceutical ingredients (APIs) and impurities.
This comprehensive report provides a detailed analysis of market trends, key players, and growth opportunities within the bioprocessing validation sector.
With insights into market drivers, challenges, and opportunities, this report serves as a valuable resource for industry participants, investors, and decision-makers seeking to navigate the dynamic landscape of the global bioprocessing validation market.
Market Segmentation:
Segmentation 1: by End User
- Pharmaceutical and Biotechnology Companies
- Contract Development & Manufacturing Organizations
- Others
Segmentation 2: by Test Type
- Extractable and Leachable Testing Services
- Microbiological Testing Services
- Physiochemical Testing Services
- Integrity Testing Services
- Compatibility Testing Services
- Others
Segmentation 3: by Process Component
- Filter Elements
- Media Containers and Bags
- Freezing And Thawing Process Bags
- Bioreactors
- Transfer Systems
- Others Process Component
Segmentation 4: by Region
- North America
- Europe
- Asia-Pacific
- Latin America
- Middle East & Africa
Key Questions Answered in this Report:
- 1. What constitutes the market share of bioprocess validation, and which industry is anticipated to experience growth in the next decade?
- 2. What opportunities are prevalent for producers in the bioprocess validation market share within North America?
- 3. Which factors serve as constraints impacting the expansion of the bioprocess validation market share market in North America?
- 4. How is the consumption of bioprocess validation market share influenced by emerging trends in production?
- 5. What end-user sector is propelling the growth in demand for bioprocess validation market share?
- 6. Which specific application of bioprocess validation market share is expected to maintain its significance?
- 7. What lies within the future scope and evolving trends of technologies in the global market?
- 8. Who are the prominent companies leading the global bioprocess validation market share?
Table of Contents
Executive Summary
Scope and Definition
1. Markets
- 1.1. Trends: Current and Future Impact Assessment
- 1.1.1. Sample Text
- 1.1.2. Trend 1
- 1.1.3. Trend 2
- 1.1.4. Trend 3
- 1.2. Supply Chain Overview
- 1.2.1. Value Chain Analysis
- 1.2.2. Market Map
- 1.3. Research and Development Review
- 1.3.1. Patent Filing Trend (by Country, Company)
- 1.4. Regulatory Landscape
- 1.5. Impact Analysis for Key Global Events- COVID- 19
- 1.6. Market Dynamics Overview
- 1.6.1. Market Drivers
- 1.6.2. Market Restraints
- 1.6.3. Market Opportunities
2. Application
- 2.1. Application Segmentation
- 2.2. Application Summary
- 2.3. Global Bioprocess Validation Market (by End User)
- 2.3.1. Pharmaceutical and Biotechnology Companies
- 2.3.2. Contract Development & Manufacturing Organizations
- 2.3.3. Others
3. Products
- 3.1. Product Segmentation
- 3.2. Product Summary
- 3.3. Global Bioprocess Validation Market- (by Product)
- 3.3.1. Market Overview
- 3.3.1.1. Analyst View
- 3.3.1. Market Overview
- 3.4. Global Bioprocess Validation Market (by Test Type)
- 3.4.1. Extractable and Leachable Testing Services
- 3.4.2. Microbiological Testing Services
- 3.4.3. Physiochemical Testing Services
- 3.4.4. Integrity Testing Services
- 3.4.5. Compatibility Testing Services
- 3.4.6. Others
- 3.5. Global Bioprocess Validation Market (by Process Component)
- 3.5.1. Filter Elements
- 3.5.2. Media Containers and Bags
- 3.5.3. Freezing And Thawing Process Bags
- 3.5.4. Bioreactors
- 3.5.5. Transfer Systems
- 3.5.6. Others Process Component
4. Regions
- 4.1. Regional Summary
- 4.2. Drivers and Restraints
- 4.3. North America
- 4.3.1. Regional Overview
- 4.3.2. Driving Factors for Market Growth
- 4.3.3. Factors Challenging the Market
- 4.3.4. Application
- 4.3.5. Product
- 4.3.6. U.S.
- 4.3.7. U.S. Bioprocess Validation Market by Application
- 4.3.8. Canada
- 4.3.9. Canada Bioprocess Validation Market by Application
- 4.4. Europe
- 4.4.1. Regional Overview
- 4.4.2. Driving Factors for Market Growth
- 4.4.3. Factors Challenging the Market
- 4.4.4. Application
- 4.4.5. Product
- 4.4.6. Germany
- 4.4.7. Germany Bioprocess Validation Market by Application
- 4.4.8. U.K.
- 4.4.9. U.K. Bioprocess Validation Market by Application
- 4.4.10. France
- 4.4.11. France Bioprocess Validation Market by Application
- 4.4.12. Italy
- 4.4.13. Italy Bioprocess Validation Market by Application
- 4.4.14. Spain
- 4.4.15. Spain Bioprocess Validation Market by Application
- 4.4.16. Rest of Europe
- 4.4.17. Rest of Europe Bioprocess Validation Market by Application
- 4.5. Asia Pacific
- 4.5.1. Regional Overview
- 4.5.2. Driving Factors for Market Growth
- 4.5.3. Factors Challenging the Market
- 4.5.4. Application
- 4.5.5. Product
- 4.5.6. China
- 4.5.7. China Bioprocess Validation Market by Application
- 4.5.8. Japan
- 4.5.9. Japan Bioprocess Validation Market by Application
- 4.5.10. South Korea
- 4.5.11. South Korea Bioprocess Validation Market by Application
- 4.5.12. Australia
- 4.5.13. Australia Bioprocess Validation Market by Application
- 4.5.14. India
- 4.5.15. India Bioprocess Validation Market by Application
- 4.5.16. Rest-of-Asia-Pacific
- 4.5.17. Rest-of-Asia-Pacific Bioprocess Validation Market by Application
- 4.6. Latin America
- 4.6.1. Regional Overview
- 4.6.2. Driving Factors for Market Growth
- 4.6.3. Factors Challenging the Market
- 4.6.4. Application
- 4.6.5. Product
- 4.6.6. Brazil
- 4.6.7. Brazil Bioprocess Validation Market by Application
- 4.6.8. Mexico
- 4.6.9. Mexico Bioprocess Validation Market by Application
- 4.6.10. Rest-of-Latin America
- 4.6.11. Rest-of-Latin America Bioprocess Validation Market by Application
- 4.7. Middle East & Africa
- 4.7.1. Regional Overview
- 4.7.2. Driving Factors for Market Growth
- 4.7.3. Factors Challenging the Market
- 4.7.4. Application
- 4.7.5. Product
5. Markets - Competitive Benchmarking & Company Profiles
- 5.1. Next Frontiers…..
- 5.2. Geographic Assessment
- 5.2.1. Merck KGgA
- 5.2.1.1. Overview
- 5.2.1.2. Top Products / Product Portfolio
- 5.2.1.3. Top Competitors
- 5.2.1.4. Target Customers
- 5.2.1.5. Key Personnel
- 5.2.1.6. Analyst View
- 5.2.1.7. Market Share
- 5.2.2. Sartorius AG
- 5.2.2.1. Overview
- 5.2.2.2. Top Products / Product Portfolio
- 5.2.2.3. Top Competitors
- 5.2.2.4. Target Customers
- 5.2.2.5. Key Personnel
- 5.2.2.6. Analyst View
- 5.2.2.7. Market Share
- 5.2.3. Eurofins Scientific
- 5.2.3.1. Overview
- 5.2.3.2. Top Products / Product Portfolio
- 5.2.3.3. Top Competitors
- 5.2.3.4. Target Customers
- 5.2.3.5. Key Personnel
- 5.2.3.6. Analyst View
- 5.2.3.7. Market Share
- 5.2.4. Thermo Fisher Scientific Inc.
- 5.2.4.1. Overview
- 5.2.4.2. Top Products / Product Portfolio
- 5.2.4.3. Top Competitors
- 5.2.4.4. Target Customers
- 5.2.4.5. Key Personnel
- 5.2.4.6. Analyst View
- 5.2.4.7. Market Share
- 5.2.5. Hangzhou Cobetter Filtration Equipment Co.,Ltd
- 5.2.5.1. Overview
- 5.2.5.2. Top Products / Product Portfolio
- 5.2.5.3. Top Competitors
- 5.2.5.4. Target Customers
- 5.2.5.5. Key Personnel
- 5.2.5.6. Analyst View
- 5.2.5.7. Market Share
- 5.2.6. Meissner Filtration Products, Inc.
- 5.2.6.1. Overview
- 5.2.6.2. Top Products / Product Portfolio
- 5.2.6.3. Top Competitors
- 5.2.6.4. Target Customers
- 5.2.6.5. Key Personnel
- 5.2.6.6. Analyst View
- 5.2.6.7. Market Share
- 5.2.7. Almac Group
- 5.2.7.1. Overview
- 5.2.7.2. Top Products / Product Portfolio
- 5.2.7.3. Top Competitors
- 5.2.7.4. Target Customers
- 5.2.7.5. Key Personnel
- 5.2.7.6. Analyst View
- 5.2.7.7. Market Share
- 5.2.8. Danaher Corporation
- 5.2.8.1. Overview
- 5.2.8.2. Top Products / Product Portfolio
- 5.2.8.3. Top Competitors
- 5.2.8.4. Target Customers
- 5.2.8.5. Key Personnel
- 5.2.8.6. Analyst View
- 5.2.8.7. Market Share
- 5.2.9. SGS Societe Generale de Surveillance SA.
- 5.2.9.1. Overview
- 5.2.9.2. Top Products / Product Portfolio
- 5.2.9.3. Top Competitors
- 5.2.9.4. Target Customers
- 5.2.9.5. Key Personnel
- 5.2.9.6. Analyst View
- 5.2.9.7. Market Share
- 5.2.10. Charles River Laboratories
- 5.2.10.1. Overview
- 5.2.10.2. Top Products / Product Portfolio
- 5.2.10.3. Top Competitors
- 5.2.10.4. Target Customers
- 5.2.10.5. Key Personnel
- 5.2.10.6. Analyst View
- 5.2.10.7. Market Share
- 5.2.11. Lonza
- 5.2.11.1. Overview
- 5.2.11.2. Top Products / Product Portfolio
- 5.2.11.3. Top Competitors
- 5.2.11.4. Target Customers
- 5.2.11.5. Key Personnel
- 5.2.11.6. Analyst View
- 5.2.11.7. Market Share
- 5.2.12. Labcorp Drug Development
- 5.2.12.1. Overview
- 5.2.12.2. Top Products / Product Portfolio
- 5.2.12.3. Top Competitors
- 5.2.12.4. Target Customers
- 5.2.12.5. Key Personnel
- 5.2.12.6. Analyst View
- 5.2.12.7. Market Share
- 5.2.13. BIOZEEN
- 5.2.13.1. Overview
- 5.2.13.2. Top Products / Product Portfolio
- 5.2.13.3. Top Competitors
- 5.2.13.4. Target Customers
- 5.2.13.5. Key Personnel
- 5.2.13.6. Analyst View
- 5.2.13.7. Market Share
- 5.2.14. WuXi Biologics
- 5.2.14.1. Overview
- 5.2.14.2. Top Products / Product Portfolio
- 5.2.14.3. Top Competitors
- 5.2.14.4. Target Customers
- 5.2.14.5. Key Personnel
- 5.2.14.6. Analyst View
- 5.2.14.7. Market Share
- 5.2.15. Pacific Biolabs
- 5.2.15.1. Overview
- 5.2.15.2. Top Products / Product Portfolio
- 5.2.15.3. Top Competitors
- 5.2.15.4. Target Customers
- 5.2.15.5. Key Personnel
- 5.2.15.6. Analyst View
- 5.2.15.7. Market Share
- 5.2.1. Merck KGgA
6. Research Methodology
- 6.1. Data Sources
- 6.1.1. Primary Data Sources
- 6.1.2. Secondary Data Sources
- 6.1.3. Data Triangulation
- 6.2. Market Estimation and Forecast