|
|
市場調査レポート
商品コード
1751661
水処理・廃水処理技術:世界市場Water and Wastewater Treatment Technologies: Global Markets |
||||||

|
|||||||
|
|||||||

| 水処理・廃水処理技術:世界市場 |
|
出版日: 2025年06月11日
発行: BCC Research
ページ情報: 英文 184 Pages
納期: 即納可能
|

全表示
- 概要
- 図表
- 目次
世界の水処理・廃水処理技術の市場規模は、2025年の3,507億米ドルから、2025年から2030年の予測期間中はCAGR 11.0%で推移し、2030年末には5,912億米ドルに達すると予測されています。
技術部門は、2025年の2,897億米ドルから、予測期間中に11.8%のCAGRで推移し、2030年末には5,067億米ドルに達すると予測されています。化学品の部門は、2025年の610億米ドルから、予測期間中はCAGR 6.7%で推移し、2030年末には846億米ドルに達すると予測されています。
当レポートでは、世界の水処理・廃水処理技術の市場を調査し、市場概要、市場影響因子および市場機会の分析、市場規模の推移・予測、各種区分・地域別の詳細分析などをまとめています。
目次
第1章 エグゼクティブサマリー
- 市場見通し
- 調査範囲
- 市場サマリー
- 技術の進歩と応用
- 市場力学と成長要因
- 将来の動向と発展
- セグメント分析
- 地域分析と新興市場
- 結論
第2章 市場概要
- 水処理・廃水処理の導入
第3章 市場力学
- 市場力学
- 促進要因
- 淡水資源の減少
- 規則
- 抑制要因と課題
- 新興汚染物質に対する水処理・廃水処理技術の非対応性
- 処理水に対する社会的受容の欠如
- 廃水処理施設の高エネルギー消費性
- 機会
- 栄養素回収
第4章 新興技術と開発動向
- モバイル水処理・廃水処理システム
- 水処理施設における再生可能エネルギーの統合
- 浮体型人工湿地
- 特許分析
- 調査手法
- 分析
第5章 市場セグメンテーション分析
- セグメンテーションの内訳
- 市場分析:提供区分別
- 主なハイライト
- 技術
- 市場分析:プロセス別
- 主なハイライト
- 一次処理
- 二次処理
- 三次処理
- 高度な処理
- 市場分析:エンドユーザー別
- 主なハイライト
- 自治体
- 産業
- 地理的内訳
- 市場分析:地域別
- 主なハイライト
- 北米
- アジア太平洋
- 欧州
- 中東・アフリカ
- 南米
第6章 競合情報
- 業界構造
- 市場シェア分析
- 戦略分析
第7章 水処理・廃水処理技術産業における持続可能性:ESGの観点
- 水処理・廃水処理技術業界におけるESGの重要性
- 水処理・廃水処理技術業界におけるESGの実践
- 水処理・廃水処理技術市場におけるESGの現状
- 結論
第8章 付録
- 調査手法
- 出典
- 略語
- 企業プロファイル
- 3M
- AQUATECH
- BASF
- DUPONT
- ECOLAB
- EGESIS
- KEMIRA
- KOVALUS SEPARATION SOLUTIONS
- KURARAY CO. LTD.
- PENTAIR
- PRAYON
- THERMAX LTD.
- VEOLIA
- WARTSILA
- XYLEM
List of Tables
- Summary Table : Global Market for Water and Wastewater Treatment Technologies, by Offering, Through 2030
- Table 1 : Top Countries with Freshwater Resources, 2025
- Table 2 : Key Regulations Regarding Water Pollution, 2025
- Table 3 : Water Organizations and Their Roles, 2025
- Table 4 : Waterborne Contaminants
- Table 5 : Patents in Wastewater Treatment, by Country, January 2023-March 2025
- Table 6 : Patents in Water Treatment, by Country, January 2023-March 2025
- Table 7 : Patents in Sewage Treatment, by Country, January 2023-March 2025
- Table 8 : Patents in Industrial Wastewater, by Country, January 2023-March 2025
- Table 9 : Patents in Wastewater Treatment, by Applicant, January 2023-March 2025
- Table 10 : Patents in Water Treatment, by Applicant, January 2023-March 2025
- Table 11 : Patents in Sewage Treatment, by Applicant, January 2023-March 2025
- Table 12 : Patents in Industrial Wastewater, by Applicant, January 2023-March 2025
- Table 13 : Patents in Water and Wastewater Treatment Technologies Market, January 2023-March 2025
- Table 14 : Global Market for Water and Wastewater Treatment Technologies, by Offering, Through 2030
- Table 15 : Membrane Filtration Technologies
- Table 16 : Global Market for Water and Wastewater Treatment Technologies in Technologies, by Region, Through 2030
- Table 17 : Global Market for Water and Wastewater Treatment Technologies in Filtration, by Region, Through 2030
- Table 18 : Global Market for Water and Wastewater Treatment Technologies in Particle Filtration, by Region, Through 2030
- Table 19 : Global Market for Water and Wastewater Treatment Technologies in Membrane Filtration, by Region, Through 2030
- Table 20 : Global Market for Water and Wastewater Treatment Technologies in Microfiltration, by Region, Through 2030
- Table 21 : Global Market for Water and Wastewater Treatment Technologies in Reverse Osmosis, by Region, Through 2030
- Table 22 : Global Market for Water and Wastewater Treatment Technologies in Ultrafiltration, by Region, Through 2030
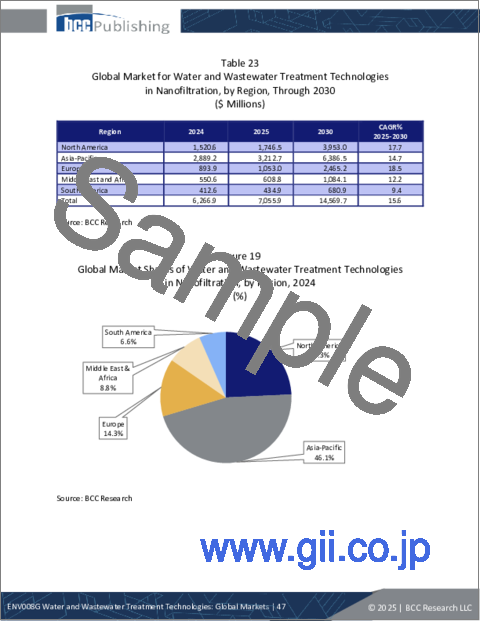
- Table 23 : Global Market for Water and Wastewater Treatment Technologies in Nanofiltration, by Region, Through 2030
- Table 24 : Global Market for Water and Wastewater Treatment Technologies in Other Membrane Filtration, by Region, Through 2030
- Table 25 : Global Market for Water and Wastewater Treatment Technologies in Disinfection, by Region, Through 2030
- Table 26 : Global Market for Water and Wastewater Treatment Technologies in Chlorine, by Region, Through 2030
- Table 27 : Global Market for Water and Wastewater Treatment Technologies in Ultraviolet, by Region, Through 2030
- Table 28 : Global Market for Water and Wastewater Treatment Technologies in Ozone, by Region, Through 2030
- Table 29 : Global Market for Water and Wastewater Treatment Technologies in Other Technologies, by Region, Through 2030
- Table 30 : Global Market for Water and Wastewater Treatment Technologies in Chemicals, by Region, Through 2030
- Table 31 : Global Market for Water and Wastewater Treatment Technologies in Coagulants, by Region, Through 2030
- Table 32 : Global Market for Water and Wastewater Treatment Technologies in Scale and Corrosion Inhibitors, by Region, Through 2030
- Table 33 : Global Market for Water and Wastewater Treatment Technologies in Flocculants, by Region, Through 2030
- Table 34 : Global Market for Water and Wastewater Treatment Technologies in Biocides, by Region, Through 2030
- Table 35 : Global Market for Water and Wastewater Treatment Technologies in Antifoaming Agents, by Region, Through 2030
- Table 36 : Global Market for Water and Wastewater Treatment Technologies in Chelating Agents, by Region, Through 2030
- Table 37 : Global Market for Water and Wastewater Treatment Technologies in Other Chemicals, by Region, Through 2030
- Table 38 : Global Market for Water and Wastewater Treatment Technologies, by Process, Through 2030
- Table 39 : Global Market for Water and Wastewater Treatment Technologies in Primary Process, by Region, Through 2030
- Table 40 : Global Market for Water and Wastewater Treatment Technologies in Secondary Process, by Region, Through 2030
- Table 41 : Global Market for Water and Wastewater Treatment Technologies in Tertiary Process, by Region, Through 2030
- Table 42 : Global Market for Water and Wastewater Treatment Technologies in Advanced Process, by Region, Through 2030
- Table 43 : Global Market for Water and Wastewater Treatment Technologies, by End User, Through 2030
- Table 44 : Global Market for Water and Wastewater Treatment Technologies in Municipal, by Region, Through 2030
- Table 45 : Global Market for Water and Wastewater Treatment Technologies, by Industry, Through 2030
- Table 46 : Global Market for Water and Wastewater Treatment Technologies in Industry, by Region, Through 2030
- Table 47 : Global Market for Water and Wastewater Treatment Technologies in the Chemical Industry, by Region, Through 2030
- Table 48 : Global Market for Water and Wastewater Treatment Technologies in the Power Industry, by Region, Through 2030
- Table 49 : Global Market for Water and Wastewater Treatment Technologies in the Food and Beverage Industry, by Region, Through 2030
- Table 50 : Global Market for Water and Wastewater Treatment Technologies in the Oil and Gas Industry, by Region, Through 2030
- Table 51 : Global Market for Water and Wastewater Treatment Technologies in the Paper and Pulp Industry, by Region, Through 2030
- Table 52 : Global Market for Water and Wastewater Treatment Technologies in the Pharmaceutical Industry, by Region, Through 2030
- Table 53 : Global Market for Water and Wastewater Treatment Technologies in the Semiconductor Industry, by Region, Through 2030
- Table 54 : Global Market for Water and Wastewater Treatment Technologies in Other Industries, by Region, Through 2030
- Table 55 : Global Market for Water and Wastewater Treatment Technologies, by Region, Through 2030
- Table 56 : North American Market for Water and Wastewater Treatment Technologies, by Offering, Through 2030
- Table 57 : North American Market for Water and Wastewater Treatment Technologies, by Process, Through 2030
- Table 58 : North American Market for Water and Wastewater Treatment Technologies, by End User, Through 2030
- Table 59 : North American Market for Water and Wastewater Treatment Technologies, by Country, Through 2030
- Table 60 : Asia-Pacific Market for Water and Wastewater Treatment Technologies, by Offering, Through 2030
- Table 61 : Asia-Pacific Market for Water and Wastewater Treatment Technologies, by Process, Through 2030
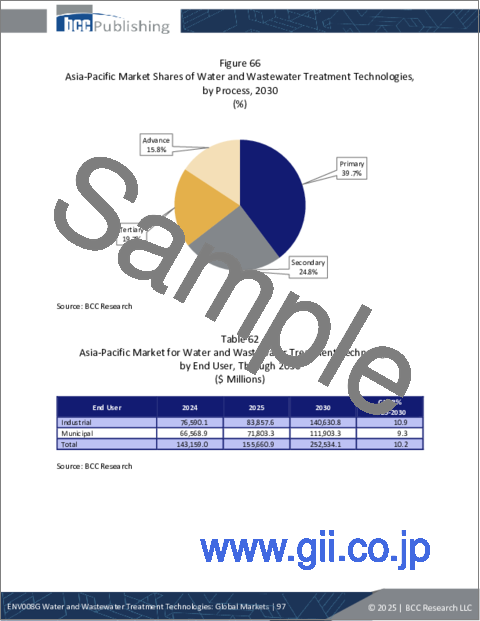
- Table 62 : Asia-Pacific Market for Water and Wastewater Treatment Technologies, by End User, Through 2030
- Table 63 : Asia-Pacific Market for Water and Wastewater Treatment Technologies, by Country, Through 2030
- Table 64 : European Market for Water and Wastewater Treatment Technologies, by Offering, Through 2030
- Table 65 : European Market for Water and Wastewater Treatment Technologies, by Process, Through 2030
- Table 66 : European Market for Water and Wastewater Treatment Technologies, by End User, Through 2030
- Table 67 : European Market for Water and Wastewater Treatment Technologies, by Country, Through 2030
- Table 68 : Middle Eastern and African Market for Water and Wastewater Treatment Technologies, by Offering, Through 2030
- Table 69 : Middle Eastern and African Market for Water and Wastewater Treatment Technologies, by Process, Through 2030
- Table 70 : Middle Eastern and African Market for Water and Wastewater Treatment Technologies, by End User, Through 2030
- Table 71 : Middle Eastern and African Market for Water and Wastewater Treatment Technologies, by Country, Through 2030
- Table 72 : South American Market for Water and Wastewater Treatment Technologies, by Offering, Through 2030
- Table 73 : South American Market for Water and Wastewater Treatment Technologies, by Process, Through 2030
- Table 74 : South American Market for Water and Wastewater Treatment Technologies, by End User, Through 2030
- Table 75 : South American Market for Water and Wastewater Treatment Technologies, by Country, Through 2030
- Table 76 : Leading Companies in the Market for Water and Wastewater Treatment, by Rank, 2024
- Table 77 : Key Developments in the Water and Wastewater Treatment Industry, 2023-2025
- Table 78 : ESG Diversity Issue Analysis
- Table 79 : ESG Employee Safety and Labor Practices Issue Analysis
- Table 80 : ESG Resource Efficiency and Emissions Issue Analysis
- Table 81 : ESG Waste Reduction Issue Analysis
- Table 82 : ESG Sustainable Supply Chain Analysis
- Table 83 : ESG Ethical Corporate Behavior Analysis
- Table 84 : ESG Company Score Cards, * 2024
- Table 85 : Report Sources
- Table 86 : Abbreviations Used in Water and Wastewater Treatment Technologies Market
- Table 87 : 3M: Company Snapshot
- Table 88 : 3M: Financial Performance, FY 2023 and 2024
- Table 89 : 3M: Product Portfolio
- Table 90 : Aquatech: Company Snapshot
- Table 91 : Aquatech: Product Portfolio
- Table 92 : Aquatech: Key Developments, 2023 and 2024
- Table 93 : BASF: Company Snapshot
- Table 94 : BASF: Financial Performance, FY 2023 and 2024
- Table 95 : BASF: Product Portfolio
- Table 96 : BASF: Key Development, 2023
- Table 97 : DuPont: Company Snapshot
- Table 98 : DuPont: Financial Performance, FY 2023 and 2024
- Table 99 : DuPont: Product Portfolio
- Table 100 : DuPont: Key Developments, 2024 and 2025
- Table 101 : Ecolab: Company Snapshot
- Table 102 : Ecolab: Financial Performance, FY 2023 and 2024
- Table 103 : Ecolab: Product Portfolio
- Table 104 : Ecolab: Key Developments, 2023 and 2024
- Table 105 : EGESIS: Company Snapshot
- Table 106 : EGESIS: Product Portfolio
- Table 107 : Kemira: Company Snapshot
- Table 108 : Kemira: Financial Performance, FY 2023 and 2024
- Table 109 : Kemira: Product Portfolio
- Table 110 : Kemira: Key Development, 2024
- Table 111 : Kovalus Separation Solutions: Company Snapshot
- Table 112 : Kovalus Separation Solutions: Product Portfolio
- Table 113 : Kovalus Separation Solutions: Key Developments, 2023 and 2024
- Table 114 : Kuraray Co. Ltd.: Company Snapshot
- Table 115 : Kuraray Co. Ltd.: Financial Performance, FY 2023 and 2024
- Table 116 : Kuraray Co. Ltd.: Product Portfolio
- Table 117 : Kuraray Co. Ltd.: Key Developments, 2024
- Table 118 : Pentair: Company Snapshot
- Table 119 : Pentair: Financial Performance, FY 2023 and 2024
- Table 120 : Pentair: Product Portfolio
- Table 121 : Prayon: Company Snapshot
- Table 122 : Prayon: Product Portfolio
- Table 123 : Thermax Ltd.: Company Snapshot
- Table 124 : Thermax Ltd.: Financial Performance, FY 2022 and 2023
- Table 125 : Thermax Ltd.: Product Portfolio
- Table 126 : Thermax Ltd.: Key Developments, 2024 and 2025
- Table 127 : Veolia: Company Snapshot
- Table 128 : Veolia: Financial Performance, FY 2023 and 2024
- Table 129 : Veolia: Product Portfolio
- Table 130 : Veolia: Key Developments, 2025
- Table 131 : Wartsila: Company Snapshot
- Table 132 : Wartsila: Financial Performance, FY 2023 and 2024
- Table 133 : Wartsila: Product Portfolio
- Table 134 : Wartsila: Key Developments, 2024
- Table 135 : Xylem: Company Snapshot
- Table 136 : Xylem: Financial Performance, FY 2023 and 2024
- Table 137 : Xylem: Product Portfolio
- Table 138 : Xylem: Key Development, 2023
List of Figures
- Summary Figure : Global Market Shares of Water and Wastewater Treatment Technologies, by Offering, 2024
- Figure 1 : Wastewater Treatment Process
- Figure 2 : Global Wastewater Treatment Plant Distribution, by Treatment Level, 2021*
- Figure 3 : Market Dynamics of Water and Wastewater Treatment Technologies
- Figure 4 : Water Withdrawal, by Sector and Income Group, 2025
- Figure 5 : Top Five Phosphate Rock Reserve Countries, 2024
- Figure 6 : Patents in Wastewater Treatment, by Year Issued, January 2023-March 2025
- Figure 7 : Patents in Water Treatment, by Year Issued, January 2023-March 2025
- Figure 8 : Patents in Sewage Treatment, by Year Issued, January 2023-March 2025
- Figure 9 : Patents in Industrial Wastewater, by Year Issued, January 2023-March 2025
- Figure 10 : Global Market Shares of Water and Wastewater Treatment Technologies, by Offering, 2024
- Figure 11 : Global Market Shares of Water and Wastewater Treatment Technologies, by Offering, 2030
- Figure 12 : Global Market Shares of Water and Wastewater Treatment Technologies in Technologies, by Region, 2024
- Figure 13 : Global Market Shares of Water and Wastewater Treatment Technologies in Filtration, by Region, 2024
- Figure 14 : Global Market Shares of Water and Wastewater Treatment Technologies in Particle Filtration, by Region, 2024
- Figure 15 : Global Market Shares of Water and Wastewater Treatment Technologies in Membrane Filtration, by Region, 2024
- Figure 16 : Global Market Shares of Water and Wastewater Treatment Technologies in Microfiltration, by Region, 2024
- Figure 17 : Global Market Shares of Water and Wastewater Treatment Technologies in Reverse Osmosis, by Region, 2024
- Figure 18 : Global Market Shares of Water and Wastewater Treatment Technologies in Ultrafiltration, by Region, 2024
- Figure 19 : Global Market Shares of Water and Wastewater Treatment Technologies in Nanofiltration, by Region, 2024
- Figure 20 : Global Market Shares of Water and Wastewater Treatment Technologies in Other Membrane Filtration, by Region, 2024
- Figure 21 : Global Market Shares of Water and Wastewater Treatment Technologies in Disinfection, by Region, 2024
- Figure 22 : Global Market Shares of Water and Wastewater Treatment Technologies in Chlorine, by Region, 2024
- Figure 23 : Global Market Shares of Water and Wastewater Treatment Technologies in Ultraviolet, by Region, 2024
- Figure 24 : Global Market Shares of Water and Wastewater Treatment Technologies in Ozone, by Region, 2024
- Figure 25 : Global Market Shares of Water and Wastewater Treatment Technologies in Other Technologies, by Region, 2024
- Figure 26 : Global Market Shares of Water and Wastewater Treatment Technologies in Chemicals, by Region, 2024
- Figure 27 : Global Market Shares of Water and Wastewater Treatment Technologies in Coagulants, by Region, 2024
- Figure 28 : Global Market Shares of Water and Wastewater Treatment Technologies in Scale and Corrosion Inhibitors, by Region, 2024
- Figure 29 : Global Market Shares of Water and Wastewater Treatment Technologies in Flocculants, by Region, 2024
- Figure 30 : Global Market Shares of Water and Wastewater Treatment Technologies in Biocides, by Region, 2024
- Figure 31 : Global Market Shares of Water and Wastewater Treatment Technologies in Antifoaming Agents, by Region, 2024
- Figure 32 : Global Market Shares of Water and Wastewater Treatment Technologies in Chelating Agents, by Region, 2024
- Figure 33 : Global Market Shares of Water and Wastewater Treatment Technologies in Other Chemicals, by Region, 2024
- Figure 34 : Global Market Shares of Water and Wastewater Treatment Technologies, by Process, 2024
- Figure 35 : Global Market Shares of Water and Wastewater Treatment Technologies, by Process, 2030
- Figure 36 : Global Market Shares of Water and Wastewater Treatment Technologies in Primary Process, by Region, 2024
- Figure 37 : Global Market Shares of Water and Wastewater Treatment Technologies in Secondary Process, by Region, 2024
- Figure 38 : Global Market Shares of Water and Wastewater Treatment Technologies in Tertiary Process, by Region, 2024
- Figure 39 : Global Market Shares of Water and Wastewater Treatment Technologies in Advanced Process, by Region, 2024
- Figure 40 : Global Market Shares of Water and Wastewater Treatment Technologies, by End User, 2024
- Figure 41 : Global Market Shares of Water and Wastewater Treatment Technologies, by End User, 2030
- Figure 42 : Global Market Shares of Water and Wastewater Treatment Technologies in Municipal, by Region, 2024
- Figure 43 : Global Market Shares of Water and Wastewater Treatment Technologies, by Industry, 2024
- Figure 44 : Global Market Shares of Water and Wastewater Treatment Technologies in Industry, by Region, 2024
- Figure 45 : Global Market Shares of Water and Wastewater Treatment Technologies in the Chemical Industry, by Region, 2024
- Figure 46 : Global Market Shares of Water and Wastewater Treatment Technologies in the Power Industry, by Region, 2024
- Figure 47 : Global Market Shares of Water and Wastewater Treatment Technologies in the Food and Beverage Industry, by Region, 2024
- Figure 48 : Global Market Shares of Water and Wastewater Treatment Technologies in the Oil and Gas Industry, by Region, 2024
- Figure 49 : Global Market Shares of Water and Wastewater Treatment Technologies in the Paper and Pulp Industry, by Region, 2024
- Figure 50 : Global Market Shares of Water and Wastewater Treatment Technologies in the Pharmaceutical Industry, by Region, 2024
- Figure 51 : Global Market Shares of Water and Wastewater Treatment Technologies in the Semiconductor Industry, by Region, 2024
- Figure 52 : Global Market Shares of Water and Wastewater Treatment Technologies in Other Industries, by Region, 2024
- Figure 53 : Global Market Shares of Water and Wastewater Treatment Technologies, by Region, 2024
- Figure 54 : Global Market Shares of Water and Wastewater Treatment Technologies, by Region, 2030
- Figure 55 : North American Market Shares of Water and Wastewater Treatment Technologies, by Offering, 2024
- Figure 56 : North American Market Shares of Water and Wastewater Treatment Technologies, by Offering, 2030
- Figure 57 : North American Market Shares of Water and Wastewater Treatment Technologies, by Process, 2024
- Figure 58 : North American Market Shares of Water and Wastewater Treatment Technologies, by Process, 2030
- Figure 59 : North American Market Shares of Water and Wastewater Treatment Technologies, by End User, 2024
- Figure 60 : North American Market Shares of Water and Wastewater Treatment Technologies, by End User, 2030
- Figure 61 : North American Market Shares of Water and Wastewater Treatment Technologies, by Country, 2024
- Figure 62 : North American Market Shares of Water and Wastewater Treatment Technologies, by Country, 2030
- Figure 63 : Asia-Pacific Market Shares of Water and Wastewater Treatment Technologies, by Offerings, 2024
- Figure 64 : Asia-Pacific Market Shares of Water and Wastewater Treatment Technologies, by Offerings, 2030
- Figure 65 : Asia-Pacific Market Shares of Water and Wastewater Treatment Technologies, by Process, 2024
- Figure 66 : Asia-Pacific Market Shares of Water and Wastewater Treatment Technologies, by Process, 2030
- Figure 67 : Asia-Pacific Market Shares of Water and Wastewater Treatment Technologies, by End User, 2024
- Figure 68 : Asia-Pacific Market Shares of Water and Wastewater Treatment Technologies, by End User, 2030
- Figure 69 : Asia-Pacific Market Shares of Water and Wastewater Treatment Technologies, by Country, 2024
- Figure 70 : Asia-Pacific Market Shares of Water and Wastewater Treatment Technologies, by Country, 2030
- Figure 71 : European Market Shares of Water and Wastewater Treatment Technologies, by Offering, 2024
- Figure 72 : European Market Shares of Water and Wastewater Treatment Technologies, by Offering, 2030
- Figure 73 : European Market Shares of Water and Wastewater Treatment Technologies, by Process, 2024
- Figure 74 : European Market Shares of Water and Wastewater Treatment Technologies, by Process, 2030
- Figure 75 : European Market Shares of Water and Wastewater Treatment Technologies, by End User, 2024
- Figure 76 : European Market Shares of Water and Wastewater Treatment Technologies, by End User, 2030
- Figure 77 : European Market Shares of Water and Wastewater Treatment Technologies, by Country, 2024
- Figure 78 : European Market Shares of Water and Wastewater Treatment Technologies, by Country, 2030
- Figure 79 : Middle Eastern and African Market Shares of Water and Wastewater Treatment Technologies, by Offering, 2024
- Figure 80 : Middle Eastern and African Market Shares of Water and Wastewater Treatment Technologies, by Offering, 2030
- Figure 81 : Middle Eastern and African Market Shares of Water and Wastewater Treatment Technologies, by Process, 2024
- Figure 82 : Middle Eastern and African Market Shares of Water and Wastewater Treatment Technologies, by Process, 2030
- Figure 83 : Middle Eastern and African Market Shares of Water and Wastewater Treatment Technologies, by End User, 2024
- Figure 84 : Middle Eastern and African Market Shares of Water and Wastewater Treatment Technologies, by End User, 2030
- Figure 85 : Middle Eastern and African Market Shares of Water and Wastewater Treatment Technologies, by Country, 2024
- Figure 86 : Middle Eastern and African Market Shares of Water and Wastewater Treatment Technologies, by Country, 2030
- Figure 87 : South American Market Shares of Water and Wastewater Treatment Technologies, by Offering, 2024
- Figure 88 : South American Market Shares of Water and Wastewater Treatment Technologies, by Offering, 2030
- Figure 89 : South American Market Shares of Water and Wastewater Treatment Technologies, by Process, 2024
- Figure 90 : South American Market Shares of Water and Wastewater Treatment Technologies, by Process, 2030
- Figure 91 : South American Market Shares of Water and Wastewater Treatment Technologies, by End User, 2024
- Figure 92 : South American Market Shares of Water and Wastewater Treatment Technologies, by End User, 2030
- Figure 93 : South American Market Shares of Water and Wastewater Treatment Technologies, by Country, 2024
- Figure 94 : South American Market Shares of Water and Wastewater Treatment Technologies, by Country, 2030
- Figure 95 : ESG Overview of Water and Wastewater Treatment Technologies Market
- Figure 96 : Research Methodology: Top-Down Approach
- Figure 97 : 3M: Revenue Shares, by Business Unit, FY 2024 (%)139
- Figure 98 : 3M: Revenue Shares, by Region, FY 2024 (%)139
- Figure 99 : BASF: Revenue Shares, by Business Unit, FY 2024
- Figure 100 : BASF: Revenue Shares, by Region, FY 2024
- Figure 101 : DUPONT: Revenue Shares, by Business Unit, FY 2024
- Figure 102 : DUPONT: Revenue Shares, by Region, FY 2024
- Figure 103 : ECOLAB: Revenue Shares, by Business Unit, FY 2024
- Figure 104 : ECOLAB: Revenue Shares, by Region, FY 2024
- Figure 105 : KEMIRA: Revenue Shares, by Business Unit, FY 2024
- Figure 106 : KEMIRA: Revenue Shares, by Region, FY 2024
- Figure 107 : Kuraray Co. Ltd.: Revenue Shares, by Business Unit, FY 2024
- Figure 108 : Kuraray Co. Ltd.: Revenue Shares, by Region, FY 2024
- Figure 109 : PENTAIR: Revenue Shares, by Business Unit, FY 2024
- Figure 110 : PENTAIR: Revenue Shares, by Region, FY 2024
- Figure 111 : Thermax Ltd.: Revenue Shares, by Business Unit, FY 2023
- Figure 112 : Thermax Ltd.: Revenue Shares, by Region, FY 2023
- Figure 113 : VEOLIA: Revenue Shares, by Business Unit, FY 2024
- Figure 114 : VEOLIA: Revenue Shares, by Region, FY 2024
- Figure 115 : WARTSILA: Revenue Shares, by Business Unit, FY 2024
- Figure 116 : WARTSILA: Revenue Shares, by Region, FY 2024
- Figure 117 : XYLEM: Revenue Shares, by Business Unit, FY 2024
- Figure 118 : XYLEM: Revenue Shares, by Region, FY 2024
The global market for water and wastewater treatment technologies is expected to grow from $350.7 billion in 2025 and is projected to reach $591.2 billion by the end of 2030, at a compound annual growth rate (CAGR) of 11.0% during the forecast period of 2025 to 2030.
The market for technologies segment of water and wastewater treatment technologies is expected to grow from $289.7 billion in 2025 and is projected to reach $506.7 billion by the end of 2030, at a CAGR of 11.8% during the forecast period of 2025 to 2030.
The market for chemicals segment of water and wastewater treatment technologies is expected to grow from $61.0 billion in 2025 and is projected to reach $84.6 billion by the end of 2030, at a CAGR of 6.7% during the forecast period of 2025 to 2030.
Report Scope
This report provides a detailed market analysis of the water and wastewater treatment technologies and global markets to reflect the latest trends and data. The report's market study is for the period from 2024 through 2030. The base year of the analysis is 2024, with 2025 through 2030 serving as the forecast period. The revenue calculated in this report is in $ millions. This report is an in-depth analysis of the water and wastewater treatment technologies industry in a qualitative and quantitative manner. The market is segmented by:
- By offerings: Technologies and chemicals.
- By process: Primary, secondary, tertiary and advance.
- By end user: Municipal and industrial.
Report Includes
- 81 data tables and 58 additional tables
- Analyses of the trends in the global markets for water and wastewater treatment technologies, with revenue data from 2024, estimates for 2025, and projected CAGRs through 2029
- Estimates of the size and revenue prospects for the global market, along with a market share analysis by business offering, treatment process, end user and region
- Facts and figures pertaining to the market dynamics, advances in treatment technologies, regulations, and the impacts of macroeconomic variables
- Insights derived from the Porter's Five Forces model, as well as global supply chain and PESTLE analyses
- A look at the stringent regulatory norms and updates imposed by governments for the discharge and disposal of wastewaters and their treatment processes
- Identification of companies best positioned to meet the demand for demand/supply of wastewater treatment equipment, chemicals and services due to their proprietary technologies, mergers and acquisitions, strategic alliances and/or other demographic shifts in the industry
- An analysis of patents, and emerging trends and developments in patent activity
- Overview of sustainability trends and ESG developments, with emphasis on consumer attitudes, and the ESG scores and practices of leading companies
- Analysis of the industry structure, including companies' market shares and rankings, strategic alliances, M&A activity and a venture funding outlook
- Company profiles, including Veolia Group, Ecolab, Xylem, DuPont de Nemours Inc., and Kemira
Table of Contents
Chapter 1 Executive Summary
- Market Outlook
- Scope of Report
- Market Summary
- Technological Advances and Applications
- Market Dynamics and Growth Factors
- Future Trends and Developments
- Segmental Analysis
- Regional Insights and Emerging Markets
- Conclusion
Chapter 2 Market Overview
- Introduction of Water and Wastewater Treatment
Chapter 3 Market Dynamics
- Market Dynamics
- Drivers
- Decline in Freshwater Resources
- Regulations
- Restraints and Challenges
- Incompatibility of Water and Wastewater Treatment Technologies to Trace Emerging Contaminants
- Lack of Social Acceptance of Treated Water
- Energy Intensive Nature of Wastewater Treatment Plants
- Opportunity
- Nutrient Recovery
Chapter 4 Emerging Technologies and Developments
- Mobile Water and Wastewater Treatment
- Integration of Renewable Energy in Water Treatment Plants
- Floating Rafter Wetlands
- Patent Analysis
- Methodology
- Analysis
Chapter 5 Market Segmentation Analysis
- Segmentation Breakdown
- Market Analysis by Offering
- Key Highlights
- Technologies
- Market Analysis by Process
- Key Highlights
- Primary Treatment
- Secondary Treatment
- Tertiary Treatment
- Advanced Treatment
- Market Analysis by End User
- Key Highlights
- Municipal
- Industrial
- Geographic Breakdown
- Market Breakdown by Region
- Key Highlights
- North America
- Asia-Pacific
- Europe
- Middle East and Africa
- South America
Chapter 6 Competitive Intelligence
- Industry Structure
- Market Share Analysis
- Strategic Analysis
Chapter 7 Sustainability in Water and Wastewater Treatment Technologies Industry: An ESG Perspective
- Importance of ESG in the Water and Wastewater Treatment Technologies Industry
- ESG Practices in the Water and Wastewater Treatment Technologies Industry
- Current Status of ESG in the Water and Wastewater Treatment Technologies Market
- Conclusion
Chapter 8 Appendix
- Methodology
- Sources
- Abbreviations
- Company Profiles
- 3M
- AQUATECH
- BASF
- DUPONT
- ECOLAB
- EGESIS
- KEMIRA
- KOVALUS SEPARATION SOLUTIONS
- KURARAY CO. LTD.
- PENTAIR
- PRAYON
- THERMAX LTD.
- VEOLIA
- WARTSILA
- XYLEM

