|
|
市場調査レポート
商品コード
1471870
石油・ガス産業向けAI:世界市場と各種技術AI in Oil and Gas: Global Markets and Technologies |
||||||

|
|||||||
|
|||||||

| 石油・ガス産業向けAI:世界市場と各種技術 |
|
出版日: 2024年04月25日
発行: BCC Research
ページ情報: 英文 120 Pages
納期: 即納可能
|

全表示
- 概要
- 図表
- 目次
世界の石油・ガス産業向けAIの市場規模は、2023年の28億米ドルから、予測期間中は12.9%のCAGRで推移し、2028年には51億米ドルの規模に成長すると予測されています。
北米地域の市場規模は、2023年の9億7,920万米ドルから、同期間中は12.3%のCAGRで推移し、2028年には17億米ドルに達すると予測されています。アジア太平洋市場の規模は、2023年の8億3,660万米ドルから、CAGR 13.9%で推移し、2028年には16億米ドルに達すると予測されています。
当レポートでは、世界の石油・ガス産業向けAIの市場を調査し、市場概要、法規制環境、市場影響因子および市場機会の分析、市場規模の推移・予測、各種区分・地域別の詳細分析、競合情勢、主要企業のプロファイルなどをまとめています。
目次
第1章 エグゼクティブサマリー
- 市場の展望
- 調査範囲
- 市場サマリー
第2章 市場概要
- 概要
- AI統合に影響を与える規制と政策の枠組み
- 今後の展望
- バリューチェーン分析
- プラットフォームプロバイダー
- エージェント/アプリケーション開発者
- ソリューションプロバイダー
- エンドユーザー
- ポーターのファイブフォース分析
- 地政学的およびその他の動向
第3章 市場力学
- 概要
- 市場促進要因
- 高度な画像化と調査
- 市場競争力の向上
- 業務効率の向上
- 運用コストの削減
- 市場抑制要因
- データの品質と可用性
- スキルの不足と労働力の移行
- 市場機会
- 業界の課題に対応するカスタマイズされたAIソリューション
第4章 新興技術と開発
- 概要
- 現在の市場動向
- デジタルツインとシミュレーション
- クラウドベースのAIソリューション
- 新興技術
- エッジAI
- Explainable AI (XAI)
- 量子コンピューティング
- デジタルスレッド
- 生体認証セキュリティソリューション
- 特許分析
- 地理的パターン
- 主な調査結果
第5章 市場分析:各種区分別
- 分類の内訳
- 市場内訳:コンポーネント別
- 概要
- ソフトウェア
- サービス
- ハードウェア
- 市場内訳:用途別
- 概要
- 上流
- 中流
- 下流
- サポート機能
- 市場内訳:地域別
- 概要
- 北米
- 欧州
- アジア太平洋
- その他の地域
第6章 競合情報
- 市場シェア分析
第7章 環境・社会・ガバナンス (ESG) の観点
- 概要
- 石油・ガス産業向けAI市場におけるESGパフォーマンス
- 環境への影響
- 社会的影響
- ガバナンスの影響
- 石油・ガス産業向けAI市場におけるESGの現状
- 石油・ガス産業向けAI市場におけるESGに対する消費者の意識
- BCCによる見解
第8章 付録
- 調査手法
- 参考文献
- 企業プロファイル
- ABB
- ACCENTURE
- ASPEN TECHNOLOGY INC.
- CISCO SYSTEMS INC.
- EY
- FUGENX TECHNOLOGIES
- GENERAL ELECTRIC
- HONEYWELL INTERNATIONAL INC.
- IBM CORP.
- INTEL CORP.
- MICROSOFT CORP.
- ORACLE
- SCHNEIDER ELECTRIC
- SPARKCOGNITION
List of Tables
- Summary Table : Global Market for AI Technology in the Oil and Gas Sector, by Region, Through 2028
- Table 1 : Porter's Five Forces: Rating Scale
- Table 2 : Globally Published Patents on AI Technology in the Oil and Gas Sector, 2022-2023
- Table 3 : Global Market for AI Technology in the Oil and Gas Sector, by Component, Through 2028
- Table 4 : Global Market for AI Software in the Oil and Gas Sector, by Region, Through 2028
- Table 5 : Global Market for AI Services in the Oil and Gas Sector, by Region, Through 2028
- Table 6 : Global Market for AI Hardware in the Oil and Gas Sector, by Region, Through 2028
- Table 7 : Global Market for AI in the Oil and Gas Sector, by Application, Through 2028
- Table 8 : Global Market for AI in Upstream Applications in the Oil and Gas Sector, by Region, Through 2028
- Table 9 : Global Market for AI in Midstream Applications in the Oil and Gas Sector, by Region, Through 2028
- Table 10 : Global Market for AI in Downstream Applications in the Oil and Gas Sector, by Region, Through 2028
- Table 11 : Global Market for AI in Support Functional Applications in the Oil and Gas Sector, by Region, Through 2028
- Table 12 : Global Market for AI in the Oil and Gas Sector, by Region, Through 2028
- Table 13 : North American Market for AI in the Oil and Gas Sector, by Component, Through 2028
- Table 14 : North American Market for AI in the Oil and Gas Sector, by Application, Through 2028
- Table 15 : European Market for AI in the Oil and Gas Sector, by Component, Through 2028
- Table 16 : European Market for AI in the Oil and Gas Sector, by Application, Through 2028
- Table 17 : Asia-Pacific Market for AI in the Oil and Gas Sector, by Component, Through 2028
- Table 18 : Asia-Pacific Market for AI in the Oil and Gas Sector, by Application, Through 2028
- Table 19 : Rest of the World Market for AI in the Oil and Gas Sector, by Sub-Region, Through 2028
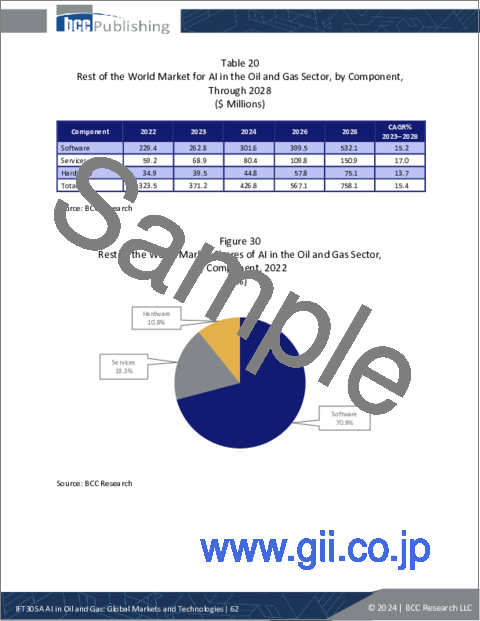
- Table 20 : Rest of the World Market for AI in the Oil and Gas Sector, by Component, Through 2028
- Table 21 : Rest of the World Market for AI in the Oil and Gas Sector, by Application, Through 2028
- Table 22 : ESG Risk Ratings Metric, by Company, 2022
- Table 23 : Acronyms Used in This Report
- Table 24 : ABB: Company Snapshot
- Table 25 : ABB: Financial Performance, FY 2022 and 2023
- Table 26 : ABB: Product Portfolio
- Table 27 : Accenture: Company Snapshot
- Table 28 : Accenture: Financial Performance, FY 2022 and 2023
- Table 29 : Accenture: Product Portfolio
- Table 30 : Aspen Technology Inc.: Company Snapshot
- Table 31 : Aspen Technology Inc.: Financial Performance, FY 2022 and 2023
- Table 32 : Aspen Technology Inc.: Product Portfolio
- Table 33 : Cisco Systems Inc.: Company Snapshot
- Table 34 : Cisco Systems Inc.: Financial Performance, FY 2022 and 2023
- Table 35 : Cisco Systems Inc.: Product Portfolio
- Table 36 : EY: Company Snapshot
- Table 37 : EY: Financial Performance, FY 2022 and 2023
- Table 38 : EY: Product Portfolio
- Table 39 : FuGenX Technologies: Company Snapshot
- Table 40 : Fugenx Technologies: Product Portfolio
- Table 41 : General Electric: Company Snapshot
- Table 42 : General Electric: Financial Performance, FY 2022 and 2023
- Table 43 : General Electric: Product Portfolio
- Table 44 : Honeywell International Inc.: Company Snapshot
- Table 45 : Honeywell International Inc.: Financial Performance, FY 2022 and 2023
- Table 46 : Honeywell International Inc.: Product Portfolio
- Table 47 : IBM Corp.: Company Snapshot
- Table 48 : IBM Corp.: Financial Performance, FY 2022 and 2023
- Table 49 : IBM Corp.: Product Portfolio
- Table 50 : Intel Corp.: Company Snapshot
- Table 51 : Intel Corp.: Financial Performance, FY 2022 and 2023
- Table 52 : Intel Corp.: Product Portfolio
- Table 53 : Microsoft Corp.: Company Snapshot
- Table 54 : Microsoft Corp.: Financial Performance, 2022 and 2023
- Table 55 : Microsoft Corp.: Product Portfolio
- Table 56 : Oracle: Company Snapshot
- Table 57 : Oracle Corp.: Financial Performance, FY 2022 and 2023
- Table 58 : Oracle: Product Portfolio
- Table 59 : Schneider Electric: Company Snapshot
- Table 60 : Schneider Electric: Financial Performance, FY 2021 and 2022
- Table 61 : Schneider Electric: Product Portfolio
- Table 62 : Sparkcognition: Company Snapshot
- Table 63 : Sparkcognition: Product Portfolio
List of Figures
- Summary Figure : Global Market Shares of AI Technology in the Oil and Gas Sector, by Region, 2022
- Figure 1 : Global AI Technology Value Chain in the Oil and Gas Sector
- Figure 2 : Porter's Five Forces Analysis: Overview
- Figure 3 : Porter's Five Forces Analysis
- Figure 4 : Bargaining Power of Suppliers
- Figure 5 : Bargaining Power of Consumers
- Figure 6 : Threat of New Entrants
- Figure 7 : Competition in the Industry
- Figure 8 : Market Dynamics of AI in Oil and Gas Market
- Figure 9 : Emerging Technologies in the Market for AI in the Oil and Gas Sector
- Figure 10 : Shares of Published Patents and Patent Applications on AI in the Oil and Gas Sector, by Applicants in Key Countries, 2022-2023
- Figure 11 : Global Market Shares of AI Technology in the Oil and Gas Sector, by Component, 2022
- Figure 12 : Global Market Shares of AI Software in the Oil and Gas Sector, by Region, 2022
- Figure 13 : Global Market Shares of AI Services in the Oil and Gas Sector, by Region, 2022
- Figure 14 : Global Market Shares of AI Hardware in the Oil and Gas Sector, by Region, 2022
- Figure 15 : Global Market Shares of AI in the Oil and Gas Sector, by Application, 2022
- Figure 16 : Global Market Shares of AI in Upstream Applications in the Oil and Gas Sector, by Region, 2022
- Figure 17 : Global Market Shares of AI in Midstream Applications in the Oil and Gas Sector, by Region, 2022
- Figure 18 : Global Market Shares of AI in Downstream Applications in the Oil and Gas Sector, by Region, 2022
- Figure 19 : Global Market Shares of AI in Support Functional Applications in the Oil and Gas Sector, by Region, 2022
- Figure 20 : Global Market Shares of AI in the Oil and Gas Sector, by Region, 2022
- Figure 21 : U.S. Gas and Oil Production, 2023
- Figure 22 : North American Annual Liquefied Natural Gas Export Capacity, by Project, 2016-2027
- Figure 23 : North American Market Shares of AI in the Oil and Gas Sector, by Component, 2022
- Figure 24 : North American Market Shares of AI in the Oil and Gas Sector, by Application, 2022
- Figure 25 : European Market Shares of AI in the Oil and Gas Sector, by Component, 2022
- Figure 26 : European Market Shares of AI in the Oil and Gas Sector, by Application, 2022
- Figure 27 : Asia-Pacific Market Shares of AI in the Oil and Gas Sector, by Component, 2022
- Figure 28 : Asia-Pacific Market Shares of AI in the Oil and Gas Sector, by Application, 2022
- Figure 29 : Rest of the World Market Shares of AI in the Oil and Gas Sector, by Sub-Region, 2022
- Figure 30 : Rest of the World Market Shares of AI in the Oil and Gas Sector, by Component, 2022
- Figure 31 : Rest of the World Market Shares of AI in the Oil and Gas Sector, by Application, 2022
- Figure 32 : Market Shares of the Top AI Solution Providers for Oil and Gas Sector, 2022
- Figure 33 : ABB: Revenue Share, by Business Unit, FY 2023
- Figure 34 : ABB: Revenue Share, by Region, FY 2023
- Figure 35 : Accenture: Revenue Share, by Industry Groups, 2023
- Figure 36 : Accenture: Revenue Share, by Region, 2023
- Figure 37 : Aspen Technology Inc.: Revenue Share, by Business Segment, 2023
- Figure 38 : Aspen Technology Inc.: Revenue Share, by Region, 2023
- Figure 39 : Cisco Systems Inc.: Revenue Share, by Segment, FY 2023
- Figure 40 : Cisco Systems Inc.: Revenue Share, by Region, FY 2023
- Figure 41 : EY: Revenue Share, by Business Segment, 2022
- Figure 42 : EY: Revenue Share, by Region, 2022
- Figure 43 : General Electric: Revenue Share, by Reportable Segments, FY 2023
- Figure 44 : General Electric: Revenue Share, by Region, FY 2023
- Figure 45 : Honeywell International Inc.: Revenue Share, by Segment, FY 2023
- Figure 46 : Honeywell International Inc.: Revenue Share, by Region, FY 2023
- Figure 47 : IBM Corp.: Revenue Share, by Reportable Segment, FY 2023
- Figure 48 : IBM Corp.: Revenue Share, by Region, FY 2023
- Figure 49 : Intel Corp.: Revenue Share, by Operating Segment, 2023
- Figure 50 : Intel Corp.: Revenue Share, by Region, 2023
- Figure 51 : Microsoft Corp.: Revenue Share, by Segment, 2023
- Figure 52 : Microsoft Corp.: Revenue Share, by Region, 2023
- Figure 53 : Oracle Corp.: Revenue Share, by Business Segment, 2023
- Figure 54 : Oracle Corp.: Revenue Share, by Region, 2023
- Figure 55 : Schneider Electric: Revenue Share, by Segment, FY 2022
- Figure 56 : Schneider Electric: Revenue Share, by Region, FY 2022
The global market for AI Technology in the Oil and Gas Sector is estimated to increase from $2.8 billion in 2023 to reach $5.1 billion by 2028, at a compound annual growth rate (CAGR) of 12.9% from 2023 through 2028.
The North American market for AI Technology in the Oil and Gas Sector is estimated to increase from $979.2 million in 2023 to reach $1.7 billion by 2028, at a CAGR of 12.3% from 2023 through 2028.
The Asia-Pacific market for AI Technology in the Oil and Gas Sector is estimated to increase from $836.6 million in 2023 to reach $1.6 billion by 2028, at a CAGR of 13.9% from 2023 through 2028.
Report Scope
The scope of this study encompasses the analysis of various components of AI technology in the global oil and gas sector, which include software, services, and hardware. It also examines different applications within the industry, such as upstream, midstream, downstream, and support functions. Additionally, the report discusses the technological, regulatory, and competitive aspects, as well as economic trends that impact the market. It further analyzes the market's key drivers, regional dynamics, and current industry trends. The report concludes by providing detailed profiles of the major vendors in the market. The base year for the study is 2022, and projections for the years 2023 through 2028 are included, along with forecasts of the compound annual growth rate (CAGR) for the forecast period.
The report provides an overview of AI in the oil and gas sector, focusing on its key components and driving factors. It explores the software, services, and hardware aspects of the market, analyzing the solutions provided by different companies. The applications of AI in the industry are also discussed, including upstream, midstream, downstream, and support functions. The report also includes a regional analysis, examining the current and future factors influencing AI deployment in North America, Europe, Asia-Pacific, and the Rest of the World (including Latin America, the Middle East, and Africa).
Report Includes
- 32 data tables and 32 additional tables
- An overview of the global market for AI in the oil and gas sector
- Analyses of the global market trends, with historical market revenue for 2022, estimates for 2023, forecasts for 2024 and projections of compound annual growth rates (CAGRs) through 2028
- Estimate of the current market size and revenue forecast for the global market, and a corresponding analysis of market shares based on component, application and region
- Facts and figures pertaining to the market dynamics, opportunities and challenges, upcoming technologies, future prospects and impacts of macroeconomic variables
- Overview of the sustainability trends and ESG developments in the market, with an emphasis on consumer attitudes, ESG score analysis, a discussion of the future of ESG, and the ESG practices followed by leading companies
- An analysis of the competitive landscape, including company market shares, recent M&A activity, and the outlook for venture funding
- Company profiles of major players within the industry, including IBM Corp., General Electric, Accenture, Microsoft Corp., and Schneider Electric
Table of Contents
Chapter 1 Executive Summary
- Market Outlook
- Scope of Report
- Market Summary
Chapter 2 Market Overview
- Overview
- Regulatory and Policy Framework Impacting AI Integration
- Future Prospects
- Value Chain Analysis
- Platform Providers
- Agents/Application Developers
- Solution Providers
- End User
- Porter's Five Forces Analysis
- Bargaining Power of Suppliers
- Bargaining Power of Consumers
- Threat of New Entrants
- Threat of Substitutes
- Competition in the Industry
- Geopolitical and Other Developments
Chapter 3 Market Dynamics
- Overview
- Market Drivers
- Advanced Imaging and Surveys
- Improved Market Competitiveness
- Enhanced Operational Efficiency
- Reduced Operating Costs
- Market Restraints
- Data Quality and Availability
- Skill Shortages and Workforce Transition
- Market Opportunity
- Customized AI Solutions for Industry Challenges
Chapter 4 Emerging Technologies and Developments
- Overview
- Current Market Trends
- Digital Twins and Simulation
- Cloud-based AI Solutions
- Emerging Technologies
- Edge AI
- Explainable AI (XAI)
- Quantum Computing
- Digital Thread
- Biometric Security Solutions
- Patent Analysis
- Geographical Patterns
- Key Findings
Chapter 5 Market Segmentation Analysis
- Segmentation Breakdown
- Market Breakdown by Component
- Overview
- Software
- Services
- Hardware
- Market Breakdown by Application
- Overview
- Upstream
- Midstream
- Downstream
- Support Functions
- Geographic Breakdown
- Market Breakdown by Region
- Overview
- North America
- Europe
- Asia-Pacific
- Rest of the World
Chapter 6 Competitive Intelligence
- Market Share Analysis
Chapter 7 Environmental, Social, and Governance (ESG) Perspective
- Overview
- ESG Performance in the Market for AI Technology in the Oil and Gas Sector
- Environmental Impact
- Social Impact
- Governance Impact
- Current Status of ESG in the Market for AI Technology in the Oil and Gas Sector
- Consumer Attitudes Towards ESG in the Market for AI Technology in the Oil and Gas Sector
- Concluding Remarks from BCC
Chapter 8 Appendix
- Methodology
- References
- Company Profiles
- ABB
- ACCENTURE
- ASPEN TECHNOLOGY INC.
- CISCO SYSTEMS INC.
- EY
- FUGENX TECHNOLOGIES
- GENERAL ELECTRIC
- HONEYWELL INTERNATIONAL INC.
- IBM CORP.
- INTEL CORP.
- MICROSOFT CORP.
- ORACLE
- SCHNEIDER ELECTRIC
- SPARKCOGNITION
