|
|
市場調査レポート
商品コード
1735431
バイオ医薬品:各種技術と世界市場Biologic Therapeutic Drugs: Technologies and Global Markets |
||||||

|
|||||||
|
|||||||

| バイオ医薬品:各種技術と世界市場 |
|
出版日: 2025年05月14日
発行: BCC Research
ページ情報: 英文 170 Pages
納期: 即納可能
|

全表示
- 概要
- 図表
- 目次
世界のバイオ医薬品の市場規模は、2024年の4,992億ドルから2029年には7,945億ドルに拡大すると見込まれており、2024年から2029年にかけてのCAGRは9.7%と予測されています。
北米のバイオ医薬品の市場規模は、2024年の2,472億ドルから2029年には3,973億ドルに拡大すると見込まれており、同期間のCAGRは10.0%とされています。
アジア太平洋地域のバイオ医薬品の市場規模は、2024年の884億ドルから2029年には1,524億ドルに拡大すると見込まれており、同期間のCAGRは11.5%と予測されています。 。
当レポートでは、世界のバイオ医薬品の市場を調査し、市場概要、市場影響因子および市場機会の分析、法規制環境、新興技術および技術開発の動向、市場規模の推移・予測、各種区分・地域別の詳細分析、競合情勢、主要企業のプロファイルなどをまとめています。
目次
第1章 エグゼクティブサマリー
- 市場見通し
- 調査範囲
- 市場サマリー
- 概要
- 現在の市場シナリオ
- セグメント分析
- 技術の進歩
- 総論
第2章 市場概要
- 概要
- バイオ医薬品と合成医薬品の比較
- バイオ医薬品製造
- バイオ医薬品製造プロセス
- マクロ経済要因分析
- ポーターのファイブフォース分析
- サプライチェーン分析
- 細胞・遺伝子治療サプライチェーン
第3章 市場力学
- 市場力学
- 市場促進要因
- バイオ医薬品の需要の増加
- バイオ医薬品への投資の増加
- 製品開発のコラボレーションと契約
- 個別化医療への移行
- 高齢化の進行と慢性疾患の増加
- 市場抑制要因
- バイオシミラーの出現
- 複雑な製造工程、熟練した専門家の不足、高い生産コスト
- 市場機会
- 新興国におけるバイオ医薬品の需要増加
- バイオ医薬品における技術革新
第4章 規制状況
- 米国の承認プロセス
- EUの承認プロセス
- アジア太平洋の承認プロセス
第5章 新興技術と開発
- 新興技術
- モノクローナル抗体の進歩
- 抗体薬物複合体
- 二重特異性抗体
- ナノボディ
- 単鎖可変フラグメント抗体
- 抗体模倣体
- 抗体融合タンパク質
- ワクチンの進歩
- 細胞・遺伝子治療の進歩
第6章 市場セグメンテーション分析
- 概要
- セグメンテーションの内訳
- 市場分析:製品タイプ別
- モノクローナル抗体
- ワクチン
- ペプチドホルモン
- 細胞・遺伝子治療
- その他
- 市場分析:由来別
- 哺乳類
- 微生物
- その他
- 市場分析:用途別
- 腫瘍
- 自己免疫疾患
- 感染症
- その他
- 地理的内訳
- 市場分析:地域別
- 北米
- 欧州
- アジア太平洋
- その他の地域
第7章 競合情報
- 概要
- もっとも売れているバイオ医薬品
- 市場シェア分析
- モノクローナル抗体
- ワクチン
- ペプチドホルモン
- 細胞・遺伝子治療
- 戦略的取り組み
- 協定、協力、パートナーシップ
- 買収
- その他の戦略
第8章 バイオ医薬品市場における持続可能性:ESGの観点
- ESG:イントロダクション
- 持続可能性の動向と取り組み
- 環境
- 社会とガバナンスの取り組み
- ESGリスク評価
- 総論
第9章 付録
- 調査手法
- 新興スタートアップ企業/市場ディスラプター
- 出典
- 略語
- 企業プロファイル
- ABBVIE INC.
- AMGEN INC.
- ASTRAZENECA
- BRISTOL-MYERS SQUIBB CO.
- ELI LILLY AND CO.
- F. HOFFMANN-LA ROCHE LTD.
- GILEAD SCIENCES INC.
- GSK PLC.
- JOHNSON & JOHNSON SERVICES INC.
- MERCK & CO. INC.
- NOVARTIS AG
- NOVO NORDISK A/S
- PFIZER INC.
- REGENERON PHARMACEUTICALS INC.
- SANOFI
List of Tables
- Summary Table : Global Market for Biologic Therapeutic Drugs, by Region, Through 2029
- Table 1 : Global Incidence and Mortality Cancer Rates, by the WHO Region, 2022
- Table 2 : Global Market for Biologic Therapeutic Drugs, by Product Type, Through 2029
- Table 3 : Top-Selling Monoclonal Antibodies, in 2023
- Table 4 : Global Market for Monoclonal Antibodies, by Region, Through 2029
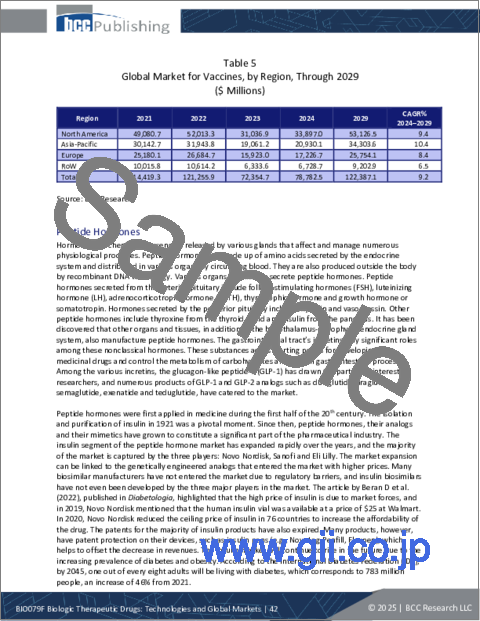
- Table 5 : Global Market for Vaccines, by Region, Through 2029
- Table 6 : Global Market for Peptide Hormones, by Region, Through 2029
- Table 7 : Cell and Gene Therapy Approvals, 2023 and 2024
- Table 8 : Global Market for Cell and Gene Therapy, by Region, Through 2029
- Table 9 : Global Market for Other Biologic Drugs, by Region, Through 2029
- Table 10 : Global Market for Biologic Therapeutic Drugs, by Source Type, Through 2029
- Table 11 : Global Market for Mammalian Cells, by Region, Through 2029
- Table 12 : Global Market for Microbial Cells, by Region, Through 2029
- Table 13 : Global Market for Other Cells, by Region, Through 2029
- Table 14 : Global Market for Biologic Therapeutic Drugs, by Application Type, Through 2029
- Table 15 : Global Market for Biologic Therapeutic Drugs in Oncology, by Region, Through 2029
- Table 16 : Global Market for Biologic Therapeutic Drugs for Autoimmune Diseases, by Region, Through 2029
- Table 17 : Global Market for Biologic Therapeutic Drugs for Infectious Diseases, by Region, Through 2029
- Table 18 : Global Market for Biologic Therapeutic Drugs for Other Diseases, by Region, Through 2029
- Table 19 : Global Market for Biologic Therapeutic Drugs, by Region, Through 2029
- Table 20 : North American Market for Biologic Therapeutic Drugs, by Product Type, Through 2029
- Table 21 : North American Market for Biologic Therapeutic Drugs, by Source Type, Through 2029
- Table 22 : North American Market for Biologic Therapeutic Drugs, by Application Type, Through 2029
- Table 23 : North American Market for Biologic Therapeutic Drugs, by Country, Through 2029
- Table 24 : FDA-Approved Biologics, 2023
- Table 25 : European Market for Biologic Therapeutic Drugs, by Product Type, Through 2029
- Table 26 : European Market for Biologic Therapeutic Drugs, by Source Type, Through 2029
- Table 27 : European Market for Biologic Therapeutic Drugs, by Application Type, Through 2029
- Table 28 : European Market for Biologic Therapeutic Drugs, by Country, Through 2029
- Table 29 : Asia-Pacific Market for Biologic Therapeutic Drugs, by Product Type, Through 2029
- Table 30 : Asia-Pacific Market for Biologic Therapeutic Drugs, by Source Type, Through 2029
- Table 31 : Asia-Pacific Market for Biologic Therapeutic Drugs, by Application Type, Through 2029
- Table 32 : Asia-Pacific Market for Biologic Therapeutic Drugs, by Country, Through 2029
- Table 33 : Biologics Approved in China, in 2023
- Table 34 : Rest of the World Market for Biologic Therapeutic Drugs, by Product Type, Through 2029
- Table 35 : Rest of the World Market for Biologic Therapeutic Drugs, by Source Type, Through 2029
- Table 36 : Rest of the World Market for Biologic Therapeutic Drugs, by Application Type, Through 2029
- Table 37 : Rest of the World Market for Biologic Therapeutic Drugs, by Sub-Region, Through 2029
- Table 38 : Agreements, Collaborations and Partnerships in the Biologic Therapeutic Drug Market, 2022-2025
- Table 39 : Acquisitions in the Biologic Therapeutic Drug Market, 2022-2024
- Table 40 : Others Strategic Initiatives in the Biologic Therapeutic Drug Market, 2022-2024
- Table 41 : Environmental Initiatives by Various Biologic Therapeutic Drug Manufacturers
- Table 42 : Key Social and Governance Issues Biologic Therapeutic Drug Market
- Table 43 : ESG Risk Rankings for Biologic Therapeutic Drug Companies, 2023
- Table 44 : List of a Few Emerging Startups in the Biologic Therapeutic Drugs Market
- Table 45 : Information Sources in this Report
- Table 46 : Abbreviations Used in the Global Biologic Therapeutic Drugs Market
- Table 47 : AbbVie Inc.: Company Snapshot
- Table 48 : AbbVie Inc.: Financial Performance, FY 2023 and 2024
- Table 49 : AbbVie Inc.: Product Portfolio
- Table 50 : AbbVie Inc.: News/Key Developments, 2022-2024
- Table 51 : Amgen Inc.: Company Snapshot
- Table 52 : Amgen Inc.: Financial Performance, FY 2023 and 2024
- Table 53 : Amgen Inc.: Product Portfolio
- Table 54 : Amgen Inc.: News/Key Developments, 2021-2024
- Table 55 : AstraZeneca: Company Snapshot
- Table 56 : AstraZeneca: Financial Performance, FY 2023 and 2024
- Table 57 : AstraZeneca: Product Portfolio
- Table 58 : AstraZeneca: News/Key Developments, 2021-2024
- Table 59 : Bristol-Myers Squibb Co.: Company Snapshot
- Table 60 : Bristol-Myers Squibb Co.: Financial Performance, FY 2023 and 2024
- Table 61 : Bristol-Myers Squibb Co.: Product Portfolio
- Table 62 : Bristol-Myers Squibb Co.: News/Key Developments, 2022-2025
- Table 63 : Eli Lilly and Co.: Company Snapshot
- Table 64 : Eli Lilly and Co.: Financial Performance, FY 2023 and 2024
- Table 65 : Eli Lilly and Co.: Product Portfolio
- Table 66 : Eli Lilly and Co.: News/Key Developments, 2023 and 2024
- Table 67 : F. Hoffmann-La Roche Ltd.: Company Snapshot
- Table 68 : F. Hoffmann-La Roche Ltd.: Financial Performance, FY 2023 and 2024
- Table 69 : F. Hoffmann-La Roche Ltd.: Product Portfolio
- Table 70 : F. Hoffmann-La Roche Ltd.: News/Key Developments, 2022-2025
- Table 71 : Gilead Sciences Inc.: Company Snapshot
- Table 72 : Gilead Sciences Inc.: Financial Performance, FY 2023 and 2024
- Table 73 : Gilead Sciences Inc.: Product Portfolio
- Table 74 : Gilead Sciences Inc.: News/Key Developments, 2022-2024
- Table 75 : GSK PLC.: Company Snapshot
- Table 76 : GSK PLC.: Financial Performance, FY 2023 and 2024
- Table 77 : GSK PLC.: Product Portfolio
- Table 78 : GSK PLC.: News/Key Developments, 2024
- Table 79 : Johnson & Johnson Services Inc.: Company Snapshot
- Table 80 : Johnson & Johnson Services Inc.: Financial Performance, FY 2023 and 2024
- Table 81 : Johnson & Johnson Services Inc.: Product Portfolio
- Table 82 : Johnson & Johnson Services Inc.: News/Key Developments, 2022-2024
- Table 83 : Merck & Co. Inc.: Company Snapshot
- Table 84 : Merck & Co. Inc.: Financial Performance, FY 2023 and 2024
- Table 85 : Merck & Co. Inc.: Product Portfolio
- Table 86 : Merck & Co. Inc.: News/Key Developments, 2022-2024
- Table 87 : Novartis AG: Company Snapshot
- Table 88 : Novartis AG: Financial Performance, FY 2023 and 2024
- Table 89 : Novartis AG: Product Portfolio
- Table 90 : Novartis AG: News/Key Developments, 2022-2025
- Table 91 : Novo Nordisk A/S: Company Snapshot
- Table 92 : Novo Nordisk A/S: Financial Performance, FY 2023 and 2024
- Table 93 : Novo Nordisk A/S: Product Portfolio
- Table 94 : Novo Nordisk A/S: News/Key Developments, 2021-2025
- Table 95 : Pfizer Inc.: Company Snapshot
- Table 96 : Pfizer Inc.: Financial Performance, FY 2023 and 2024
- Table 97 : Pfizer Inc.: Product Portfolio
- Table 98 : Pfizer Inc.: News/Key Developments, 2023-2024
- Table 99 : Regeneron Pharmaceuticals Inc.: Company Snapshot
- Table 100 : Regeneron Pharmaceuticals Inc.: Financial Performance, FY 2023 and 2024
- Table 101 : Regeneron Pharmaceuticals Inc.: Product Portfolio
- Table 102 : Regeneron Pharmaceuticals Inc.: News/Key Developments, 2022-2024
- Table 103 : Sanofi: Company Snapshot
- Table 104 : Sanofi: Financial Performance, FY 2023 and 2024
- Table 105 : Sanofi: Product Portfolio
- Table 106 : Sanofi: News/Key Developments, 2022-2024
List of Figures
- Summary Figure : Global Market Shares of Biologic Therapeutic Drugs, by Region, 2023
- Figure 1 : Differences Between Synthetic and Biologic Drugs
- Figure 2 : Porter's Five Forces Analysis of the Biologic Therapeutic Drugs Market
- Figure 3 : Supply Chain of Biopharmaceutical Drugs
- Figure 4 : Market Dynamics of Biologic Therapeutic Drugs
- Figure 5 : Venture Averages for Biopharma Therapeutics and Platform Companies, 2010-2024
- Figure 6 : Personalized Medicines' Contribution to the Total FDA Approvals, 2015-2023
- Figure 7 : Emerging Technologies in Monoclonal Antibodies
- Figure 8 : Global Market Shares of Biologic Therapeutic Drugs, by Product Type, 2023
- Figure 9 : Global Vaccination Coverage, by Vaccine, 2023
- Figure 10 : Global Market Shares of Biologic Therapeutic Drugs, by Source Type, 2023
- Figure 11 : Global Market Shares of Biologic Therapeutic Drugs, by Application Type, 2023
- Figure 12 : Global Market Shares for Biologic Therapeutic Drugs, by Region, 2023
- Figure 13 : North American Market Shares of Biologic Therapeutic Drugs, by Country, 2023
- Figure 14 : European Market Shares of Biologic Therapeutic Drugs, by Country, 2023
- Figure 15 : Asia-Pacific Market Shares of Biologic Therapeutic Drugs, by Country, 2023
- Figure 16 : Rest of the World Market Shares of Biologic Therapeutic Drugs, by Sub-Region, 2023
- Figure 17 : Top 10 Blockbuster Biologic Therapeutic Drugs, by Sales Revenue, 2023
- Figure 18 : Global Market Shares for Monoclonal Antibodies, by Key Players, 2023
- Figure 19 : Global Market Shares for Vaccines, by Key Players, 2023
- Figure 20 : Global Market Shares for Peptide Hormones, by Key Players, 2023
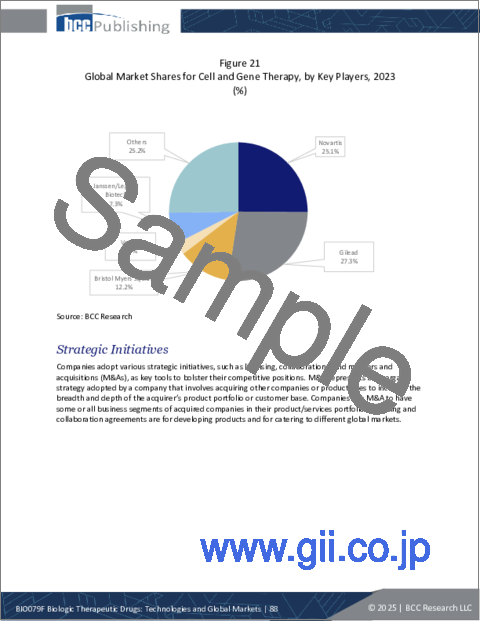
- Figure 21 : Global Market Shares for Cell and Gene Therapy, by Key Players, 2023
- Figure 22 : AbbVie Inc.: Revenue Share, by Business Unit, FY 2024
- Figure 23 : AbbVie Inc.: Revenue Share, by Country/Region, FY 2024
- Figure 24 : Amgen Inc.: Revenue Share, by Business Unit, FY 2024
- Figure 25 : Amgen Inc.: Revenue Share, by Country/Region, FY 2024
- Figure 26 : AstraZeneca: Revenue Share, by Business Unit, FY 2024
- Figure 27 : AstraZeneca: Revenue Share, by Region/Country, FY 2024
- Figure 28 : Bristol-Myers Squibb Co.: Revenue Share, by Business Unit, FY 2024
- Figure 29 : Bristol-Myers Squibb Co.: Revenue Share, by Country/Region, FY 2024
- Figure 30 : Eli Lilly and Co.: Revenue Share, by Business Unit, FY 2024
- Figure 31 : Eli Lilly and Co.: Revenue Share, by Country/Region, FY 2024
- Figure 32 : F. Hoffmann-La Roche Ltd.: Revenue Share, by Business Unit, FY 2024
- Figure 33 : F. Hoffmann-La Roche Ltd.: Revenue Share, by Country/Region, FY 2024
- Figure 34 : Gilead Sciences Inc.: Revenue Share, by Business Unit, FY 2024
- Figure 35 : Gilead Sciences Inc.: Revenue Share, by Country/Region, FY 2024
- Figure 36 : GSK PLC.: Revenue Share, by Business Unit, FY 2024
- Figure 37 : GSK PLC.: Revenue Share, by Country/Region, FY 2024
- Figure 38 : Johnson & Johnson Services Inc.: Revenue Share, by Business Unit, FY 2024
- Figure 39 : Johnson & Johnson Services Inc.: Revenue Share, by Country/Region, FY 2024
- Figure 40 : Merck & Co. Inc.: Revenue Share, by Business Unit, FY 2024
- Figure 41 : Merck & Co. Inc.: Revenue Share, by Country/Region, FY 2024
- Figure 42 : Novartis AG: Revenue Share, by Business Unit, FY 2024
- Figure 43 : Novartis AG: Revenue Share, by Country/Region, FY 2024
- Figure 44 : Novo Nordisk A/S: Revenue Share, by Business Unit, FY 2024
- Figure 45 : Novo Nordisk A/S: Revenue Share by Country/Region, FY 2024
- Figure 46 : Pfizer Inc.: Revenue Share, by Business Unit, FY 2024
- Figure 47 : Pfizer Inc.: Revenue Share, by Country/Region, FY 2024
- Figure 48 : Regeneron Pharmaceuticals Inc.: Revenue Share, by Business Unit, FY 2024
- Figure 49 : Regeneron Pharmaceuticals Inc.: Revenue Share, by Country/Region, FY 2024
- Figure 50 : Sanofi: Revenue Share, by Business Unit, FY 2024
- Figure 51 : Sanofi: Revenue Share, by Country/Region, FY 2024
The global market for biologic therapeutic drugs is estimated to increase from $499.2 billion in 2024 to reach $794.5 billion by 2029, at a compound annual growth rate (CAGR) of 9.7% from 2024 through 2029.
The North American market for biologic therapeutic drugs is estimated to increase from $247.2 billion in 2024 to reach $397.3 billion by 2029, at a CAGR of 10.0% from 2024 through 2029.
The Asia-Pacific market for biologic therapeutic drugs is estimated to increase from $88.4 billion in 2024 to reach $152.4 billion by 2029, at a CAGR of 11.5% from 2024 through 2029.
Report Scope
This report provides an overview of the global biologic therapeutic drug market and analyzes market trends. It includes global revenue ($U.S. millions) for base year data for 2023 and estimated data for 2024. The forecast period is 2024 through 2029. The market is segmented based on product type, application, source and region. By product, the market is segmented into monoclonal antibodies, vaccines, peptide hormones, cell and gene therapies and others. By source, it is segmented into mammalian, microbial and others. By application, the market is segmented into oncology, autoimmune diseases, infectious diseases and others. The regions covered in this study are North America, Europe, Asia-Pacific, Middle East and Africa, and South America, focusing on the major countries in these regions. The North American region includes the U.S., Canada and Mexico. Europe includes Germany, the U.K., Italy, France, Spain and the Rest of Europe; Asia-Pacific includes China, Japan, India, South Korea and the Rest of Asia-Pacific.
The report focuses on the significant driving trends and challenges that affect the market and vendor landscape. It analyzes corporate environmental, social and governance (ESG) developments and discusses emerging technologies related to the market.
The report concludes with an analysis of the competitive landscape, which provides the ranking and share of key players in the global biologic therapeutic drug market. It also has a section dedicated to company profiles that covers such details as overview, key financials, product portfolio and recent developments of key market players.
Report Includes
- 49 data tables and 58 additional tables
- An overview of the current and future global markets for biologic therapeutic drugs and technologies
- An analysis of the global market trends, with market revenue data from 2021 to 2023, estimates for 2024, and projected CAGRs through 2029
- Estimates of the size and revenue prospects of the global market, along with a market share analysis by product type, application, source and region
- Facts and figures pertaining to market dynamics, technological advances, regulations, and the impact of macroeconomic factors
- Evaluation of the ongoing clinical trials and R&D activity for biologics production
- A look at the key drugs on the market and recent approvals, sales statistics and past performance of the top-selling biologics
- An analysis of patents, emerging trends and other developments in the industry
- Analysis of the industry structure, including companies' market shares and rankings, strategic alliances, M&A activity and a venture funding outlook
- Overview of sustainability trends and ESG developments, with emphasis on consumer attitudes, and the ESG scores and practices of leading companies
- Company profiles of major players within the industry, including Merck & Co. Inc., F. Hoffmann-La Roche Ltd., Johnson & Johnson Services Inc., Pfizer Inc., and Bristol-Myers Squibb Co.
Table of Contents
Chapter 1 Executive Summary
- Market Outlook
- Scope of Report
- Market Summary
- Overview
- Current Market Scenario
- Segmental Analysis
- Technological Advances
- Conclusion
Chapter 2 Market Overview
- Overview
- Biologic and Synthetic Drug Comparison
- Biologic Manufacturing
- Biopharmaceutical Manufacturing Process
- Macroeconomic Factors Analysis
- Porter's Five Forces Analysis
- Supply Chain Analysis
- Cell and Gene Therapy Supply Chain
Chapter 3 Market Dynamics
- Market Dynamics
- Market Drivers
- Growing Demand for Biologics
- Rising Investments in Biopharmaceuticals
- Product Development Collaborations and Agreements
- Transition Toward Personalized Medicines
- Rising Aging Population and the Growing Prevalence of Chronic Diseases
- Market Restraints
- Emergence of Biosimilars
- Complex Manufacturing, Lack of Skilled Professionals and High Production Costs
- Market Opportunities
- Rising Demand for Biopharmaceuticals in Emerging Countries
- Technological Innovations in Biologics
Chapter 4 Regulatory Landscape
- U.S. Approval Process
- European Union Approval Process
- Asia-Pacific Approval Process
Chapter 5 Emerging Technologies and Developments
- Emerging Technologies
- Advances in Monoclonal Antibodies
- Antibody-Drug Conjugates
- Bispecific Antibodies
- Nanobodies
- Single-Chain Variable Fragments Antibodies
- Antibody Mimetics
- Antibody Fusion Proteins
- Advances in Vaccines
- Advances in Cell and Gene Therapies
Chapter 6 Market Segmentation Analysis
- Overview
- Segmentation Breakdown
- Market Analysis by Product Type
- Monoclonal Antibodies
- Vaccines
- Peptide Hormones
- Cell and Gene Therapy
- Others
- Market Analysis by Source Type
- Mammalian
- Microbial
- Others
- Market Analysis by Application
- Oncology
- Autoimmune Disease
- Infectious Diseases
- Others
- Geographic Breakdown
- Market Analysis by Region
- North America
- Europe
- Asia-Pacific
- Rest of the World
Chapter 7 Competitive Intelligence
- Overview
- Highest Selling Biologic Therapeutic Drugs
- Market Share Analysis
- Monoclonal Antibodies
- Vaccines
- Peptide Hormones
- Cell and Gene Therapy
- Strategic Initiatives
- Agreements, Collaborations and Partnerships
- Acquisitions
- Other Strategies
Chapter 8 Sustainability in Biologics Therapeutic Drug Market: An ESG Perspective
- Introduction to ESG
- Sustainability Trends and Initiatives
- Environmental
- Social and Governance Initiatives
- ESG Risk Ratings
- Concluding Remarks
Chapter 9 Appendix
- Research Methodology
- Emerging Start-ups/Market Disruptors
- Sources
- Abbreviations
- Company Profiles
- ABBVIE INC.
- AMGEN INC.
- ASTRAZENECA
- BRISTOL-MYERS SQUIBB CO.
- ELI LILLY AND CO.
- F. HOFFMANN-LA ROCHE LTD.
- GILEAD SCIENCES INC.
- GSK PLC.
- JOHNSON & JOHNSON SERVICES INC.
- MERCK & CO. INC.
- NOVARTIS AG
- NOVO NORDISK A/S
- PFIZER INC.
- REGENERON PHARMACEUTICALS INC.
- SANOFI

