|
|
市場調査レポート
商品コード
1346095
イオン交換材料:各種技術と世界市場Ion Exchange Materials: Technologies and Global Markets |
||||||
|
|
|||||||
|
|||||||


| イオン交換材料:各種技術と世界市場 |
|
出版日: 2023年09月07日
発行: BCC Research
ページ情報: 英文 280 Pages
納期: 即納可能
|

- 全表示
- 概要
- 図表
- 目次
世界のイオン交換材料の市場規模は、2023年の31億米ドルから、予測期間中は9.0%のCAGRで推移し、2028年には48億米ドルの規模に成長すると予測されています。
地域別で見ると、アジア太平洋市場は2023年の15億米ドルから、10.6%のCAGRで推移し、2028年には24億米ドルに達すると予測されています。また、北米市場は2023年の8億4,580万米ドルから、8.8%のCAGRで推移し、2028年には13億米ドルに達すると予測されています。
当レポートでは、世界のイオン交換材料の市場を調査し、市場および技術の概要、市場影響因子の分析、法規制環境、市場規模の推移・予測、各種区分・地域別の詳細分析、技術および特許の動向、ESGの展開、競合情勢、主要企業のプロファイルなどをまとめています。
目次
第1章 イントロダクション
第2章 サマリー・ハイライト
第3章 市場概要
- 概要
- イオン交換材料
- フォームファクター
- イオン交換材料の主な特性
- イオン交換材料:過去の経緯
- イオン交換プロセス
- イオン交換モデル
- 等価分数
- イオン交換能力
- 選択性
- イオン交換プロセスの反応速度
- 分離・精製プロセス
- イオン交換材料のライフサイクル評価
- 規制動向
第4章 市場力学
- 市場力学
- 市場促進要因
- 市場課題・制約
- 最近のイノベーション
- サプライチェーン
- 原料生産者
- 化学品製造スペシャリスト
- イオン交換材料メーカー
- 商品サプライチェーン
- 半導体メーカー
- 電子機器メーカー
- OEMメーカー
- イオン交換装置メーカー
- 販売代理店
- エンジニアリング・調達・建設請負業者
- 建設・設置業者
- 利用者
- 廃棄物管理・処分
- ロシア・ウクライナ戦争がイオン交換材料市場に与える影響
第5章 市場:フォームファクター別
- 概要
- イオン交換樹脂/ビーズ
- イオン交換膜
第6章 市場:用途別
- 概要
- エネルギー生成・貯蔵
- 燃料電池
- 水の電気分解
- レドックスフロー電池
- 水技術
- 電気透析
- 超純水
- 軟水化
- 脱灰
- 廃水処理
- 分離・化学品製造
- 塩素アルカリプロセス
- クロマトグラフィー
- 化学触媒
- 金属抽出・精製
- 発電・電気
- 食品・飲料
- 砂糖・甘味料
- 飲料製造
- 医薬品
- ドラッグデリバリー
- 生化学物質の分離・精製
第7章 市場:地域別
- 世界のイオン交換材料市場
- 北米
- 欧州
- アジア太平洋
- その他の地域
第8章 ESGの展開
- イオン交換材料業界におけるESGの重要性
- ESG評価と指標:データの理解
- イオン交換材料業界における主なESG課題
- イオン交換材料業界におけるESGの実践
- イオン交換材料業界におけるESGの現状
- ESGスコア分析
- リスクスケール・露出スケール・管理スケール
- ケーススタディ:ESG導入の成功例
- 環境への取り組み
- 社会への取り組み
- ガバナンスへの取り組み
- 成果
- ESGの未来:新たな動向と機会
- BCCによる総論
第9章 新たな技術と開発
- 主なハイライト
- 主要市場動向
- グリーンで持続可能な樹脂と膜
- ハイブリッド技術
- 循環経済とリサイクル
- 高度再生技術
- 膜ハイブリダイゼーション
- プロセスの強化
- 用途の拡張
- デジタル化とアナリティクス
- 高温および耐酸性の膜
- 選択的および特殊な樹脂/膜
- 新製品・新技術開発
- 特許技術
第10章 特許分析
第11章 M&Aとベンチャー資金調達の見通し
- M&A分析
- スタートアップの資金調達
第12章 競合情報
- 概要
- 企業シェア
- 戦略的分析
第13章 企業プロファイル
- 3M
- ASTOM CORP.
- AXPLORA
- AGC INC.
- BIO-RAD LABORATORIES INC.
- CHEMOURS(THE CHEMOURS CO.)
- DUPONT DE NEMOURS INC.
- DIOXIDE MATERIALS
- EVOQUA WATER TECHNOLOGIES LLC
- EICHROM TECHNOLOGIES
- ECOSOFT BWT
- ECOLECTRO INC.
- FUJIFILM HOLDINGS CORP.
- ION EXCHANGE(INDIA)LTD.
- IONOMR INNOVATIONS INC.
- JACOBI CARBONS AB
- LANXESS AG
- MITSUBISHI CHEMICAL GROUP CORP.
- MEMBRANES INTERNATIONAL
- PUROLITE
- RESINTECH INC.
- SAMYANG CORP.
- SUNRESIN NEW MATERIALS CO., LTD.
- SALTWORKS TECHNOLOGIES INC.
- SUQING GROUP
- SNOWPURE LLC
- SOLVAY SA
- TAIYUAN LANLANG TECHNOLOGY INDUSTRIAL CORP.
- THERMAX LTD.
第14章 付録:頭字語
List of Tables
- Summary Table : Global Market for Ion Exchange Materials, by Region, Through 2028
- Table 1 : Ion Exchange Materials, by Form Factor
- Table 2 : Ion Exchange Materials Regulations, Standards and Frameworks
- Table 3 : Key Market Drivers for Ion Exchange Materials
- Table 4 : Global Market for Ion Exchange Materials, by Form Factor, Through 2028
- Table 5 : Global Market for Ion Exchange Resins/Beads, by Region, Through 2028
- Table 6 : Global Market for Ion Exchange Membranes, by Region, Through 2028
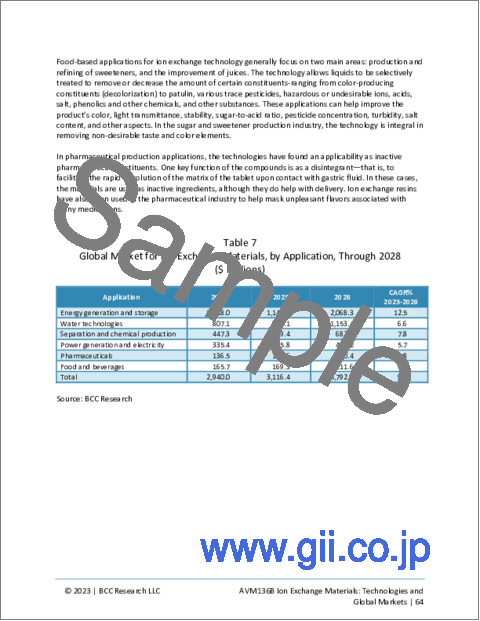
- Table 7 : Global Market for Ion Exchange Materials, by Application, Through 2028
- Table 8 : Global Market for Ion Exchange Materials in Energy Generation and Storage Applications, by Region, Through 2028
- Table 9 : Fuel Cell's Application Type
- Table 10 : Global Market for Ion Exchange Materials in Fuel Cells, by Region, Through 2028
- Table 11 : Global Market for Ion Exchange Materials in Fuel Cells, by Application, Through 2028
- Table 12 : Global Market for Ion Exchange Materials in Water Electrolysis, by Region, Through 2028
- Table 13 : Global Market for Ion Exchange Materials in Water Electrolysis, by Application, Through 2028
- Table 14 : Global Market for Ion Exchange Materials in Redox Flow Batteries, by Region, Through 2028
- Table 15 : Global Market for Ion Exchange Materials in Water Technologies, by Region, Through 2028
- Table 16 : Global Market for Ion Exchange Materials in Electrodialysis, by Region, Through 2028
- Table 17 : Global Market for Ion Exchange Materials in Ultrapure Water, by Region, Through 2028
- Table 18 : Global Market for Ion Exchange Materials in Water Softening, by Region, Through 2028
- Table 19 : Global Market for Ion Exchange Materials in Demineralization, by Region, Through 2028
- Table 20 : Global Market for Ion Exchange Materials in Wastewater Treatment, by Region, Through 2028
- Table 21 : Global Market for Ion Exchange Materials in Separation and Chemical Production, by Region, Through 2028
- Table 22 : Global Market for Ion Exchange Materials in Chlor-Alkali Process, by Region, Through 2028
- Table 23 : Global Market for Ion Exchange Materials in Chromatography, by Region, Through 2028
- Table 24 : Global Market for Ion Exchange Materials in Chemical Catalysis, by Region, Through 2028
- Table 25 : Global Market for Ion Exchange Materials in Metal Extraction and Purification, by Region, Through 2028
- Table 26 : Global Market for Ion Exchange Materials in Power Generation and Electricity, by Region, Through 2028
- Table 27 : Global Market for Ion Exchange Materials in Food and Beverage Applications, by Region, Through 2028
- Table 28 : Global Market for Ion Exchange Materials in Sugar and Sweeteners, by Region, Through 2028
- Table 29 : Global Market for Ion Exchange Materials in Beverage Production, by Region, Through 2028
- Table 30 : Global Market for Ion Exchange Materials in Pharmaceutical Applications, by Region, Through 2028
- Table 31 : Global Market for Ion Exchange Materials in Drug Delivery, by Region, Through 2028
- Table 32 : Global Market for Ion Exchange Materials in Isolation and Purification of Biochemical Substances, by Region, Through 2028
- Table 33 : Global Market for Ion Exchange Materials, by Region, Through 2028
- Table 34 : North American Market for Ion Exchange Materials, by Country, Through 2028
- Table 35 : North American Market for Ion Exchange Materials, by Form Factor, Through 2028
- Table 36 : North American Market for Ion Exchange Materials, by Application, Through 2028
- Table 37 : North American Market for Ion Exchange Materials in Energy Generation and Storage Applications, by Type, Through 2028
- Table 38 : North American Market for Ion Exchange Materials in Water Technology Applications, by Type, Through 2028
- Table 39 : North American Market for Ion Exchange Materials in Separation and Chemical Production Applications, by Type, Through 2028
- Table 40 : North American Market for Ion Exchange Materials in Food and Beverage Applications, by Type, Through 2028
- Table 41 : North American Market for Ion Exchange Materials in Pharmaceutical Applications, by Type, Through 2028
- Table 42 : European Market for Ion Exchange Materials, by Country, Through 2028
- Table 43 : European Market for Ion Exchange Materials, by Form Factor, Through 2028
- Table 44 : European Market for Ion Exchange Materials, by Application, Through 2028
- Table 45 : European Market for Ion Exchange Materials in Energy Generation and Storage Applications, by Type, Through 2028
- Table 46 : European Market for Ion Exchange Materials in Water Technology Applications, by Type, Through 2028
- Table 47 : European Market for Ion Exchange Materials in Separation and Chemical Production Applications, by Type, Through 2028
- Table 48 : European Market for Ion Exchange Materials in Food and Beverage Applications, by Type, Through 2028
- Table 49 : European Market for Ion Exchange Materials in Pharmaceutical Applications, by Type, Through 2028
- Table 50 : Asia-Pacific Market for Ion Exchange Materials, by Country, Through 2028
- Table 51 : Asia-Pacific Market for Ion Exchange Materials, by Form Factor, Through 2028
- Table 52 : Asia-Pacific Market for Ion Exchange Materials, by Application, Through 2028
- Table 53 : Asia-Pacific Market for Ion Exchange Materials in Energy Generation and Storage Applications, by Type, Through 2028
- Table 54 : Asia-Pacific Market for Ion Exchange Materials in Water Technology Applications, by Type, Through 2028
- Table 55 : Asia-Pacific Market for Ion Exchange Materials in Separation and Chemical Production Applications, by Type, Through 2028
- Table 56 : Asia-Pacific Market for Ion Exchange Materials in Food and Beverage Applications, by Type, Through 2028
- Table 57 : Asia-Pacific Market for Ion Exchange Materials in Pharmaceutical Applications, by Type, Through 2028
- Table 58 : Rest of the World Market for Ion Exchange Materials, by Form Factor, Through 2028
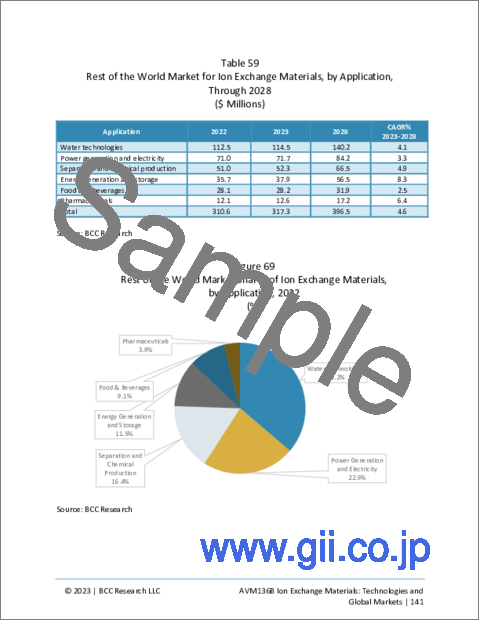
- Table 59 : Rest of the World Market for Ion Exchange Materials, by Application, Through 2028
- Table 60 : Rest of the World Market for Ion Exchange Materials in Energy Generation and Storage Applications, by Type, Through 2028
- Table 61 : Rest of the World Market for Ion Exchange Materials in Water Technology Applications, by Type, Through 2028
- Table 62 : Rest of the World Market for Ion Exchange Materials in Separation and Chemical Production Applications, by Type, Through 2028
- Table 63 : Rest of the World Market for Ion Exchange Materials in Food and Beverage Applications, by Type, Through 2028
- Table 64 : Rest of the World Market for Ion Exchange Materials in Pharmaceutical Applications, by Type, Through 2028
- Table 65 : Interpretation of ESG Data in the Ion Exchange Materials Industry
- Table 66 : ESG Carbon Footprint Issue Analysis
- Table 67 : ESG Water and Waste Reduction Issues Analysis
- Table 68 : ESG Diversity Issue Analysis
- Table 69 : ESG Employee Safety and Labor Practices Issue Analysis
- Table 70 : ESG Resource Efficiency and Emissions Issue Analysis
- Table 71 : ESG Sustainable Supply Chain Issue Analysis
- Table 72 : ESG Data Privacy and Security Issue Analysis
- Table 73 : ESG Score Analysis of Market for Ion Exchange Materials, 2023
- Table 74 : Risk Scale, Exposure Scale, and Management Scale
- Table 75 : New Product/New Technology Development, Ion Exchange Materials Market, 2020-2023
- Table 76 : Patented Technologies in the Ion Exchange Materials Market, 2019-2023
- Table 77 : Patents on Ion Exchange Materials, 2018-2023
- Table 78 : M&A in the Ion Exchange Materials Industry, January 2020-April 2023
- Table 79 : Start-up Funding in the Ion Exchange Materials Industry, January 2020-March 2023
- Table 80 : Global Market Shares of Ion Exchange Materials, by Leading Suppliers, 2022
- Table 81 : Strategy Dashboard: Ion Exchange Materials, 2020-2023
- Table 82 : 3M: Annual Revenue, 2022
- Table 83 : 3M: News and Developments, 2022-2023
- Table 84 : 3M: Product Portfolio
- Table 85 : Astom Corp.: News and Developments, 2022
- Table 86 : Astom Corp.: Product Portfolio
- Table 87 : Axplora: News and Developments, 2022
- Table 88 : Axplora: Product Portfolio
- Table 89 : AGC Inc.: Annual Revenue, 2022
- Table 90 : AGC Inc.: News and Developments, 2020-2022
- Table 91 : AGC Inc: Product Portfolio
- Table 92 : Bio-Rad Laboratories, Inc.: Annual Revenue, 2022
- Table 93 : Bio-Rad Laboratories Inc.: News and Developments, 2018
- Table 94 : Bio-Rad Laboratories Inc.: Product Portfolio
- Table 95 : The Chemours Co.: Annual Revenue, 2022
- Table 96 : The Chemours Co.: News and Developments, 2019-2023
- Table 97 : The Chemours Co.: Product Portfolio
- Table 98 : DuPont de Nemours Inc.: Annual Revenue, 2022
- Table 99 : DuPont de Nemours Inc.: News and Developments, 2021 and 2022
- Table 100 : DuPont de Nemours Inc.: Product Portfolio
- Table 101 : Dioxide Materials: Product Portfolio
- Table 102 : Evoqua Water Technologies: Annual Revenue, 2022
- Table 103 : Evoqua Water Technologies: News and Developments, 2021-2023
- Table 104 : Evoqua Water Technologies: Product Portfolio
- Table 105 : Eichrom Technologies: Product Portfolio
- Table 106 : Ecosoft: Product Portfolio
- Table 107 : Fujifilm Holdings Corp.: Annual Revenue, 2022
- Table 108 : Fujifilm Holdings Corp.: News and Developments, 2022
- Table 109 : Fujifilm Holdings Corp.: Product Portfolio
- Table 110 : Ion Exchange (India) Ltd.: Annual Revenue, 2022
- Table 111 : Ion Exchange (India) Ltd.: News and Developments, 2022
- Table 112 : Ion Exchange (India) Ltd.: Product Portfolio
- Table 113 : Ionomr Innovations Inc.: News and Developments, 2021-2023
- Table 114 : Ionomr Innovations Inc.: Product Portfolio
- Table 115 : Jacobi Resins: Product Portfolio
- Table 116 : Lanxess AG: Annual Revenue, 2022
- Table 117 : Lanxess AG: News and Developments, 2023
- Table 118 : Lanxess AG: Product Portfolio
- Table 119 : Mitsubishi Chemical Group Corp.: Annual Revenue, 2022
- Table 120 : Mitsubishi Chemical Group Corp.: News and Developments, 2021-2023
- Table 121 : Mitsubishi Chemical Group Corp.: Product Portfolio
- Table 122 : Membranes International: Product Portfolio
- Table 123 : Purolite: News and Developments, 2023
- Table 124 : Purolite: Product Portfolio
- Table 125 : ResinTech Inc.: News and Developments, 2020-2022
- Table 126 : ResinTech Inc.: Product Portfolio
- Table 127 : Samyang Corp.: Annual Revenue, 2022
- Table 128 : Samyang Corp.: News and Developments, 2020-2022
- Table 129 : Samyang Corp.: Product Portfolio
- Table 130 : Sunresin New Materials Co., Ltd.: Annual Revenue, 2022
- Table 131 : Sunresin New Materials Co., Ltd.: News and Developments, 2020
- Table 132 : Sunresin New Materials Co., Ltd.: Product Portfolio
- Table 133 : Saltworks Technologies: News and Developments, 2020-2023
- Table 134 : Saltworks Technologies: Product Portfolio
- Table 135 : Suqing Group: Product Portfolio
- Table 136 : SnowPure LLC: Product Portfolio
- Table 137 : Solvay SA: Annual Revenue, 2022
- Table 138 : Solvay SA: News and Developments, 2021
- Table 139 : Solvay SA: Product Portfolio
- Table 140 : Taiyuan Lanlang Technology Industrial Corp: Product Portfolio
- Table 141 : Thermax Ltd.: Annual Revenue, 2022
- Table 142 : Thermax Ltd.: News and Developments, 2021-2023
- Table 143 : Thermax Ltd.: Product Portfolio
- Table 144 : Acronyms Used in This Report
List of Figures
Figure A : Data Source: Global Market for Ion Exchange Materials
- Summary Figure : Global Market Shares of Ion Exchange Materials, by Region, 2022
- Figure 1 : Schematic Representation for Cation Exchange Resins and Anion Exchange Resins
- Figure 2 : Schematic Representation of an Ion Exchange Membrane
- Figure 3 : Example of the Ion Exchange Process, by Steps
- Figure 4 : Schematic Representation of the Ion Exchange Column
- Figure 5 : Standard Functionalities for Cation Exchange Materials
- Figure 6 : Common Functionalities for Anion Exchange Materials
- Figure 7 : Ion Exchange Materials, Supply Chain
- Figure 8 : Global Market Shares of Ion Exchange Materials, by Form Factor, 2022
- Figure 9 : Global Market Shares of Ion Exchange Resins/Beads, by Region, 2022
- Figure 10 : Working Principle of Ion Exchange Membranes
- Figure 11 : Global Market Shares of Ion Exchange Membranes, by Region, 2022
- Figure 12 : Global Market Shares of Ion Exchange Materials, by Application, 2022
- Figure 13 : Global Market Shares of Ion Exchange Materials in Energy Generation and Storage Applications, by Region, 2022
- Figure 14 : Schematic Representation of an Ion Exchange Membrane Fuel Cell System
- Figure 15 : Fuel Cell: Basic Principles
- Figure 16 : Global Market Shares of Ion Exchange Materials in Fuel Cells, by Region, 2022
- Figure 17 : Global Market Shares of Ion Exchange Materials in Fuel Cells, by Application, 2022
- Figure 18 : Schematic Representation of an Ion Exchange Membrane Water Electrolysis Unit
- Figure 19 : Global Market Shares of Ion Exchange Materials in Water Electrolysis, by Region, 2022
- Figure 20 : Global Market Shares of Ion Exchange Materials in Water Electrolysis, by Application, 2022
- Figure 21 : Schematic Representation of a Redox Flow Battery
- Figure 22 : Global Market Shares of Ion Exchange Materials in Redox Flow Batteries, by Region, 2022
- Figure 23 : Global Market Shares of Ion Exchange Materials in Water Technologies, by Region, 2022
- Figure 24 : Schematic Representation of the Ion Exchange Membrane System Used for Electrodialysis
- Figure 25 : Global Market Shares of Ion Exchange Materials in Electrodialysis, by Region, 2022
- Figure 26 : Global Market Shares of Ion Exchange Materials in Ultrapure Water, by Region, 2022
- Figure 27 : Global Market Shares of Ion Exchange Materials in Water Softening, by Region, 2022
- Figure 28 : Global Market Shares of Ion Exchange Materials in Demineralization, by Region, 2022
- Figure 29 : Global Market Shares of Ion Exchange Materials in Wastewater Treatment, by Region, 2022
- Figure 30 : Global Market Shares of Ion Exchange Materials in Separation and Chemical Production, by Region, 2022
- Figure 31 : Schematic for an Ion Exchange Membrane Chlor-Alkali Electrolytic Cell
- Figure 32 : Global Market Shares of Ion Exchange Materials in Chlor-Alkali Process, by Region, 2022
- Figure 33 : Global Market Shares of Ion Exchange Materials in Chromatography, by Region, 2022
- Figure 34 : Global Market Shares of Ion Exchange Materials in Chemical Catalysis, by Region, 2022
- Figure 35 : Global Market Shares of Ion Exchange Materials in Metal Extraction and Purification, by Region, 2022
- Figure 36 : Global Market Shares of Ion Exchange Materials in Power Generation and Electricity, by Region, 2022
- Figure 37 : Global Market Shares of Ion Exchange Materials in Food and Beverage Applications, by Region, 2022
- Figure 38 : Global Market Shares of Ion Exchange Materials in Sugar and Sweeteners, by Region, 2022
- Figure 39 : Global Market Shares of Ion Exchange Materials in Beverage Production, by Region, 2022
- Figure 40 : Global Market Shares of Ion Exchange Materials in Pharmaceutical Applications, by Region, 2022
- Figure 41 : Global Market Shares of Ion Exchange Materials in Drug Delivery, by Region, 2022
- Figure 42 : Global Market Shares of Ion Exchange Materials in Isolation and Purification of Biochemical Substances, by Region, 2022
- Figure 43 : Global Market Shares of Ion Exchange Materials, by Region, 2022
- Figure 44 : North American Market Shares of Ion Exchange Materials, by Country, 2022
- Figure 45 : North American Market Shares of Ion Exchange Materials, by Form Factor, 2022
- Figure 46 : North American Market Shares of Ion Exchange Materials, by Application, 2022
- Figure 47 : North American Market Shares of Ion Exchange Materials in Energy Generation and Storage Applications, by Type, 2022
- Figure 48 : North American Market Shares of Ion Exchange Materials in Water Technology Applications, by Type, 2022
- Figure 49 : North American Market Shares of Ion Exchange Materials in Separation and Chemical Production Applications, by Type, 2022
- Figure 50 : North American Market Shares of Ion Exchange Materials in Food and Beverage Applications, by Type, 2022
- Figure 51 : North American Market Shares of Ion Exchange Materials in Pharmaceutical Applications, by Type, 2022
- Figure 52 : European Market Shares of Ion Exchange Materials, by Country, 2022
- Figure 53 : European Market Shares of Ion Exchange Materials, by Form Factor, 2022
- Figure 54 : European Market Shares of Ion Exchange Materials, by Application, 2022
- Figure 55 : European Market Shares of Ion Exchange Materials in Energy Generation and Storage Applications, by Type, 2022
- Figure 56 : European Market Shares of Ion Exchange Materials in Water Technology Applications, by Type, 2022
- Figure 57 : European Market Shares of Ion Exchange Materials in Separation and Chemical Production Applications, by Type, 2022
- Figure 58 : European Market Shares of Ion Exchange Materials in Food and Beverage Applications, by Type, 2022
- Figure 59 : European Market Shares of Ion Exchange Materials in Pharmaceutical Applications, by Type, 2022
- Figure 60 : Asia-Pacific Market Shares of Ion Exchange Materials, by Country, 2022
- Figure 61 : Asia-Pacific Market Shares of Ion Exchange Materials, by Form Factor, 2022
- Figure 62 : Asia-Pacific Market Shares of Ion Exchange Materials, by Application, 2022
- Figure 63 : Asia-Pacific Market Shares of Ion Exchange Materials in Energy Generation and Storage Applications, by Type, 2022
- Figure 64 : Asia-Pacific Market Shares of Ion Exchange Materials in Water Technology Applications, by Type, 2022
- Figure 65 : Asia-Pacific Market Shares of Ion Exchange Materials in Separation and Chemical Production Applications, by Type, 2022
- Figure 66 : Asia-Pacific Market Shares of Ion Exchange Materials in Food and Beverage Applications, by Type, 2022
- Figure 67 : Asia-Pacific Market Shares of Ion Exchange Materials in Pharmaceutical Applications, by Type, 2022
- Figure 68 : Rest of the World Market Shares of Ion Exchange Materials, by Form Factor, 2022
- Figure 69 : Rest of the World Market Shares of Ion Exchange Materials, by Application, 2022
- Figure 70 : Rest of the World Market Shares of Ion Exchange Materials in Energy Generation and Storage Applications, by Type, 2022
- Figure 71 : Rest of the World Market Shares of Ion Exchange Materials in Water Technology Applications, by Type, 2022
- Figure 72 : Rest of the World Market Shares of Ion Exchange Materials in Separation and Chemical Production Applications, by Type, 2022
- Figure 73 : Rest of the World Market Shares of Ion Exchange Materials in Food and Beverage Applications, by Type, 2022
- Figure 74 : Rest of the World Market Shares of Ion Exchange Materials in Pharmaceutical Applications, by Type, 2022
- Figure 75 : ESG in the Ion Exchange Materials Industry
- Figure 76 : Environmental Score of Major Companies in the Ion Exchange Materials Market, 2023
- Figure 77 : Social Score of Major Companies in the Ion Exchange Materials Market, 2023
- Figure 78 : Governance Score of Major Companies in the Ion Exchange Materials Market, 2023
- Figure 79 : Emerging Trends in the Market for Ion Exchange Materials
- Figure 80 : M&A in the Ion Exchange Materials Industry, by Deal Value, 2020-2023
- Figure 81 : Start-up Funding in the Ion Exchange Materials Industry, by Various Rounds, 2022 and 2023
- Figure 82 : Distribution Share of Start-up Funding Amount, by Various Rounds, 2022 and 2023
- Figure 83 : 3M: Annual Revenue, 2021 and 2022
- Figure 84 : 3M: Revenue Share, by Business Unit, 2022
- Figure 85 : 3M: Revenue Share, by Region, 2022
- Figure 86 : AGC Inc.: Annual Revenue, 2021 and 2022
- Figure 87 : AGC Inc.: Revenue Share, by Business Unit, 2022
- Figure 88 : AGC Inc.: Revenue Share, by Country/Region, 2022
- Figure 89 : Bio-Rad Laboratories, Inc.: Annual Revenue, 2021 and 2022
- Figure 90 : Bio-Rad Laboratories Inc.: Revenue Share, by Business Unit, 2022
- Figure 91 : Bio-Rad Laboratories Inc.: Revenue Share, by Region, 2022
- Figure 92 : The Chemours Co.: Annual Revenue, 2021 and 2022
- Figure 93 : The Chemours Co.: Revenue Share, by Business Unit, 2022
- Figure 94 : The Chemours Co.: Revenue Share, by Region, 2022
- Figure 95 : DuPont de Nemours Inc.: Annual Revenue, 2021 and 2022
- Figure 96 : DuPont de Nemours Inc.: Revenue Share, by Business Unit, 2022
- Figure 97 : DuPont de Nemours Inc.: Revenue Share, by Country/Region, 2022
- Figure 98 : Evoqua Water Technologies: Annual Revenue, 2021 and 2022
- Figure 99 : Evoqua Water Technologies: Revenue Share, by Business Unit, 2022
- Figure 100 : Evoqua Water Technologies: Revenue Share, by Region, 2022
- Figure 101 : Fujifilm Holdings Corp.: Annual Revenue, 2021 and 2022
- Figure 102 : Fujifilm Holdings Corp.: Revenue Share, by Business Unit, 2022
- Figure 103 : Fujifilm Holdings Corp.: Revenue Share, by Region/Country, 2022
- Figure 104 : Ion Exchange (India) Ltd.: Annual Revenue, 2021 and 2022
- Figure 105 : Ion Exchange (India) Ltd.: Revenue Share, by Business Unit, 2022
- Figure 106 : Ion Exchange (India) Ltd.: Revenue Share, by Geography/Region, 2022
- Figure 107 : Lanxess AG: Annual Revenue, 2021 and 2022
- Figure 108 : Lanxess AG: Revenue Share, by Business Unit, 2022
- Figure 109 : Lanxess AG: Revenue Share, by Country/Region, 2022
- Figure 110 : Mitsubishi Chemical Group Corp.: Annual Revenue, 2021 and 2022
- Figure 111 : Mitsubishi Chemical Group Corp.: Revenue Share, by Business Unit, 2022
- Figure 112 : Samyang Corp.: Annual Revenue, 2021 and 2022
- Figure 113 : Sunresin New Materials Co., Ltd.: Annual Revenue, 2021 and 2022
- Figure 114 : Solvay SA: Annual Revenue, 2021 and 2022
- Figure 115 : Solvay SA: Revenue Share, by Business Unit, 2022
- Figure 116 : Solvay SA: Revenue Share, by Region, 2022
- Figure 117 : Thermax Ltd.: Annual Revenue, 2021 and 2022
- Figure 118 : Thermax Ltd.: Revenue Share, by Business Unit, 2022
- Figure 119 : Thermax Ltd.: Revenue Share, by Geography/Region, 2022
Highlights:
The global market for ion exchange materials is estimated to increase from $3.1 billion in 2023 to reach $4.8 billion by 2028, at a compound annual growth rate (CAGR) of 9.0% from 2023 through 2028.
Asia-Pacific market for ion exchange materials is estimated to increase from $1.5 billion in 2023 to reach $2.4 billion by 2028, at a CAGR of 10.6% from 2023 through 2028.
North American market for ion exchange materials is estimated to increase from $845.8 million in 2023 to reach $1.3 billion by 2028, at a CAGR of 8.8% from 2023 through 2028.
Report Scope:
This report will cover the ion exchange materials industry. Definitive and detailed estimates and forecasts of the global market are provided, followed by a detailed analysis of the ion exchange resins/beads and membranes, application, and regions. It will also focus on the regulations and government-supported programs impacting this market. Regionally, the focus of study will be the markets of North America, Europe, Asia-Pacific, and the Rest of the World (RoW).
While applications for ion exchange materials other than those mentioned above do exist-sensors, for example-the market size for the materials in these industries is comparatively small. Therefore, these technologies are not covered within the scope of this report. In fact, only the applications and geographical regions listed in this chapter are considered in the subsequent market sections.
The report focuses on the global market for ion exchange materials by form factor (resin/beads, membranes), by end user (energy generation and storage [fuel cell systems, water electrolysis systems, redox flow batteries], water technologies [electrodialysis, ultrapure water generation, water softening, demineralization, wastewater treatment], separation and chemicals production [chlor-alkali processes, ion exchange chromatography, chemical catalysis, metal extraction and purification], power generation and electricity [condensate polishing, nuclear waste remediation], food production [sugar production, beverage production], pharmaceutical production {drug delivery, isolation and purification of biochemical substances]).
The report concentrates on ion exchange materials that are currently in commercial use or are likely to be commercialized by 2028. Other applications that, while promising, are not likely to make it out of the laboratory by 2028 are not covered in depth. Sales value estimates are based on prices in the supply chain. Market-driving forces and industry structure are examined. International aspects are analyzed for all global regions.
Report Includes:
- 76 data tables and 69 additional tables.
- An overview of the global market landscape related to the ion exchange materials and technologies.
- In-depth analysis of global market trends, featuring historical revenue data for 2022 and estimated figures for 2023. This analysis includes projections of Compound Annual Growth Rates (CAGRs) spanning through 2028.
- Evaluation of the current market size and revenue growth prospects specific to ion exchange materials, accompanied by a comprehensive market share analysis categorized by form factor, application, and geographical region.
- Discussion of the major growth drivers, opportunities and challenges, technology updates, and impact of various macroeconomic variables influencing the market for ion exchange materials as a basis for projecting demand in the next few years (2023-2028).
- In-depth information (facts and figures) concerning the major factors influencing the progress of this market (benefits, and industry-specific challenges) with respect to specific growth trends, upcoming technologies, regulations, prospects, and contributions to the ion exchange materials industry.
- Review of the key patents grants and patent applications on ion exchange materials, along with emerging technologies and new developments in the global market over a brief period.
- Discussion of the ESG trends and technologies, new developments and sustainable practices in the ion exchange materials industry.
- Identification of the companies best positioned to meet the demand for ion exchange materials in water treatment industry and various remediation projects, owing to or in conjunction with their proprietary technologies, merger and acquisition (M&A) activities, and other strategic advantages.
- Analysis of the company competitive landscape based on recent developments, product portfolios, key financials and segmental revenues, as well as their operational integration.
- Detailed profiles of leading market participants, including DuPont de Nemours Inc., Lanxess AG, Purolite, Mitsubishi Chemical Group, The Chemours Co., and Solvay S.A.
Table of Contents
Chapter 1 Introduction
- Overview
- Study Goals and Objectives
- Reasons for Doing This Study
- Scope of Report
- What's New in This Update?
- Research Methodology
- Information Sources
- Geographic Breakdown
Chapter 2 Summary and Highlights
- Market Outlook
- Market Summary
Chapter 3 Market Overview
- Overview
- Ion Exchange Materials
- Form Factor
- Key Properties of Ion Exchange Materials
- Ion Exchange Materials: A Brief History
- Ion Exchange Process
- Ion Exchange Models
- Equivalent Fraction
- Ion Exchange Capacity
- Selectivity
- Kinetics of Ion Exchange Processes
- Separation and Purification Processes
- Life Cycle Assessment of Ion Exchange Materials
- Regulatory Trends
Chapter 4 Market Dynamics
- Market Dynamics
- Market Drivers
- Market Challenges and Restraints
- Recent Innovations
- Supply Chain
- Raw Material Producers
- Chemical Production Specialists
- Ion Exchange Material Producers
- Commodity Supply Chain
- Semiconductor Manufacturers
- Electronics Equipment Manufacturers
- Original Equipment Manufacturers
- Ion Exchange Equipment Manufacturers
- Distributors
- Engineering, Procurement and Construction Contractors
- Construction/installation Contractors
- End Users
- Waste Management and Disposal
- Impact of the Russia-Ukraine War on the Market for Ion Exchange Materials
Chapter 5 Market by Form Factor
- Overview
- Ion Exchange Resins/Beads
- Ion Exchange Membranes
Chapter 6 Market by Application
- Overview
- Energy Generation and Storage
- Fuel Cells
- Water Electrolysis
- Redox Flow Batteries
- Water Technologies
- Electrodialysis
- Ultrapure Water
- Water Softening
- Demineralization
- Wastewater Treatment
- Separation and Chemical Production
- Chlor-Alkali Process
- Chromatography
- Chemical Catalysis
- Metal Extraction and Purification
- Power Generation and Electricity
- Food and Beverages
- Sugar and Sweeteners
- Beverage Production
- Pharmaceutical
- Drug Delivery
- Isolation and Purification of Biochemical Substances
Chapter 7 Market by Region
- Global Market for Ion Exchange Materials
- North America
- Europe
- Asia-Pacific
- Rest of the World
Chapter 8 ESG Developments
- Importance of ESG in the Ion Exchange Materials Industry
- ESG Ratings and Metrics: Understanding the Data
- Key ESG Issues in the Ion Exchange Materials Industry
- ESG Practices in the Ion Exchange Materials Industry
- Current Status of ESG in the Market for Ion Exchange Materials
- ESG Score Analysis
- Risk Scale, Exposure Scale, and Management Scale
- Risk Scale
- Exposure Scale
- Management Scale
- Case Studies: Examples of Successful ESG Implementation
- Environmental Initiatives
- Social Initiatives
- Governance Initiatives
- Outcomes
- Future of ESG: Emerging Trends and Opportunities
- Concluding Remarks from BCC
Chapter 9 Emerging Technologies and Developments
- Key Highlights
- Key Trends in the Market
- Green and Sustainable Resins and Membranes
- Hybrid Technologies
- Circular Economy and Recycling
- Advanced Regeneration Techniques
- Membrane Hybridization
- Process Intensification
- Application Expansion
- Digitalization and Analytics
- High-Temperature and Acid-Resistant Membranes
- Selective and Specialty Resins/Membranes
- New Product/New Technology Development
- Patented Technologies
Chapter 10 Patent Analysis
- Patent Activity
Chapter 11 M&A and Venture Funding Outlook
- M&A Analysis
- Start-up Funding in Ion Exchange Materials
Chapter 12 Competitive Intelligence
- Overview
- Company Market Shares of Ion Exchange Materials
- Strategic Analysis
Chapter 13 Company Profiles
- 3M
- ASTOM CORP.
- AXPLORA
- AGC INC.
- BIO-RAD LABORATORIES INC.
- CHEMOURS (THE CHEMOURS CO.)
- DUPONT DE NEMOURS INC.
- DIOXIDE MATERIALS
- EVOQUA WATER TECHNOLOGIES LLC
- EICHROM TECHNOLOGIES
- ECOSOFT BWT
- ECOLECTRO INC.
- FUJIFILM HOLDINGS CORP.
- ION EXCHANGE (INDIA) LTD.
- IONOMR INNOVATIONS INC.
- JACOBI CARBONS AB
- LANXESS AG
- MITSUBISHI CHEMICAL GROUP CORP.
- MEMBRANES INTERNATIONAL
- PUROLITE
- RESINTECH INC.
- SAMYANG CORP.
- SUNRESIN NEW MATERIALS CO., LTD.
- SALTWORKS TECHNOLOGIES INC.
- SUQING GROUP
- SNOWPURE LLC
- SOLVAY SA
- TAIYUAN LANLANG TECHNOLOGY INDUSTRIAL CORP.
- THERMAX LTD.
Chapter 14 Appendix: Acronyms