|
|
市場調査レポート
商品コード
1284949
熱および生物学的WTE (廃棄物からのエネルギー回収) の世界市場Thermal and Biological Waste-to-Energy Markets |
||||||
|
|
|||||||


| 熱および生物学的WTE (廃棄物からのエネルギー回収) の世界市場 |
|
出版日: 2023年05月31日
発行: BCC Research
ページ情報: 英文 228 Pages
納期: 即納可能
|
- 全表示
- 概要
- 図表
- 目次
世界の熱および生物学的WTE (廃棄物からのエネルギー回収) の市場規模は、2022年の351億米ドルから、2023年から2028年にかけての予測期間中に6.4%のCAGRで推移し、2028年には508億米ドルの規模に成長すると予測されています。
欧州地域は、2022年の155億米ドルから、5.5%のCAGRで推移し、2028年には214億米ドルの規模に成長すると予測されています。また、アジア太平洋地域は、2022年の112億米ドルから、8.0%のCAGRで推移し、2028年には178億米ドルの規模に成長すると予測されています。
当レポートでは、世界の熱および生物学的WTE (廃棄物からのエネルギー回収) の市場を調査し、市場および技術の概要、市場影響因子と市場機会、法規制環境、市場規模の推移・予測、各種区分・地域別の詳細分析、特許動向、競合環境、主要企業のプロファイルなどをまとめています。
目次
第1章 イントロダクション
第2章 サマリー・ハイライト
第3章 市場概要
- 市場スナップショット
- WTE:コンセプト
- WTEの利点
- 産業情勢
- WTEプラントのライフサイクル評価
- WTE戦略の必要性
- WTE市場の成長をサポートする成功プロジェクト
- 米国
- 欧州
- アジア太平洋
- 現在の慣行と規制環境
- 概要
- 規制の動向
第4章 市場力学
- 市場力学
- 市場促進要因
- 市場課題・制約
- 機会
- バリューチェーン分析
- 廃棄物の収集・運搬
- 前処理・ソーティング
- エネルギー変換
- エネルギー分配
- エンドユーザー
- 残留物管理
- 環境モニタリング
- R&D
- COVID-19がWTE産業に与える影響
- ロシア・ウクライナ戦争がWTE産業に与えた影響
第5章 市場内訳:技術別
- 概要
- 熱WTE技術
- 生物学的WTE技術
- 嫌気性消化
- バイオガスからエネルギー回収
- バイオ水素
- 機械的生物学的処理
- 物理的WTE技術
第6章 市場内訳:廃棄物タイプ別
- 概要
- 廃棄物管理の実践
- 都市固形廃棄物
- 産業廃棄物
- 医療廃棄物
- その他
第7章 市場内訳:エンドユーザー別
- 概要
- エネルギー出力
- 自治体利用
- 産業利用
第8章 市場内訳:地域別
- 世界市場
- 北米
- 欧州
- アジア太平洋
- その他の地域
第9章 新たな技術と開発
- 新興技術のハイライト
- 高い採用率を誇る今後の技術
- メガトレンドとイノベーション
第10章 特許分析
第11章 競合情報
- 概要
- 産業構造
- 企業の市場シェア分析
- 戦略的分析
第12章 企業プロファイル
- ANDRITZ AG
- A2A S.P.A.
- ARROW ECOLOGY & ENGINEERING OVERSEAS LTD
- BLUEFIRE RENEWABLES
- BTA INTERNATIONAL GMBH
- BABCOCK & WILCOX ENTERPRISES INC.
- CHINA EVERBRIGHT ENVIRONMENT GROUP LTD.
- CNIM
- COVANTA HOLDING CORP.
- CITEC OY AB
- EBARA CORP.
- ENTEC BIOPOWER AUSTRIA GMBH
- ENTECH RENEWABLE ENERGY SOLUTIONS PTY LTD.
- ENVITEC BIOGAS AG
- EVN AG
- EGGERSMANN GRUPPE GMBH & CO. KG
- HITACHI ZOSEN INOVA AG
- HITACHI ZOSEN INOVA STEINMULLER
- INTERSTATE WASTE TECHNOLOGIES INC.
- JOHN WOOD GROUP PLC
- KEPPEL CORP.
- MITSUBISHI HEAVY INDUSTRIES LTD.
- MVV ENERGIE AG
- MARTIN GMBH
- OMNI CONVERSION TECHNOLOGIES INC.
- RAMBOLL GROUP A/S
- STRABAG UMWELTTECHNIK GMBH
- SUEZ SA
- TAKUMA CO. LTD
- VALORGA INTERNATIONAL SAS.
- VEOLIA ENVIRONNEMENT SA
- WASTE MANAGEMENT INC.
- XCEL ENERGY INC.
- ZHENENG JINJIANG ENVIRONMENT HOLDING CO. LTD.
- ZORG BIOGAS GMBH
List of Tables
- Summary Table : Global Market for Waste-to-Energy, by Region, Through 2028
- Table 1 : Key Benefits of Waste-to-Energy Processes
- Table 2 : Waste-to-Energy Regulations, Standards and Frameworks
- Table 3 : Key Legislation and Policies for Waste Management in ASEAN Countries
- Table 4 : Research and Development Investments as a Percentage Shares of Total Research and Development Spending, by Region or Country, 2016-2024
- Table 5 : Key Challenges to Waste-to-Energy Markets
- Table 6 : Competing Renewable Technologies
- Table 7 : Global Market for Waste-to-Energy, by Technology, Through 2028
- Table 8 : Comparison of Conventional Technologies with Alternative Waste-to-Energy Technologies
- Table 9 : Global Market for Thermal Waste-to-Energy, by Region, Through 2028
- Table 10 : Typical Components of Biogas and Their Impacts on Biogas Quality
- Table 11 : Potential of MSW
- Table 12 : Comparison of Anaerobic and Aerobic Degradation Processes
- Table 13 : Design Parameters for Anaerobic Digestion
- Table 14 : Comparison of Mesophilic and Thermophilic Anaerobic Digestion Processes
- Table 15 : Advantages and Disadvantages of Various Commercial AD Systems
- Table 16 : General Characteristics of Various Power Generators
- Table 17 : Fuel Cell Types Used for Biogas Conversion and Their Current Status
- Table 18 : Methods for Increasing Biogas Yields in Digesters
- Table 19 : Global Market for Biological Waste-to-Energy, by Region, Through 2028
- Table 20 : Global Market for Physical Waste-to-Energy, by Region, Through 2028
- Table 21 : Global Market for Waste-to-Energy, by Type of Waste, Through 2028
- Table 22 : Global Market for Municipal Solid Waste, by Region, Through 2028
- Table 23 : Global Market for Industrial Waste, by Region, Through 2028
- Table 24 : Global Market for Medical Waste, by Region, Through 2028
- Table 25 : Global Market for Other Types of Waste, by Region, Through 2028
- Table 26 : Global Market for Waste-to-Energy, by End Use, Through 2028
- Table 27 : Global Market for Municipal End Uses, by Region, Through 2028
- Table 28 : Global Market for Industrial End Uses, by Region, Through 2028
- Table 29 : Global Market for Waste-to-Energy, by Region, Through 2028
- Table 30 : North American Market for Waste-to-Energy, by Technology, Through 2028
- Table 31 : North American Market for Waste-to-Energy, by Type of Waste, Through 2028
- Table 32 : North American Market for Waste-to-Energy, by End Use, Through 2028
- Table 33 : Levels of Waste Management in Europe
- Table 34 : European Market for Waste-to-Energy, by Technology, Through 2028
- Table 35 : European Market for Waste-to-Energy, by Type of Waste, Through 2028
- Table 36 : European Market for Waste-to-Energy, by End Use, Through 2028
- Table 37 : Asia-Pacific Market for Waste-to-Energy, by Technology, Through 2028
- Table 38 : Asia-Pacific Market for Waste-to-Energy, by Type of Waste, Through 2028
- Table 39 : Asia-Pacific Market for Waste-to-Energy, by End Use, Through 2028
- Table 40 : Rest of the World Market for Waste-to-Energy, by Technology, Through 2028
- Table 41 : Rest of the World Market for Waste-to-Energy, by Type of Waste, Through 2028
- Table 42 : Rest of the World Market for Waste-to-Energy, by End Use, Through 2028
- Table 43 : Patents on Waste-to-Energy Technologies, 2018-2023
- Table 44 : Global Market Shares of Waste-to-Energy, by Leading Suppliers, 2022
- Table 45 : Strategy Dashboard: Global Waste-to-Energy Market, 2019-2023
- Table 46 : Andritz AG: Company Financial Highlights, 2020-2022
- Table 47 : A2A S.p.A: Company Financial Highlights, 2019-2021
- Table 48 : Babcock & Wilcox Enterprises Inc.: Company Financial Highlights, 2019-2021
- Table 49 : Babcock & Wilcox Enterprises Inc.: Product Portfolio
- Table 50 : China Everbright Environment Group Ltd.: Company Financial Highlights, 2019-2021
- Table 51 : Ebara Corp.: Company Financial Highlights, 2019-2021
- Table 52 : Ebara Corp.: Product Portfolio
- Table 53 : Entec: Product Portfolio
- Table 54 : EnviTec Biogas AG: Company Financial Highlights, 2019-2021
- Table 55 : EVN AG: Company Financial Highlights, 2020-2022
- Table 56 : John Wood Group PLC: Company Financial Highlights, 2019-2021
- Table 57 : Keppel Corp.: Company Financial Highlights, 2020-2022
- Table 58 : Mitsubishi Heavy Industries Ltd.: Company Financial Highlights, 2020-2022
- Table 59 : MVV Energie AG.: Company Financial Highlights, 2020-2022
- Table 60 : Takuma Co. Ltd: Company Financial Highlights, 2020-2022
- Table 61 : Veolia Environnement SA: Company Financial Highlights, 2019-2021
- Table 62 : Waste Management Inc.: Company Financial Highlights, 2020-2022
- Table 63 : Xcel Energy Inc.: Company Financial Highlights, 2020-2022
- Table 64 : Zheneng Jinjiang Environment Holding Co. Ltd.: Company Financial Highlights, 2019-2021
- Table 65 : Acronym Used in This Report
List of Figures
Figure A : Data Source: Global Waste-to-Energy Market
Figure B : Waste-to-Energy Segments
Figure C : Schematic Framework of Integrated Sustainable Waste Management
Figure D : Waste Management Hierarchy
- Summary Figure : Global Market Shares of Waste-to-Energy, by Region, 2022
- Figure 1 : Basic WTE Pathways
- Figure 2 : Global Waste-to-Energy Market Trends, 2022-2028
- Figure 3 : Life Cycle of a WTE Technology
- Figure 4 : Legislative Framework of Waste Management in Europe
- Figure 5 : Market Dynamics
- Figure 6 : Projection of the Development of Global Urban and Rural Waste Quantities, 1950-2050
- Figure 7 : Municipal Waste Generated, 2006 and 2021
- Figure 8 : Global Urban Waste Generation, 2012 and 2025
- Figure 9 : Waste-to-Energy Market Industry Value Chain
- Figure 10 : Global Market Shares of Waste-to-Energy, by Technology, 2022
- Figure 11 : Thermal Waste-To-Energy Technology Types
- Figure 12 : Overview of a Fluidized Bed System
- Figure 13 : Overview of a Rotary Kiln System
- Figure 14 : Overview of Plasma Gasification Unit
- Figure 15 : Overview of the Pyrolysis Process
- Figure 16 : Global Market Shares of Thermal Waste-to-Energy, by Region, 2022
- Figure 17 : Process Chain of a Wet AD Plant Treating Biowaste
- Figure 18 : Four Phases of Anaerobic Degradation
- Figure 19 : Global Market Shares of Biological Waste-to-Energy, by Region, 2022
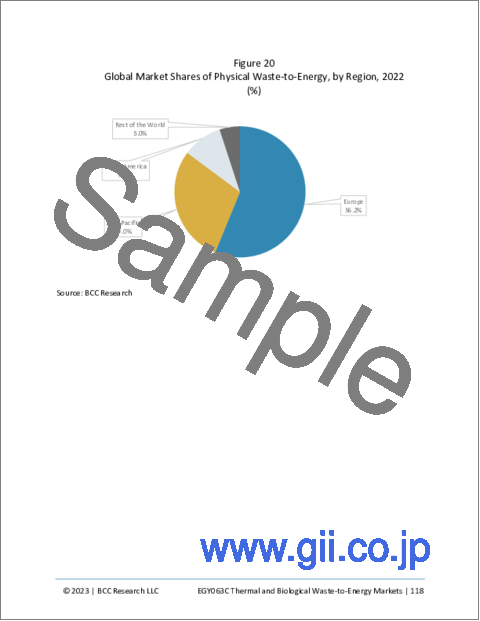
- Figure 20 : Global Market Shares of Physical Waste-to-Energy, by Region, 2022
- Figure 21 : Composition of Municipal Solid Waste
- Figure 22 : Global Market Shares of Waste-to-Energy, by Type of Waste, 2022
- Figure 23 : Global Market Shares of Municipal Solid Waste, by Region, 2022
- Figure 24 : Global Market Shares of Industrial Waste, by Region, 2022
- Figure 25 : Global Market Shares of Medical Waste, by Region, 2022
- Figure 26 : Global Market Shares of Other Types of Waste, by Region, 2022
- Figure 27 : Global Market Shares of Waste-to-Energy, by End Use, 2022
- Figure 28 : Global Market Shares of Municipal End Uses, by Region, 2022
- Figure 29 : Global Market Shares of Industrial End Uses, by Region, 2022
- Figure 30 : Global Market Shares of Waste-to-Energy, by Region, 2022
- Figure 31 : Approximate Emission of Greenhouse Gases
- Figure 32 : North American Market Shares of Waste-to-Energy, by Technology, 2022
- Figure 33 : North American Market Shares of Waste-to-Energy, by Type of Waste, 2022
- Figure 34 : North American Market Shares of Waste-to-Energy, by End Use, 2022
- Figure 35 : Typical Two-Chamber Microbial Fuel Cell
- Figure 36 : European Market Shares of Waste-to-Energy, by Technology, 2022
- Figure 37 : European Market Shares of Waste-to-Energy, by Type of Waste, 2022
- Figure 38 : European Market Shares of Waste-to-Energy, by End Use, 2022
- Figure 39 : Asia-Pacific Market Shares of Waste-to-Energy, by Technology, 2022
- Figure 40 : Asia-Pacific Market Shares of Waste-to-Energy, by Type of Waste, 2022
- Figure 41 : Asia-Pacific Market Shares of Waste-to-Energy, by Type of Waste, 2022
- Figure 42 : Rest of the World Market Shares of Waste-to-Energy, by Technology, 2022
- Figure 43 : Rest of the World Market Shares of Waste-to-Energy, by Type of Waste, 2022
- Figure 44 : Rest of the World Market Shares of Waste-to-Energy, by End Use, 2022
- Figure 45 : Andritz AG: Revenue Share, by Business Segment, 2022
- Figure 46 : Babcock & Wilcox Enterprises Inc.: Revenue Share, by Business Segment, 2021
- Figure 47 : China Everbright Environment Group Ltd.: Revenue Share, by Business Segment, 2021
- Figure 48 : China Everbright Environment Group Ltd.: Revenue Share, by Country, 2021
- Figure 49 : CNIM: Revenue Share, by Business Segment, 2020
- Figure 50 : Ebara Corp.: Revenue Share, by Business Segment, 2021
- Figure 51 : Ebara Corp.: Revenue Share, by Region, 2021
- Figure 52 : EnviTec Biogas AG: Revenue Share, by Business Segment, 2021
- Figure 53 : EVN AG: Revenue Share, by Business Segment, 2021
- Figure 54 : EVN AG: Revenue Share, by Region, 2021
- Figure 55 : John Wood Group PLC: Revenue Share, by Business Segment, 2021
- Figure 56 : Keppel Corp.: Revenue Share, by Business Segment, 2022
- Figure 57 : Keppel Corp.: Revenue Share, by Region/Country, 2022
- Figure 58 : Mitsubishi Heavy Industries Ltd.: Revenue Share, by Business Segment, 2022
- Figure 59 : MVV Energie AG.: Revenue Share, by Business Segment, 2022
- Figure 60 : Takuma Co. Ltd: Revenue Share, by Business Segment, 2022
- Figure 61 : Takuma Co. Ltd: Revenue Share, by Domestic Environment and Energy Business Segment, 2022
- Figure 62 : Veolia Environnement SA: Revenue Share, by Business Segment, 2021
- Figure 63 : Veolia Environnement SA: Revenue Share, by Region/Country, 2021
- Figure 64 : Waste Management Inc.: Revenue Share, by Business Segment, 2022
- Figure 65 : Waste Management Inc.: Revenue Share, by Region, 2022
- Figure 66 : Xcel Energy Inc.: Revenue Share, by Business Segment, 2022
- Figure 67 : Zheneng Jinjiang Environment Holding Co. Ltd.: Revenue Share, by Business Segment, 2021
- Figure 68 : Zheneng Jinjiang Environment Holding Co. Ltd.: Revenue Share, by Region, 2021
Highlights:
The global waste-to-energy market reached $35.1 billion in 2022 and should reach $50.8 billion by 2028, with a compound annual growth rate (CAGR) of 6.4% during the forecast period of 2023-2028.
European waste-to-energy market reached $15.5 billion in 2022 and should reach $21.4 billion by 2028, with a CAGR of 5.5% during the forecast period of 2023-2028.
Asia-Pacific waste-to-energy market reached $11.2 billion in 2022 and should reach $17.8 billion by 2028, with a CAGR of 8.0% during the forecast period of 2023-2028.
Report Scope:
This report will cover the WTE industry. Definitive and detailed estimates and forecasts of the global market are provided, followed by a detailed analysis of the technology, waste type end uses and regions. Ongoing market trends, growth drivers and challenges impeding the market are discussed. The report will analyze the global thermal and biological WTE markets by technology and geography. It will also focus on the regulations and government-supported programs impacting this market. Regionally, the focus of study will be the markets of North America, Europe, Asia-Pacific and the Rest of the World (ROW).
Using 2022 as the base year, the report provides estimated market data for the forecast period from 2023 to 2028. The market size for different regions (regions by technology) will also be covered. The impact of COVID-19 was also considered when deriving market estimations. Sales value estimates are based on prices in the supply chain. Market-driving forces and industry structure are examined. International aspects are analyzed for all global regions.
In 2020, the growth rate of global manufacturing industries was severely affected by the COVID-19 pandemic. The pandemic halted progress in every regional economy. Governments took measures to contain the economic slowdown.
Report Includes:
- 43 data tables and 23 additional tables
- An up-to-date overview and industry analysis of the global markets for thermal and biological waste-to-energy (WTE) processes and technologies
- Analyses of the global market trends, with historic market revenue data (sales figures) for 2022, estimates for 2023, and projections of compound annual growth rates (CAGRs) through 2028
- Estimation of the actual market size and revenue forecast for the global waste-to-energy market in USD million terms, and corresponding market share analysis by technology type, application, end-user, and region
- Highlights of emerging technology trends, opportunities and gaps in the market estimating current and future demand for thermal and biological WTE technologies, and identification of major regions and countries involved market developments
- In-depth information (facts and figures) concerning the major factors influencing the progress of the market (benefits, and industry-specific challenges) with respect to specific growth trends, upcoming technologies, future prospects, and contributions to the overall market
- A comparative study of Porter's Five Forces analysis and PESTLE analysis considering both micro- and macro- environmental factors prevailing in the global market for thermal and biological waste-to-energy technologies
- Review of the legislative and environmental regulatory issues and concerns currently focused on integrated waste management approaches as a basis for projecting demand in the next few years
- Insight into the recent industry structure, competitive aspects of each product segment, increasing investment on R&D activities to develop low-cost WTE technologies, market development strategies, and company value share analysis
- Review of key patent grants and significant allotments of recent patents across each major category
- Company profiles of major players within the industry, including Andritz AG, Mitsubishi Heavy Industries Ltd., Veolia Environnement SA, Waste Management Inc., and Xcel Energy Inc.
Table of Contents
Chapter 1 Introduction
- Overview
- Study Goals and Objectives
- Reasons for Doing This Study
- What's New in This Update?
- Scope of Report
- Information Sources
- Methodology
- Intended Audience
- Geographic Breakdown
- Analyst's Credentials
- BCC Custom Research
- Related BCC Research Reports
Chapter 2 Summary and Highlights
- Overview of the Waste-to-Energy Industry
Chapter 3 Market Overview
- Market Snapshot
- Waste-to-Energy: The Concept
- Benefits of Waste-to-Energy
- Industry Landscape
- Life Cycle Assessment of Waste-to-Energy Plants
- Need for Waste-to-Energy Strategies
- Successfully Completed Projects Supporting Waste-to-Energy Market Growth
- U.S.
- Europe
- Asia-Pacific
- Current Practices and Regulatory Environment
- Overview
- Regulatory Trends
Chapter 4 Market Dynamics
- Market Dynamics
- Market Drivers
- Market Challenges and Restraints
- Opportunities
- Value Chain Analysis
- Waste Collection and Transportation
- Pre-processing and Sorting
- Energy Conversion
- Energy Distribution
- End Users
- Residuals Management
- Environmental Monitoring
- Research and Development
- Impact of COVID-19 on the Waste-to-Energy Industry
- Impact of the Russian-Ukrainian War on the Waste-to-Energy Industry
Chapter 5 Market Breakdown by Technology
- Overview
- Thermal Waste-to-Energy Technologies
- Biological WTE Technologies
- Anaerobic Digestion
- Biogas to Energy
- Bio-hydrogen
- Mechanical Biological Treatment
- Physical Waste-to-Energy Technologies
Chapter 6 Market Breakdown by Type of Waste
- Overview
- Waste Management Practices
- Municipal Solid Waste
- Industrial Waste
- Medical Waste
- Other Types of Waste
Chapter 7 Market Breakdown by End Use
- Overview
- Energy Outputs
- Municipal
- Industrial
Chapter 8 Market Breakdown by Region
- Global Waste-To-Energy Market
- North America
- Europe
- Asia-Pacific
- Rest of the World
Chapter 9 Emerging Technologies and Developments
- Highlights of Emerging Technologies
- Upcoming Technologies with High Adoption Rate
- Megatrends and Innovations
Chapter 10 Patent Analysis
- Patent Activity Analysis
Chapter 11 Competitive Intelligence
- Overview
- Industry Structure
- Company Market Share Analysis
- Strategic Analysis
Chapter 12 Company Profiles
- ANDRITZ AG
- A2A S.P.A.
- ARROW ECOLOGY & ENGINEERING OVERSEAS LTD
- BLUEFIRE RENEWABLES
- BTA INTERNATIONAL GMBH
- BABCOCK & WILCOX ENTERPRISES INC.
- CHINA EVERBRIGHT ENVIRONMENT GROUP LTD.
- CNIM
- COVANTA HOLDING CORP.
- CITEC OY AB
- EBARA CORP.
- ENTEC BIOPOWER AUSTRIA GMBH
- ENTECH RENEWABLE ENERGY SOLUTIONS PTY LTD.
- ENVITEC BIOGAS AG
- EVN AG
- EGGERSMANN GRUPPE GMBH & CO. KG
- HITACHI ZOSEN INOVA AG
- HITACHI ZOSEN INOVA STEINMULLER
- INTERSTATE WASTE TECHNOLOGIES INC.
- JOHN WOOD GROUP PLC
- KEPPEL CORP.
- MITSUBISHI HEAVY INDUSTRIES LTD.
- MVV ENERGIE AG
- MARTIN GMBH
- OMNI CONVERSION TECHNOLOGIES INC.
- RAMBOLL GROUP A/S
- STRABAG UMWELTTECHNIK GMBH
- SUEZ SA
- TAKUMA CO. LTD
- VALORGA INTERNATIONAL SAS.
- VEOLIA ENVIRONNEMENT SA
- WASTE MANAGEMENT INC.
- XCEL ENERGY INC.
- ZHENENG JINJIANG ENVIRONMENT HOLDING CO. LTD.
- ZORG BIOGAS GMBH