|
|
市場調査レポート
商品コード
1400507
細胞・遺伝子治療CDMOの世界市場(2024年版):タイプ別、用途別、適応症別、地域別、国別の分析、市場考察、予測(2024年~2029年)Global Cell and Gene Therapy CDMO Market (2024 Edition): Analysis By Type (Cell Therapy, Gene Therapy, Gene-modified Cell Therapies), Application (Clinical, Pre-clinical), Indication, By Region, By Country: Market Insights and Forecast (2024-2029) |
||||||
|
|||||||
|
|||||||

| 細胞・遺伝子治療CDMOの世界市場(2024年版):タイプ別、用途別、適応症別、地域別、国別の分析、市場考察、予測(2024年~2029年) |
|
出版日: 2024年01月01日
発行: Azoth Analytics
ページ情報: 英文 260 Pages
納期: 即納可能
|

全表示
- 概要
- 図表
- 目次
世界の細胞・遺伝子治療CDMOの市場規模は、2022年の25億4,000万米ドルから2024年~2029年の予測期間にCAGRで30.75%の成長が予測されています。市場は、細胞・遺伝子治療の継続的な進歩に後押しされ、健全な成長と需要の高まりを示しています。治療領域の拡大と良好な規制環境により、市場はさまざまな疾患に対する画期的な治療法の開発と商業化において極めて重要な役割を果たしており、持続的な拡大が見込まれています。市場は、業界の各社からの多額の投資に牽引され、驚異的な成長が見込まれています。
世界の細胞・遺伝子治療のパイプラインは拡大しており、がん、希少疾患、遺伝性疾患などの幅広い治療領域をカバーしています。より多くの治療法が臨床試験を経て商業化に向けて進むにつれて、製造、プロセス開発、スケールアップに向けたCDMOサービスへの需要が高まっています。
世界の細胞・遺伝子治療向けのCDMO組織は拡大しており、これが世界の細胞・遺伝子治療の全体的な拡大を推進する主な要因の1つとなっています。先進の細胞・遺伝子治療に対する世界の需要の増加に伴い、CDMOはバイオテクノロジー企業や製薬企業の変化する需要に対応するため、さまざまな場所に生産施設を積極的に設立しています。昨今、CDMOは医薬品の製造に欠かせない存在となっています。過去10年間で、CDMOはよりダイナミックなM&Aの状況により、その存在感を増してきました。地域市場と国際市場の両方にサービスを提供し、現在600を超える開発・製造受託機関(CDMO)が活動しています。CDMOは「大手製薬企業」と小規模発明者の両方が製品を早期に上市できるよう、特定の専門知識を提供します。
生物製剤の台頭は、新しい生物製剤製造施設に多額の投資を行っているCDMOの数からも見て取れます。これらの企業には、Boehringer Ingelheim(投資額8億2,700万米ドル)、Samsung Biologics(投資額17億米ドル)、Lonza(投資額9億3500万米ドル)、Fujifilm Diosynth Biotechnologies(投資額20億米ドル)などがあります。
さらに、世界に拡大することで、CDMOは地域の規制ニーズに対応し、カスタマイズされた製造ソリューションを提供し、そのサービスを必要とする顧客にとってのアクセシビリティを向上させることができます。CDMOは重要な世界市場に存在することで、より適応性が高く、迅速なソリューションを提供することができます。これにより、遺伝子・細胞治療の開発と世界の商業化を加速することができます。
市場の成長を抑制する顕著な要因の1つは、ウイルスベクターの高い製造コストです。治療用遺伝子を標的細胞に運ぶ担体として、ウイルスベクターは遺伝子・細胞治療の開発に不可欠です。ウイルスベクターの製造は複雑な手順で、特殊な技術、厳格な品質管理基準、特殊な設備が頻繁に必要とされます。
現在、遺伝子治療に使用されているウイルスベクターは5種類あります。AAVの市場シェアがもっとも高く、次いでレンチウイルス、アデノウイルス、単純ヘルペスウイルス、レトロウイルスとなっています。Roland Berger Insightsによると、単回投与分のベクター製造コストは、バッチあたり300万~700万米ドルが予測されることから、100万~200万米ドルになる可能性があります。そのため、ウイルスベクターの高い製造コストが、細胞・遺伝子治療が広く商業化され、利用しやすくなる妨げとなっています。
当レポートでは、世界の細胞・遺伝子治療CDMO市場について調査し、市場規模と予測、地域とセグメントの分析、主な動向と機会などの情報を提供しています。
目次
第1章 市場の背景
- 範囲と製品の見通し
- エグゼクティブサマリー
- 調査手法
第2章 戦略的推奨事項
第3章 世界の細胞・遺伝子治療CDMO市場:実績と予測(2019年~2029年)
- 細胞・遺伝子治療CDMO市場に対するマクロ経済要因の影響の分析
- 細胞・遺伝子治療パイプライン
- 臨床AAV遺伝子治療
- 承認・医薬品:治療領域別
- 承認された治療法、パイプライン
- 遺伝子治療パイプライン
- 遺伝子治療の内訳
- 遺伝子治療パイプライン:もっとも一般的に標的とされる治療領域
- 細胞・遺伝子治療の情勢
- 世界の細胞・遺伝子治療CDMO市場:ダッシュボード
- 世界の細胞・遺伝子治療CDMO市場:市場金額の評価(2019年~2029年)
- 世界の細胞・遺伝子治療CDMO市場:近年の発展と承認された細胞・遺伝子治療
- 世界の細胞・遺伝子治療CDMO市場:近年のM&Aと発展
- 細胞・遺伝子治療CDMO市場に対するCOVID-19の影響
- 世界の細胞・遺伝子治療CDMO市場セグメンテーション:タイプ別
- 世界の細胞・遺伝子治療CDMO市場:タイプ別、概要
- 世界の細胞・遺伝子治療CDMOの市場規模:細胞治療(金額)(2019年~2029年)
- 世界の細胞・遺伝子治療CDMOの市場規模:遺伝子治療(金額)(2019年~2029年)
- 世界の細胞・遺伝子治療CDMOの市場規模:遺伝子改変細胞治療(金額)(2019年~2029年)
- 世界の細胞・遺伝子治療CDMO市場セグメンテーション:用途別
- 世界の細胞・遺伝子治療CDMO市場:用途別、概要
- 世界の細胞・遺伝子治療CDMOの市場規模:臨床(金額)(2019年~2029年)
- 世界の細胞・遺伝子治療CDMOの市場規模:前臨床(金額)(2019年~2029年)
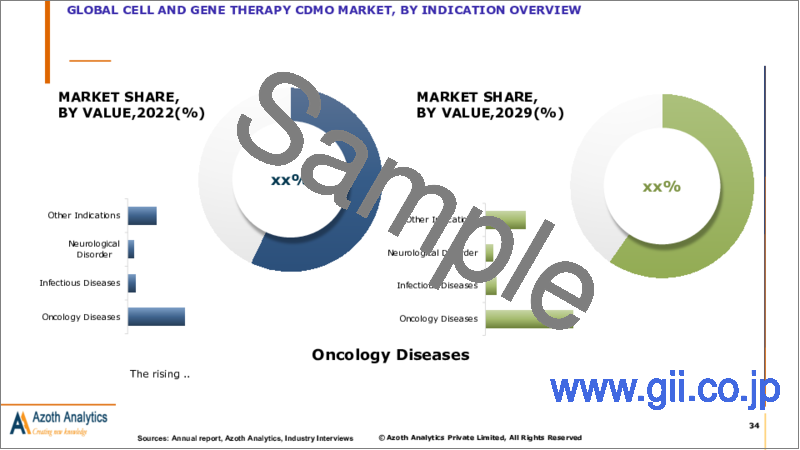
- 世界の細胞・遺伝子治療CDMO市場セグメンテーション:適応症別
- 世界の細胞・遺伝子治療CDMO市場:適応症別、概要
- 世界の細胞・遺伝子治療CDMOの市場規模:腫瘍疾患(金額)(2019年~2029年)
- 世界の細胞・遺伝子治療CDMOの市場規模:感染症(金額)(2019年~2029年)
- 世界の細胞・遺伝子治療CDMOの市場規模:神経疾患(金額)(2019年~2029年)
- 世界の細胞・遺伝子治療CDMOの市場規模:その他の適応症(金額)(2019年~2029年)
第4章 世界の細胞・遺伝子治療CDMO市場:地域の分析
- 研究の地域範囲
- 地域のスナップショット
第5章 南北アメリカの細胞・遺伝子治療CDMO市場:実績と予測(2019年~2029年)
- 南北アメリカの細胞・遺伝子治療CDMO市場:スナップショット
- 南北アメリカの細胞・遺伝子治療CDMO市場:市場金額の評価(2019年~2029年)
- 南北アメリカの細胞・遺伝子治療CDMO市場:主な要因
- 南北アメリカの細胞・遺伝子治療CDMO市場:セグメント分析
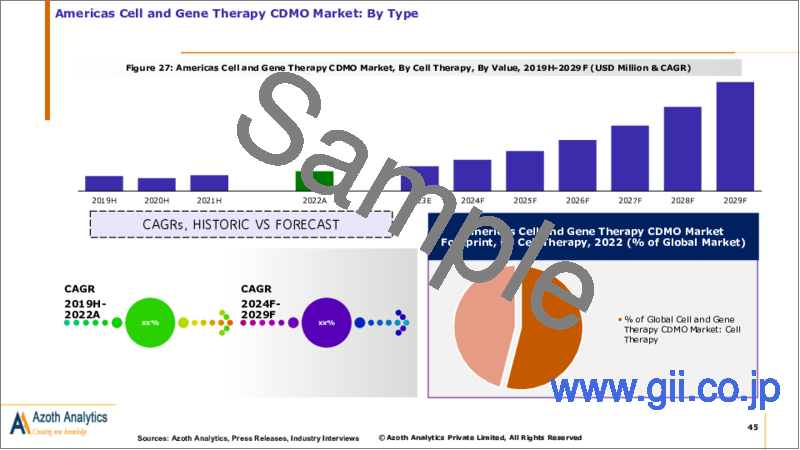
- 南北アメリカの細胞・遺伝子治療CDMO市場セグメンテーション:タイプ別
- 南北アメリカの細胞・遺伝子治療CDMO市場セグメンテーション:用途別
- 南北アメリカの細胞・遺伝子治療CDMO市場セグメンテーション:適応症別
- 南北アメリカの細胞・遺伝子治療CDMO市場セグメンテーション:国別
- 南北アメリカの細胞・遺伝子治療CDMO市場:国別、概要
- 米国の細胞・遺伝子治療CDMO市場:市場規模とCAGR(2019年~2029年)
- カナダの細胞・遺伝子治療CDMO市場:市場規模とCAGR(2019年~2029年)
- その他の南北アメリカの細胞・遺伝子治療CDMO市場:市場規模とCAGR(2019年~2029年)
第6章 欧州の細胞・遺伝子治療CDMO市場:実績と予測(2019年~2029年)
- 欧州の細胞・遺伝子治療CDMO市場:スナップショット
- 欧州の細胞・遺伝子治療CDMO市場:市場金額の評価(2019年~2029年)
- 欧州の細胞・遺伝子治療CDMO市場:主な要因
- 欧州の細胞・遺伝子治療CDMO市場:セグメント分析
- 欧州の細胞・遺伝子治療CDMO市場セグメンテーション:タイプ別
- 欧州の細胞・遺伝子治療CDMO市場セグメンテーション:用途別
- 欧州の細胞・遺伝子治療CDMO市場セグメンテーション:適応症別
- 欧州の細胞・遺伝子治療CDMO市場セグメンテーション:国別
- 欧州の細胞・遺伝子治療CDMO市場:国別、概要
- 英国の細胞・遺伝子治療CDMO市場:市場規模とCAGR(2019年~2029年)
- ドイツの細胞・遺伝子治療CDMO市場:市場規模とCAGR(2019年~2029年)
- フランスの細胞・遺伝子治療CDMO市場:市場規模とCAGR(2019年~2029年)
- イタリアの細胞・遺伝子治療CDMO市場:市場規模とCAGR(2019年~2029年)
- その他の欧州の細胞・遺伝子治療CDMO市場:市場規模とCAGR(2019年~2029年)
第7章 アジア太平洋の細胞・遺伝子治療CDMO市場:実績と予測(2019年~2029年)
- アジア太平洋の細胞・遺伝子治療CDMO市場:スナップショット
- アジア太平洋の細胞・遺伝子治療CDMO市場:市場金額の評価(2019年~2029年)
- アジア太平洋の細胞・遺伝子治療CDMO市場:主な要因
- アジア太平洋の細胞・遺伝子治療CDMO市場:セグメント分析
- アジア太平洋の細胞・遺伝子治療CDMO市場セグメンテーション:タイプ別
- アジア太平洋の細胞・遺伝子治療CDMO市場セグメンテーション:用途別
- アジア太平洋の細胞・遺伝子治療CDMO市場セグメンテーション:適応症別
- アジア太平洋の細胞・遺伝子治療CDMO市場セグメンテーション:国別
- アジア太平洋の細胞・遺伝子治療CDMO市場:国別、概要
- 中国の細胞・遺伝子治療CDMO市場:市場規模とCAGR(2019年~2029年)
- 日本の細胞・遺伝子治療CDMO市場:市場規模とCAGR(2019年~2029年)
- 韓国の細胞・遺伝子治療CDMO市場:市場規模とCAGR(2019年~2029年)
- インドの細胞・遺伝子治療CDMO市場:市場規模とCAGR(2019年~2029年)
- その他のアジア太平洋の細胞・遺伝子治療CDMO市場:市場規模とCAGR(2019年~2029年)
第8章 中東・アフリカの細胞・遺伝子治療CDMO市場:実績と予測(2019年~2029年)
- 中東・アフリカの細胞・遺伝子治療CDMO市場:スナップショット
- 中東・アフリカの細胞・遺伝子治療CDMO市場:市場金額の評価(2019年~2029年)
- 中東・アフリカの細胞・遺伝子治療CDMO市場:主な要因
- 中東・アフリカの細胞・遺伝子治療CDMO市場:セグメント分析
- 中東・アフリカの細胞・遺伝子治療CDMO市場セグメンテーション:タイプ別
- 中東・アフリカの細胞・遺伝子治療CDMO市場セグメンテーション:用途別
- 中東・アフリカの細胞・遺伝子治療CDMO市場セグメンテーション:適応症別
第9章 市場力学
- 世界の細胞・遺伝子治療CDMO市場に対する市場力学の影響の評価
- 促進要因
- 抑制要因
- 動向
第10章 産業エコシステム分析
- バリューチェーン分析
- ポーターのファイブフォース分析モデル
第11章 競合ポジショニング
- 企業の製品ポジショニング
- Oxford Biomedicaのウイルスベクター製品の競合ポジショニング
- 市場ポジションマトリクス
- 細胞・遺伝子治療CDMO市場の市場シェア分析
- 企業プロファイル
- Oxford Biomedica
- Lonza Group AG
- Catalent, Inc.
- Samsung Biologics
- WuXi Biologics
- Pfizer CentreOne
- Danaher Corporation
- Thermo Fisher Scientific Inc.
- Charles River Laboratories International, Inc.
- Novartis AG
List of Figures
List of Figures
- Figure 1: Cell & Gene Therapy Assets in Global Development
- Figure 2: Genetically Modified Cell Therapy Breakdown
- Figure 3: CAR-T Breakdown
- Figure 4: Global Cell and Gene Therapy CDMO Market Size, By Value, 2019-2022 (USD Million)
- Figure 5: Global Cell and Gene Therapy CDMO Market Size, By Value, 2023-2029 (USD Million)
- Figure 6: Global Cell and Gene Therapy CDMO Market CAGR (%), By Value, 2019-2022, 2024-2029
- Figure 7: Global Cell and Gene Therapy CDMO Market Size, By Cell Therapy, By Value, 2019H-2029F (USD Million & CAGR)
- Figure 8: Global Cell and Gene Therapy CDMO Market Absolute Opportunity, By Cell Therapy, 2019-2029 (USD Million)
- Figure 9: Global Cell and Gene Therapy CDMO Market Size, By Gene Therapy, By Value, 2019H-2029F (USD Million & CAGR)
- Figure 10: Global Cell and Gene Therapy CDMO Market Absolute Opportunity, By Gene Therapy, 2019-2029 (USD Million)
- Figure 11: Global Cell and Gene Therapy CDMO Market Size, By Gene-modified Cell Therapies, By Value, 2019H-2029F (USD Million & CAGR)
- Figure 12: Global Cell and Gene Therapy CDMO Market Absolute Opportunity, By Gene-modified Cell Therapies, 2019-2029 (USD Million)
- Figure 13: Global Cell and Gene Therapy CDMO Market Size, By Clinical, By Value, 2019H-2029F (USD Million & CAGR)
- Figure 14: Global Cell and Gene Therapy CDMO Market Absolute Opportunity, By Clinical, 2019-2029 (USD Million)
- Figure 15: Global Cell and Gene Therapy CDMO Market Size, By Pre-clinical, By Value, 2019H-2029F (USD Million & CAGR)
- Figure 16: Global Cell and Gene Therapy CDMO Market Absolute Opportunity, By Pre-clinical, 2019-2029 (USD Million)
- Figure 17: Global Cell and Gene Therapy CDMO Market Size, By Oncology Diseases, By Value, 2019H-2029F (USD Million & CAGR)
- Figure 18: Global Cell and Gene Therapy CDMO Market Absolute Opportunity, By Oncology Diseases, 2019-2029 (USD Million)
- Figure 19: Global Cell and Gene Therapy CDMO Market Size, By Infectious Diseases, By Value, 2019H-2029F (USD Million & CAGR)
- Figure 20: Global Cell and Gene Therapy CDMO Market Absolute Opportunity, By Infectious Diseases, 2019-2029 (USD Million)
- Figure 21: Global Cell and Gene Therapy CDMO Market Size, By Neurological Disorder, By Value, 2019H-2029F (USD Million & CAGR)
- Figure 22: Global Cell and Gene Therapy CDMO Market Absolute Opportunity, By Neurological Disorder, 2019-2029 (USD Million)
- Figure 23: Global Cell and Gene Therapy CDMO Market Size, Other Indications, By Value, 2019H-2029F (USD Million & CAGR)
- Figure 24: Global Cell and Gene Therapy CDMO Market Absolute Opportunity, By Other Indications, 2019-2029 (USD Million)
- Figure 25: Americas Cell and Gene Therapy CDMO Market Size, By Value, 2019H-2029F (USD Million)
- Figure 26: Americas Cell and Gene Therapy CDMO Market Share, By Application, 2022 (%)
- Figure 27: Americas Cell and Gene Therapy CDMO Market, By Cell Therapy, By Value, 2019H-2029F (USD Million & CAGR)
- Figure 28: Americas Cell and Gene Therapy CDMO Market, By Gene Therapy, By Value, 2019H-2029F (USD Million & CAGR)
- Figure 29: Americas Cell and Gene Therapy CDMO Market, By Gene-modified Cell Therapies, By Value, 2019H-2029F (USD Million & CAGR)
- Figure 30: Americas Cell and Gene Therapy CDMO Market, By Clinical, By Value, 2019H-2029F (USD Million & CAGR)
- Figure 31: Americas Cell and Gene Therapy CDMO Market, By Pre-clinical, By Value, 2019H-2029F (USD Million & CAGR)
- Figure 32: Americas Cell and Gene Therapy CDMO Market, By Oncology Diseases, By Value, 2019H-2029F (USD Million & CAGR)
- Figure 33: Americas Cell and Gene Therapy CDMO Market, By Infectious Diseases, By Value, 2019H-2029F (USD Million & CAGR)
- Figure 34: Americas Cell and Gene Therapy CDMO Market, By Neurological Disorder, By Value, 2019H-2029F (USD Million & CAGR)
- Figure 35: Americas Cell and Gene Therapy CDMO Market, By Other Indications, By Value, 2019H-2029F (USD Million & CAGR)
- Figure 36: United States Cell and Gene Therapy CDMO Market, By Value, 2019-2029 (USD Million & CAGR)
- Figure 37: United States Cell and Gene Therapy CDMO Market Value, By Application, 2022 (USD Million)
- Figure 38: United States Cell and Gene Therapy CDMO Market Share, By Type, By Value, 2022 (%)
- Figure 39: United States Cell and Gene Therapy CDMO Market Share, By Application, 2022 (%)
- Figure 40: United States Cell and Gene Therapy CDMO Market Share, By Indication, 2022 (%)
- Figure 41: Canada Cell and Gene Therapy CDMO Market, By Value, 2019-2029 (USD Million & CAGR)
- Figure 42: Canada Cell and Gene Therapy CDMO Market Value, By Application, 2022 (USD Million)
- Figure 43: Canada Cell and Gene Therapy CDMO Market Share, By Type, By Value, 2022 (%)
- Figure 44: Canada Cell and Gene Therapy CDMO Market Share, By Application, 2022 (%)
- Figure 45: Canada Cell and Gene Therapy CDMO Market Share, By Indication, 2022 (%)
- Figure 46: Rest of Americas Cell and Gene Therapy CDMO Market, By Value, 2019-2029 (USD Million & CAGR)
- Figure 47: Rest of Americas Cell and Gene Therapy CDMO Market Value, By Application, 2022 (USD Million)
- Figure 48: Rest of Americas Cell and Gene Therapy CDMO Market Share, By Type, By Value, 2022 (%)
- Figure 49: Rest of Americas Cell and Gene Therapy CDMO Market Share, By Application, 2022 (%)
- Figure 50: Rest of Americas Cell and Gene Therapy CDMO Market Share, By Indication, 2022 (%)
- Figure 51: Europe Cell and Gene Therapy CDMO Market Size, By Value, 2019H-2029F (USD Million)
- Figure 52: Europe Cell and Gene Therapy CDMO Market Share, By Application, 2022 (%)
- Figure 53: Europe Cell and Gene Therapy CDMO Market, By Cell Therapy, By Value, 2019H-2029F (USD Million & CAGR)
- Figure 54: Europe Cell and Gene Therapy CDMO Market, By Gene Therapy, By Value, 2019H-2029F (USD Million & CAGR)
- Figure 55: Europe Cell and Gene Therapy CDMO Market, By Gene-modified Cell Therapies, By Value, 2019H-2029F (USD Million & CAGR)
- Figure 56: Europe Cell and Gene Therapy CDMO Market, By Clinical, By Value, 2019H-2029F (USD Million & CAGR)
- Figure 57: Europe Cell and Gene Therapy CDMO Market, By Pre-clinical, By Value, 2019H-2029F (USD Million & CAGR)
- Figure 58: Europe Cell and Gene Therapy CDMO Market, By Oncology Diseases, By Value, 2019H-2029F (USD Million & CAGR)
- Figure 59: Europe Cell and Gene Therapy CDMO Market, Infectious Diseases, By Value, 2019H-2029F (USD Million & CAGR)
- Figure 60: Europe Cell and Gene Therapy CDMO Market, By Neurological Disorder, By Value, 2019H-2029F (USD Million & CAGR)
- Figure 61: Europe Cell and Gene Therapy CDMO Market, By Other Indications, By Value, 2019H-2029F (USD Million & CAGR)
- Figure 62: United Kingdom Cell and Gene Therapy CDMO Market, By Value, 2019-2029 (USD Million & CAGR)
- Figure 63: United Kingdom Cell and Gene Therapy CDMO Market Value, By Application, 2022 (USD Million)
- Figure 64: United Kingdom Cell and Gene Therapy CDMO Market Share, By Type, By Value, 2022 (%)
- Figure 65: United Kingdom Cell and Gene Therapy CDMO Market Share, By Application, 2022 (%)
- Figure 66: United Kingdom Cell and Gene Therapy CDMO Market Share, By Indication, 2022 (%)
- Figure 67: Germany Cell and Gene Therapy CDMO Market, By Value, 2019-2029 (USD Million & CAGR)
- Figure 68: Germany Cell and Gene Therapy CDMO Market Value, By Application, 2022 (USD Million)
- Figure 69: Germany Cell and Gene Therapy CDMO Market Share, By Type, By Value, 2022 (%)
- Figure 70: Germany Cell and Gene Therapy CDMO Market Share, By Application, 2022 (%)
- Figure 71: Germany Cell and Gene Therapy CDMO Market Share, By Indication, 2022 (%)
- Figure 72: France Cell and Gene Therapy CDMO Market, By Value, 2019-2029 (USD Million & CAGR)
- Figure 73: France Cell and Gene Therapy CDMO Market Value, By Application, 2022 (USD Million)
- Figure 74: France Cell and Gene Therapy CDMO Market Share, By Type, By Value, 2022 (%)
- Figure 75: France Cell and Gene Therapy CDMO Market Share, By Application, 2022 (%)
- Figure 76: France Cell and Gene Therapy CDMO Market Share, By Indication, 2022 (%)
- Figure 77: Italy Cell and Gene Therapy CDMO Market, By Value, 2019-2029 (USD Million & CAGR)
- Figure 78: Italy Cell and Gene Therapy CDMO Market Value, By Application, 2022 (USD Million)
- Figure 79: Italy Cell and Gene Therapy CDMO Market Share, By Type, By Value, 2022 (%)
- Figure 80: Italy Cell and Gene Therapy CDMO Market Share, By Application, 2022 (%)
- Figure 81: Italy Cell and Gene Therapy CDMO Market Share, By Indication, 2022 (%)
- Figure 82: Rest of Europe Cell and Gene Therapy CDMO Market, By Value, 2019-2029 (USD Million & CAGR)
- Figure 83: Rest of Europe Cell and Gene Therapy CDMO Market Value, By Application, 2022 (USD Million)
- Figure 84: Rest of Europe Cell and Gene Therapy CDMO Market Share, By Type, By Value, 2022 (%)
- Figure 85: Rest of Europe Cell and Gene Therapy CDMO Market Share, By Application, 2022 (%)
- Figure 86: Rest of Europe Cell and Gene Therapy CDMO Market Share, By Indication, 2022 (%)
- Figure 87: Asia Pacific Cell and Gene Therapy CDMO Market Size, By Value, 2019H-2029F (USD Million)
- Figure 88: Asia Pacific Cell and Gene Therapy CDMO Market Share, By Application, 2022 (%)
- Figure 89: Asia Pacific Cell and Gene Therapy CDMO Market, By Cell Therapy, By Value, 2019H-2029F (USD Million & CAGR)
- Figure 90: Asia Pacific Cell and Gene Therapy CDMO Market, By Gene Therapy, By Value, 2019H-2029F (USD Million & CAGR)
- Figure 91: Asia Pacific Cell and Gene Therapy CDMO Market, By Gene-modified Cell Therapies, By Value, 2019H-2029F (USD Million & CAGR)
- Figure 92: Asia Pacific Cell and Gene Therapy CDMO Market, By Clinical, By Value, 2019H-2029F (USD Million & CAGR)
- Figure 93: Asia Pacific Cell and Gene Therapy CDMO Market, By Pre-clinical, By Value, 2019H-2029F (USD Million & CAGR)
- Figure 94: Asia Pacific Cell and Gene Therapy CDMO Market, By Oncology Diseases, By Value, 2019H-2029F (USD Million & CAGR)
- Figure 95: Asia Pacific Cell and Gene Therapy CDMO Market, Infectious Diseases, By Value, 2019H-2029F (USD Million & CAGR)
- Figure 96: Asia Pacific Cell and Gene Therapy CDMO Market, By Neurological Disorder, By Value, 2019H-2029F (USD Million & CAGR)
- Figure 97: Asia Pacific Cell and Gene Therapy CDMO Market, By Other Indications, By Value, 2019H-2029F (USD Million & CAGR)
- Figure 98: China Cell and Gene Therapy CDMO Market, By Value, 2019-2029 (USD Million & CAGR)
- Figure 99: China Cell and Gene Therapy CDMO Market Value, By Application, 2022 (USD Million)
- Figure 100: China Cell and Gene Therapy CDMO Market Share, By Type, By Value, 2022 (%)
- Figure 101: China Cell and Gene Therapy CDMO Market Share, By Application, 2022 (%)
- Figure 102: China Cell and Gene Therapy CDMO Market Share, By Indication, 2022 (%)
- Figure 103: Japan Cell and Gene Therapy CDMO Market, By Value, 2019-2029 (USD Million & CAGR)
- Figure 104: Japan Cell and Gene Therapy CDMO Market Value, By Application, 2022 (USD Million)
- Figure 105: Japan Cell and Gene Therapy CDMO Market Share, By Type, By Value, 2022 (%)
- Figure 106: Japan Cell and Gene Therapy CDMO Market Share, By Application, 2022 (%)
- Figure 107: Japan Cell and Gene Therapy CDMO Market Share, By Indication, 2022 (%)
- Figure 108: South Korea Cell and Gene Therapy CDMO Market, By Value, 2019-2029 (USD Million & CAGR)
- Figure 109: South Korea Cell and Gene Therapy CDMO Market Value, By Application, 2022 (USD Million)
- Figure 110: South Korea Cell and Gene Therapy CDMO Market Share, By Type, By Value, 2022 (%)
- Figure 111: South Korea Cell and Gene Therapy CDMO Market Share, By Application, 2022 (%)
- Figure 112: South Korea Cell and Gene Therapy CDMO Market Share, By Indication, 2022 (%)
- Figure 113: India Cell and Gene Therapy CDMO Market, By Value, 2019-2029 (USD Million & CAGR)
- Figure 114: India Cell and Gene Therapy CDMO Market Value, By Application, 2022 (USD Million)
- Figure 115: India Cell and Gene Therapy CDMO Market Share, By Type, By Value, 2022 (%)
- Figure 116: India Cell and Gene Therapy CDMO Market Share, By Application, 2022 (%)
- Figure 117: India Cell and Gene Therapy CDMO Market Share, By Indication, 2022 (%)
- Figure 118: Rest of Asia Pacific Cell and Gene Therapy CDMO Market, By Value, 2019-2029 (USD Million & CAGR)
- Figure 119: Rest of Asia Pacific Cell and Gene Therapy CDMO Market Value, By Application, 2022 (USD Million)
- Figure 120: Rest of Asia Pacific Cell and Gene Therapy CDMO Market Share, By Type, By Value, 2022 (%)
- Figure 121: Rest of Asia Pacific Cell and Gene Therapy CDMO Market Share, By Application, 2022 (%)
- Figure 122: Rest of Americas Cell and Gene Therapy CDMO Market Share, By Indication, 2022 (%)
- Figure 123: Middle east & Africa Cell and Gene Therapy CDMO Market Size, By Value, 2019H-2029F (USD Million)
- Figure 124: Middle east & Africa Cell and Gene Therapy CDMO Market Share, By Application, 2022 (%)
- Figure 125: Middle east & Africa Cell and Gene Therapy CDMO Market, By Cell Therapy, By Value, 2019H-2029F (USD Million & CAGR)
- Figure 126: Middle east & Africa Cell and Gene Therapy CDMO Market, By Gene Therapy, By Value, 2019H-2029F (USD Million & CAGR)
- Figure 127: Middle East & Africa Cell and Gene Therapy CDMO Market, By Gene-modified Cell Therapy, By Value, 2019H-2029F (USD Million & CAGR)
- Figure 128: Middle east & Africa Cell and Gene Therapy CDMO Market, By Clinical, By Value, 2019H-2029F (USD Million & CAGR)
- Figure 129: Middle East & Africa Cell and Gene Therapy CDMO Market, By Pre-clinical, By Value, 2019H-2029F (USD Million & CAGR)
- Figure 130: Middle east & Africa Cell and Gene Therapy CDMO Market, By Oncology Diseases, By Value, 2019H-2029F (USD Million & CAGR)
- Figure 131: Middle east & Africa Cell and Gene Therapy CDMO Market, Infectious Diseases, By Value, 2019H-2029F (USD Million & CAGR)
- Figure 132: Middle east & Africa Cell and Gene Therapy CDMO Market, By Neurological Disorder, By Value, 2019H-2029F (USD Million & CAGR)
- Figure 133: Middle East & Africa Cell and Gene Therapy CDMO Market, By Other Indications, By Value, 2019H-2029F (USD Million & CAGR)
- Figure 134: Global Impact of Drivers and Restraints
- Figure 135: Market Share of Prominent Companies of Cell and Gene Therapy CDMO Market, 2022 (%)
- Figure 136: Oxford Biomedica Revenues, 2020-2022 (USD Million)
- Figure 137: Oxford Biomedica, Revenue By Business Segment, 2022 (%)
- Figure 138: Oxford Biomedica, Revenue By Geographic Segment, 2022 (%)
- Figure 139: Oxford Biomedica, Largest Shareholders, 2022 (%)
- Figure 140: Lonza Group AG Revenues, 2020-2022 (USD Million)
- Figure 141: Lonza Group AG Revenue By Customer Group, 2022 (%)
- Figure 142: Lonza Group AG, By Infrastructure, 2022
- Figure 143: Lonza Group AG, CDMO Sales By Customer Location , 2022 (%)
- Figure 144: Lonza Group AG, CDMO Sales By Customer Type , 2022 (%)
- Figure 145: Lonza Group AG, Distribution of CDMO Customers By Sales, 2022 (%)
- Figure 146: Catalent, Inc. Revenues, 2020-2022 (USD Million)
- Figure 147: Catalent, Inc. Revenue By Business Segment, 2022 (%)
- Figure 148: Catalent, Inc. Revenue By Geographic Segment, 2022 (%)
- Figure 149: Samsung Biologics Revenues, 2020-2022 (USD Million)
- Figure 150: Samsung Biologics Revenue By Business Segment, 2022 (%)
- Figure 151: Samsung Biologics Revenue By Geographic Segment, 2022 (%)
- Figure 152: WuXi Biologics Revenues, 2020-2022 (USD Million)
- Figure 153: WuXi Biologics Revenue By Business Segment, 2022 (%)
- Figure 154: WuXi Biologics Revenue By Geographic Segment, 2022 (%)
- Figure 155: Pfizer CentreOne Revenues, 2020-2022 (USD Million)
- Figure 156: Pfizer CentreOne Revenue By Geographic Segment, 2022 (%)
- Figure 157: Danaher Corporation Revenues, 2020-2022 (USD Million)
- Figure 158: Danaher Corporation Revenue, By Business Segments, 2022 (%)
- Figure 159: Danaher Corporation Revenue, By Geographic Segments, 2022 (%)
- Figure 160: Thermo Fisher Scientific Inc. Revenues, 2020-2022 (USD Million)
- Figure 161: Thermo Fisher Scientific Inc. Revenue By Business Segment, 2022 (%)
- Figure 162: Thermo Fisher Scientific Inc. Revenue By Geographic Segment, 2022 (%)
- Figure 163: Charles River Laboratories International, Inc. Revenues, 2020-2022 (USD Million)
- Figure 164: Charles River Laboratories International, Inc. Revenue By Business Segment, 2022 (%)
- Figure 165: Charles River Laboratories International, Inc. Revenue By Geographic Segment, 2022 (%)
- Figure 166: Novartis AG Revenues, 2020-2022 (USD Million)
- Figure 167: Novartis AG Revenue By Business Segment, 2022 (%)
- Figure 168: Novartis AG Revenue By Geographic Segment, 2022 (%)
List of Tables
Table A1: Global Impact of Macro Economic Factors, By Region
Table A2: OXB's Internal Cell and Gene Therapy Pipeline
Table A3: Clinical AAV Gene Therapies for Genetic Neurological Disorders
Table A4: FDA NME Approvals, 2019-2022
Table A5: Drugs by Therapy Area
Table A6: Approved Gene, Cell, and RNA Therapies Globally, for Clinical Use
Table A7: Pipeline Therapies by Category
Table A8: Approved Gene, Cell, and RNA Therapies Globally, for Clinical Use
Table A9: Number of Therapies from Pre-clinical through Pre-registration
Table A10: Therapies in the Clinic (excludes preclinical development)
Table A11: Cell and Gene Therapy Landscape, by Region
Table A12: Landscape of Key Cell and Gene Therapy Service Providers
Table A13: United States Cell and Gene Therapy CDMO Market, By Type, By Value, 2019-2022 (USD Million)
Table A14: United States Cell and Gene Therapy CDMO Market, By Type, By Value, 2023-2029 (USD Million)
Table A15: United States Cell and Gene Therapy CDMO Market, By Application, By Value, 2019-2022 (USD Million)
Table A16: United States Cell and Gene Therapy CDMO Market, By Application, By Value, 2023-2029 (USD Million)
Table A17: United States Cell and Gene Therapy CDMO Market, By Indication, By Value, 2019-2022 (USD Million)
Table A18: United States Cell and Gene Therapy CDMO Market, By Indication, By Value, 2023-2029 (USD Million)
Table A19: Canada Cell and Gene Therapy CDMO Market, By Type, By Value, 2019-2022 (USD Million)
Table A20: Canada Cell and Gene Therapy CDMO Market, By Type, By Value, 2023-2029 (USD Million)
Table A21: Canada Cell and Gene Therapy CDMO Market, By Application, By Value, 2019-2022 (USD Million)
Table A22: Canada Cell and Gene Therapy CDMO Market, By Application, By Value, 2023-2029 (USD Million)
Table A23: Canada Cell and Gene Therapy CDMO Market, By Indication, By Value, 2019-2022 (USD Million)
Table A24: Canada Cell and Gene Therapy CDMO Market, By Indication, By Value, 2023-2029 (USD Million)
Table A25: Rest of Americas Cell and Gene Therapy CDMO Market, By Type, By Value, 2019-2022 (USD Million)
Table A26: Rest of Americas Cell and Gene Therapy CDMO Market, By Type, By Value, 2023-2029 (USD Million)
Table A27: Rest of Americas Cell and Gene Therapy CDMO Market, By Application, By Value, 2019-2022 (USD Million)
Table A28: Rest of Americas Cell and Gene Therapy CDMO Market, By Application, By Value, 2023-2029 (USD Million)
Table A29: Rest of Americas Cell and Gene Therapy CDMO Market, By Indication, By Value, 2019-2022 (USD Million)
Table A30: Rest of Americas Cell and Gene Therapy CDMO Market, By Indication, By Value, 2023-2029 (USD Million)
Table A31: United Kingdom Cell and Gene Therapy CDMO Market, By Type, By Value, 2019-2022 (USD Million)
Table A32: United Kingdom Cell and Gene Therapy CDMO Market, By Type, By Value, 2023-2029 (USD Million)
Table A33: United Kingdom Cell and Gene Therapy CDMO Market, By Application, By Value, 2019-2022 (USD Million)
Table A34: United Kingdom Cell and Gene Therapy CDMO Market, By Application, By Value, 2023-2029 (USD Million)
Table A35: United Kingdom Cell and Gene Therapy CDMO Market, By Indication, By Value, 2019-2022 (USD Million)
Table A36: United Kingdom Elevated Work Platform (MEWP) Market, By Indication, By Value, 2023-2029 (USD Million)
Table A37: Germany Cell and Gene Therapy CDMO Market, By Type, By Value, 2019-2022 (USD Million)
Table A38: Germany Cell and Gene Therapy CDMO Market, By Type, By Value, 2023-2029 (USD Million)
Table A39: Germany Cell and Gene Therapy CDMO Market, By Application, By Value, 2019-2022 (USD Million)
Table A40: Germany Cell and Gene Therapy CDMO Market, By Application, By Value, 2023-2029 (USD Million)
Table A41: Germany Cell and Gene Therapy CDMO Market, By Indication, By Value, 2019-2022 (USD Million)
Table A42: Germany Cell and Gene Therapy CDMO Market, By Indication, By Value, 2023-2029 (USD Million)
Table A43: France Cell and Gene Therapy CDMO Market, By Type, By Value, 2019-2022 (USD Million)
Table A44: France Cell and Gene Therapy CDMO Market, By Type, By Value, 2023-2029 (USD Million)
Table A45: France Cell and Gene Therapy CDMO Market, By Application, By Value, 2019-2022 (USD Million)
Table A46: France Cell and Gene Therapy CDMO Market, By Application, By Value, 2023-2029 (USD Million)
Table A47: France Cell and Gene Therapy CDMO Market, By Indication, By Value, 2019-2022 (USD Million)
Table A48: France Cell and Gene Therapy CDMO Market, By Indication, By Value, 2023-2029 (USD Million)
Table A49: Italy Cell and Gene Therapy CDMO Market, By Type, By Value, 2019-2022 (USD Million)
Table A50: Italy Cell and Gene Therapy CDMO Market, By Type, By Value, 2023-2029 (USD Million)
Table A51: Italy Cell and Gene Therapy CDMO Market, By Application, By Value, 2019-2022 (USD Million)
Table A52: Italy Cell and Gene Therapy CDMO Market, By Application, By Value, 2023-2029 (USD Million)
Table A53: Italy Cell and Gene Therapy CDMO Market, By Indication, By Value, 2019-2022 (USD Million)
Table A54: Italy Cell and Gene Therapy CDMO Market, By Indication, By Value, 2023-2029 (USD Million)
Table A55: Rest of Europe Cell and Gene Therapy CDMO Market, By Type, By Value, 2019-2022 (USD Million)
Table A56: Rest of Europe Cell and Gene Therapy CDMO Market, By Type, By Value, 2023-2029 (USD Million)
Table A57: Rest of Europe Cell and Gene Therapy CDMO Market, By Application, By Value, 2019-2022 (USD Million)
Table A58: Rest of Europe Cell and Gene Therapy CDMO Market, By Application, By Value, 2023-2029 (USD Million)
Table A59: Rest of Europe Cell and Gene Therapy CDMO Market, By Indication, By Value, 2019-2022 (USD Million)
Table A60: Rest of Europe Cell and Gene Therapy CDMO Market, By Indication, By Value, 2023-2029 (USD Million)
Table A61: China Cell and Gene Therapy CDMO Market, By Type, By Value, 2019-2022 (USD Million)
Table A62: China Cell and Gene Therapy CDMO Market, By Type, By Value, 2023-2029 (USD Million)
Table A63: China Cell and Gene Therapy CDMO Market, By Application, By Value, 2019-2022 (USD Million)
Table A64: China Cell and Gene Therapy CDMO Market, By Application, By Value, 2023-2029 (USD Million)
Table A65: China Cell and Gene Therapy CDMO Market, By Indication, By Value, 2019-2022 (USD Million)
Table A66: China Cell and Gene Therapy CDMO Market, By Indication, By Value, 2023-2029 (USD Million)
Table A67: Japan Cell and Gene Therapy CDMO Market, By Type, By Value, 2019-2022 (USD Million)
Table A68: Japan Cell and Gene Therapy CDMO Market, By Type, By Value, 2023-2029 (USD Million)
Table A69: Japan Cell and Gene Therapy CDMO Market, By Application, By Value, 2019-2022 (USD Million)
Table A70: Japan Cell and Gene Therapy CDMO Market, By Application, By Value, 2023-2029 (USD Million)
Table A71: Japan Cell and Gene Therapy CDMO Market, By Indication, By Value, 2019-2022 (USD Million)
Table A72: Japan Cell and Gene Therapy CDMO Market, By Indication, By Value, 2023-2029 (USD Million)
Table A73: South Korea Cell and Gene Therapy CDMO Market, By Type, By Value, 2019-2022 (USD Million)
Table A74: South Korea Cell and Gene Therapy CDMO Market, By Type, By Value, 2023-2029 (USD Million)
Table A75: South Korea Cell and Gene Therapy CDMO Market, By Application, By Value, 2019-2022 (USD Million)
Table A76: South Korea Cell and Gene Therapy CDMO Market, By Application, By Value, 2023-2029 (USD Million)
Table A77: South Korea Cell and Gene Therapy CDMO Market, By Indication, By Value, 2019-2022 (USD Million)
Table A78: South Korea Cell and Gene Therapy CDMO Market, By Indication, By Value, 2023-2029 (USD Million)
Table A79: India Cell and Gene Therapy CDMO Market, By Type, By Value, 2019-2022 (USD Million)
Table A80: India Cell and Gene Therapy CDMO Market, By Type, By Value, 2023-2029 (USD Million)
Table A81: India Cell and Gene Therapy CDMO Market, By Application, By Value, 2019-2022 (USD Million)
Table A82: India Cell and Gene Therapy CDMO Market, By Application, By Value, 2023-2029 (USD Million)
Table A83: India Cell and Gene Therapy CDMO Market, By Indication, By Value, 2019-2022 (USD Million)
Table A84: India Cell and Gene Therapy CDMO Market, By Indication, By Value, 2023-2029 (USD Million)
Table A85: Rest of Asia Pacific Cell and Gene Therapy CDMO Market, By Type, By Value, 2019-2022 (USD Million)
Table A86: Rest of Asia Pacific Cell and Gene Therapy CDMO Market, By Type, By Value, 2023-2029 (USD Million)
Table A87: Rest of Asia Pacific Cell and Gene Therapy CDMO Market, By Application, By Value, 2019-2022 (USD Million)
Table A88: Rest of Asia Pacific Cell and Gene Therapy CDMO Market, By Application, By Value, 2023-2029 (USD Million)
Table A89: Rest of Asia Pacific Cell and Gene Therapy CDMO Market, By Indication, By Value, 2019-2022 (USD Million)
Table A90: Rest of Asia Pacific Cell and Gene Therapy CDMO Market, By Indication, By Value, 2023-2029 (USD Million)
Table A91: Oxford Biomedica Financials, 2020-2022
Table A92: Lonza Group AG Financials, 2020-2022
Table A93: Catalent, Inc. Financials, 2020-2022
Table A94: Samsung Biologics Financials, 2020-2022
Table A95: WuXi Biologics Financials, 2020-2022
Table A96: Pfizer CentreOne Financials, 2020-2022
Table A97: Danaher Corporation Financials, 2020-2022
Table A98: Thermo Fisher Scientific Inc. Financials, 2020-2022
Table A99: Charles River Laboratories International, Inc. Financials, 2020-2022
Table A100: Novartis AG Financials, 2020-2022
Executive Summary
Azoth Analytics has released a research report titled "Global Cell and Gene Therapy CDMO Market (2024 Edition)" which provides a complete analysis of the Global Cell and Gene Therapy CDMO Market industry in terms of market segmentation by Type (Cell Therapy, Gene Therapy, Gene-modified Cell Therapies), Application (Clinical, Pre-clinical), Indication (Oncology Diseases, Infectious Diseases, Neurological Disorder, Others) for the historical period of 2019-2022, estimates of 2023 and the forecast for 2024-2029.
The Global Cell and Gene Therapy CDMO market valued at USD 2.54 billion in 2022 is expected to grow at a CAGR of 30.75% during the forecast period of 2024-2029. The global Cell and Gene Therapy CDMO market has been experiencing robust growth and escalating demand, propelled by continuous advancements in cell and gene therapies. With a broadening scope of therapeutic areas and a favourable regulatory environment, the global Cell and Gene Therapy CDMO market is poised for sustained expansion as it plays a pivotal role in the development and commercialization of ground-breaking therapies for various diseases. The global Cell and Gene Therapy CDMO market is expected to grow at an extraordinary rate driven by significant investments from industry players.
The global pipeline of cell and gene therapies has been expanding, covering a wide range of therapeutic areas, including oncology, rare diseases, and genetic disorders. As more therapies advance through clinical trials and toward commercialization, the demand for CDMO services for manufacturing, process development, and scale-up increases.
Global CDMO organisations for cell and gene therapy are expanding, and this is one of the main factors propelling the global Cell and Gene Therapy's overall expansion. With the increasing global demand for advanced cell and gene therapies, CDMOs are proactively setting up production facilities in various locations to meet the changing demands of biotechnology and pharmaceutical companies. These days, CDMOs are essential to the manufacturing of pharmaceuticals. Over the past ten years, CDMOs have grown in prominence due to a more dynamic mergers and acquisition landscape. Serving both local and international markets, there are currently over 600 active Contract Development and Manufacturing Organizations (CDMOs). CDMOs provide specific expertise that helps both "Big Pharma" and smaller inventors to launch products sooner.
The rise of biologics is seen by the number of CDMOs making significant investments in brand-new biomanufacturing facilities. These companies include Boehringer Ingelheim (USD827M investment), Samsung Biologics (USD1.7B investment), Lonza (USD935M expansion), and Fujifilm Diosynth Biotechnologies (USD2B investment).
Additionally, by expanding globally, CDMOs can meet regional regulatory needs, provide customised manufacturing solutions, and improve accessibility for customers who need their services. CDMOs can provide more adaptable and responsive solutions by being present in important worldwide markets. This helps to speed up the development and global commercialization of gene and cell therapies.
One prominent factor restraining the growth of the global Cell and Gene Therapy CDMO market is the high cost of producing viral vectors. As carriers of therapeutic genes into target cells, viral vectors are essential to the development of gene and cell therapies. Viral vector production is a complex procedure that frequently involves specialized techniques, stringent quality control standards, and specialized facilities.
There are now five viral vectors in use for gene therapy. AAV have the biggest market share, followed by lentiviruses, adenoviruses, herpes simplex viruses and retroviruses. The vector manufacturing cost for a single dose might be as high as USD 1-2 million, given the expected price of USD 3-7 million per batch, according to Roland Berger Insights. Therefore, the high cost of producing viral vectors hampers cell and gene therapies from being widely commercialised and made accessible, which limits their uptake and hinders the expansion of the Cell and Gene CDMO market.
Scope of the Report
- The report analyses the Global Cell and Gene Therapy CDMO Market by Value (USD Million).
- The report presents the analysis of Global Cell and Gene Therapy CDMO Market for the historical period of 2019-2022, the estimated year 2023 and the forecast period of 2024-2029.
- The report analyses the Global Cell and Gene Therapy CDMO Market by Type (Cell Therapy, Gene Therapy, Gene-modified Cell Therapies).
- The report analyses the Cell and Gene Therapy CDMO Market by Application (Clinical, Pre-clinical).
- The report analyses the Cell and Gene Therapy CDMO Market by Indication (Oncology Diseases, Infectious Diseases, Neurological Disorder, Other Indications).
- The report analyses the Cell and Gene Therapy CDMO Market by Region (Americas, Europe, Asia Pacific, Middle East & Africa).
- The report analyses the Cell and Gene Therapy CDMO Market by Country (United States, Canada, United Kingdom, Germany, France, Italy, China, Japan, South Korea, India).
- The key insights of the report have been presented through the frameworks of SWOT and Porter's Five Forces Analysis.
- Also, the major opportunities, trends, drivers and challenges of the industry have been analyzed in the report.
- The report tracks competitive developments, strategies, mergers and acquisitions and new product development. The companies analysed in the report include Oxford Biomedica, Lonza Group AG, Catalent, Inc., Samsung Biologics, WuXi Biologics, Pfizer CentreOne, Danaher Corporation, Thermo Fisher Scientific Inc., Charles River Laboratories International, Inc., Novartis AG.
Table of Contents
1. Market Background
- 1.1 Scope and Product Outlook
- 1.2 Executive Summary
- 1.3 Research Methodology
2. Strategic Recommendations
3. Global Cell and Gene Therapy CDMO Market: Historic and Forecast (2019-2029)
- 3.1 Impact Analysis of Macro Economic Factors on Cell and Gene Therapy CDMO Market
- 3.2 Cell and Gene Therapy Pipeline
- 3.3 Clinical AAV Gene Therapies
- 3.4 Approvals & Drugs by Therapy Area
- 3.5 Approved Therapies and Pipeline
- 3.6 Gene Therapy Pipeline
- 3.7 Gene Therapy Breakdown
- 3.8 Gene Therapy Pipeline: Most Commonly Targeted Therapeutic Areas
- 3.9 Cell and Gene Therapy Landscape
- 3.10 Global Cell and Gene Therapy CDMO Market: Dashboard
- 3.11 Global Cell and Gene Therapy CDMO Market: Market Value Assessment, 2019-2029 (USD Million)
- 3.12 Global Cell and Gene Therapy CDMO Market: Recent Development & Approved Cell and Gene Therapies
- 3.13 Global Cell and Gene Therapy CDMO Market: Recent M&A and Developments
- 3.14 Impact of COVID-19 on Cell and Gene Therapy CDMO Market
- 3.15 Global Cell and Gene Therapy CDMO Market Segmentation: By Type
- 3.15.1 Global Cell and Gene Therapy CDMO Market, By Type Overview
- 3.15.2 Global Cell and Gene Therapy CDMO Market Size, By Cell Therapy, By Value, 2019H-2029F (USD Million & CAGR)
- 3.15.3 Global Cell and Gene Therapy CDMO Market Size, By Gene Therapy, By Value, 2019H-2029F (USD Million & CAGR)
- 3.15.4 Global Cell and Gene Therapy CDMO Market Size, By Gene-modified Cell Therapies, By Value, 2019H-2029F (USD Million & CAGR)
- 3.16 Global Cell and Gene Therapy CDMO Market Segmentation: By Application
- 3.16.1 Global Cell and Gene Therapy CDMO Market, By Application Overview
- 3.16.2 Global Cell and Gene Therapy CDMO Market Size, By Clinical, By Value, 2019H-2029F (USD Million & CAGR)
- 3.16.3 Global Cell and Gene Therapy CDMO Market Size, By Pre-clinical, By Value, 2019H-2029F (USD Million & CAGR)
- 3.17 Global Cell and Gene Therapy CDMO Market Segmentation: By Indication
- 3.17.1 Global Cell and Gene Therapy CDMO Market, By Indication Overview
- 3.17.2 Global Cell and Gene Therapy CDMO Market Size, By Oncology Diseases, By Value, 2019H-2029F (USD Million & CAGR)
- 3.17.3 Global Cell and Gene Therapy CDMO Market Size, By Infectious Diseases, By Value, 2019H-2029F (USD Million & CAGR)
- 3.17.4 Global Cell and Gene Therapy CDMO Market Size, By Neurological Disorder, By Value, 2019H-2029F (USD Million & CAGR)
- 3.17.5 Global Cell and Gene Therapy CDMO Market Size, By Other Indications, By Value, 2019H-2029F (USD Million & CAGR)
4. Global Cell and Gene Therapy CDMO Market: Regional Analysis
- 4.1 Regional Coverage of the Study
- 4.2 Regional Snapshot
5. Americas Cell and Gene Therapy CDMO Market: Historic and Forecast (2019-2029)
- 5.1 Americas Cell and Gene Therapy CDMO Market: Snapshot
- 5.2 Americas Cell and Gene Therapy CDMO Market: Market Value Assessment, 2019-2029 (USD Million & CAGR)
- 5.3 Americas Cell and Gene Therapy CDMO Market: Key Factors
- 5.4 Americas Cell and Gene Therapy CDMO Market: Segment Analysis
- 5.5 Americas Cell and Gene Therapy CDMO Market Segmentation: By Type
- 5.5.1 Americas Cell and Gene Therapy CDMO Market, By Type Overview
- 5.5.2 Americas Cell and Gene Therapy CDMO Market Size, By Cell Therapy, By Value, 2019H-2029F (USD Million & CAGR)
- 5.5.3 Americas Cell and Gene Therapy CDMO Market Size, By Gene Therapy, By Value, 2019H-2029F (USD Million & CAGR)
- 5.5.4 Americas Cell and Gene Therapy CDMO Market Size, By Gene-modified Cell Therapies, By Value, 2019H-2029F (USD Million & CAGR)
- 5.6 Americas Cell and Gene Therapy CDMO Market Segmentation: By Application
- 5.6.1 Americas Cell and Gene Therapy CDMO Market, By Application Overview
- 5.6.2 Americas Cell and Gene Therapy CDMO Market Size, By Clinical, By Value, 2019H-2029F (USD Million & CAGR)
- 5.6.3 Americas Cell and Gene Therapy CDMO Market Size, By Pre-clinical, By Value, 2019H-2029F (USD Million & CAGR)
- 5.7 Americas Cell and Gene Therapy CDMO Market Segmentation: By Indication
- 5.7.1 Americas Cell and Gene Therapy CDMO Market, By Indication Overview
- 5.7.2 Americas Cell and Gene Therapy CDMO Market Size, By Oncology Diseases, By Value, 2019H-2029F (USD Million & CAGR)
- 5.7.3 Americas Cell and Gene Therapy CDMO Market Size, By Infectious Diseases, By Value, 2019H-2029F (USD Million & CAGR)
- 5.7.4 Americas Cell and Gene Therapy CDMO Market Size, By Neurological Disorder, By Value, 2019H-2029F (USD Million & CAGR)
- 5.7.5 Americas Cell and Gene Therapy CDMO Market Size, By Other Indications, By Value, 2019H-2029F (USD Million & CAGR)
- 5.8 Americas Cell and Gene Therapy CDMO Market Segmentation: By Country
- 5.8.1 Americas Cell and Gene Therapy CDMO Market, By Country Overview
- 5.8.2 United States Cell and Gene Therapy CDMO Market: Market Size and CAGR, 2019-2029 (USD Million & CAGR)
- 5.8.2.1 United States Cell and Gene Therapy CDMO Market, By Type
- 5.8.2.2 United States Cell and Gene Therapy CDMO Market, By Application
- 5.8.2.3 United States Cell and Gene Therapy CDMO Market, By Indication
- 5.8.3 Canada Cell and Gene Therapy CDMO Market: Market Size and CAGR, 2019-2029 (USD Million & CAGR)
- 5.8.3.1 Canada Cell and Gene Therapy CDMO Market, By Type
- 5.8.3.2 Canada Cell and Gene Therapy CDMO Market, By Application
- 5.8.3.3 Canada Cell and Gene Therapy CDMO Market, By Indication
- 5.8.4 Rest of Americas Cell and Gene Therapy CDMO Market: Market Size and CAGR, 2019-2029 (USD Million & CAGR)
- 5.8.4.1 Rest of Americas Cell and Gene Therapy CDMO Market, By Type
- 5.8.4.2 Rest of Americas Cell and Gene Therapy CDMO Market, By Application
- 5.8.4.3 Rest of Americas Cell and Gene Therapy CDMO Market, By Indication
6. Europe Cell and Gene Therapy CDMO Market: Historic and Forecast (2019-2029)
- 6.1 Europe Cell and Gene Therapy CDMO Market: Snapshot
- 6.2 Europe Cell and Gene Therapy CDMO Market: Market Value Assessment, 2019-2029 (USD Million & CAGR)
- 6.3 Europe Cell and Gene Therapy CDMO Market: Key Factors
- 6.4 Europe Cell and Gene Therapy CDMO Market: Segment Analysis
- 6.5 Europe Cell and Gene Therapy CDMO Market Segmentation: By Type
- 6.5.1 Europe Cell and Gene Therapy CDMO Market, By Type Overview
- 6.5.2 Europe Cell and Gene Therapy CDMO Market Size, By Cell Therapy, By Value, 2019H-2029F (USD Million & CAGR)
- 6.5.3 Europe Cell and Gene Therapy CDMO Market Size, By Gene Therapy, By Value, 2019H-2029F (USD Million & CAGR)
- 6.5.4 Europe Cell and Gene Therapy CDMO Market Size, By Gene-modified Cell Therapies, By Value, 2019H-2029F (USD Million & CAGR)
- 6.6 Europe Cell and Gene Therapy CDMO Market Segmentation: By Application
- 6.6.1 Europe Cell and Gene Therapy CDMO Market, By Application Overview
- 6.6.2 Europe Cell and Gene Therapy CDMO Market Size, By Clinical, By Value, 2019H-2029F (USD Million & CAGR)
- 6.6.3 Europe Cell and Gene Therapy CDMO Market Size, By Pre-clinical, By Value, 2019H-2029F (USD Million & CAGR)
- 6.7 Europe Cell and Gene Therapy CDMO Market Segmentation: By Indication
- 6.7.1 Europe Cell and Gene Therapy CDMO Market, By Indication Overview
- 6.7.2 Europe Cell and Gene Therapy CDMO Market Size, By Oncology Diseases, By Value, 2019H-2029F (USD Million & CAGR)
- 6.7.3 Europe Cell and Gene Therapy CDMO Market Size, By Infectious Diseases, By Value, 2019H-2029F (USD Million & CAGR)
- 6.7.4 Europe Cell and Gene Therapy CDMO Market Size, By Neurological Disorder, By Value, 2019H-2029F (USD Million & CAGR)
- 6.7.5 Europe Cell and Gene Therapy CDMO Market Size, By Other Indications, By Value, 2019H-2029F (USD Million & CAGR)
- 6.8 Europe Cell and Gene Therapy CDMO Market Segmentation: By Country
- 6.8.1 Europe Cell and Gene Therapy CDMO Market, By Country Overview
- 6.8.2 United Kingdom Cell and Gene Therapy CDMO Market: Market Size and CAGR, 2019-2029 (USD Million & CAGR)
- 6.8.2.1 United Kingdom Cell and Gene Therapy CDMO Market, By Type
- 6.8.2.2 United Kingdom Cell and Gene Therapy CDMO Market, By Application
- 6.8.2.3 United Kingdom Cell and Gene Therapy CDMO Market, By Indication
- 6.8.3 Germany Cell and Gene Therapy CDMO Market: Market Size and CAGR, 2019-2029 (USD Million & CAGR)
- 6.8.3.1 Germany Cell and Gene Therapy CDMO Market, By Type
- 6.8.3.2 Germany Cell and Gene Therapy CDMO Market, By Application
- 6.8.3.3 Germany Cell and Gene Therapy CDMO Market, By Indication
- 6.8.4 France Cell and Gene Therapy CDMO Market: Market Size and CAGR, 2019-2029 (USD Million & CAGR)
- 6.8.4.1 France Cell and Gene Therapy CDMO Market, By Type
- 6.8.4.2 France Cell and Gene Therapy CDMO Market, By Application
- 6.8.4.3 France Cell and Gene Therapy CDMO Market, By Indication
- 6.8.5 Italy Cell and Gene Therapy CDMO Market: Market Size and CAGR, 2019-2029 (USD Million & CAGR)
- 6.8.5.1 Italy Cell and Gene Therapy CDMO Market, By Type
- 6.8.5.2 Italy Cell and Gene Therapy CDMO Market, By Application
- 6.8.5.3 Italy Cell and Gene Therapy CDMO Market, By Indication
- 6.8.6 Rest of Europe Cell and Gene Therapy CDMO Market: Market Size and CAGR, 2019-2029 (USD Million & CAGR)
- 6.8.6.1 Rest of Europe Cell and Gene Therapy CDMO Market, By Type
- 6.8.6.2 Rest of Europe Cell and Gene Therapy CDMO Market, By Application
- 6.8.6.3 Rest of Europe Cell and Gene Therapy CDMO Market, By Indication
7. Asia Pacific Cell and Gene Therapy CDMO Market: Historic and Forecast (2019-2029)
- 7.1 Asia Pacific Cell and Gene Therapy CDMO Market: Snapshot
- 7.2 Asia Pacific Cell and Gene Therapy CDMO Market: Market Value Assessment, 2019-2029 (USD Million & CAGR)
- 7.3 Asia Pacific Cell and Gene Therapy CDMO Market: Key Factors
- 7.4 Asia Pacific Cell and Gene Therapy CDMO Market: Segment Analysis
- 7.5 Asia Pacific Cell and Gene Therapy CDMO Market Segmentation: By Type
- 7.5.1 Asia Pacific Cell and Gene Therapy CDMO Market, By Type Overview
- 7.5.2 Asia Pacific Cell and Gene Therapy CDMO Market Size, By Cell Therapy, By Value, 2019H-2029F (USD Million & CAGR)
- 7.5.3 Asia Pacific Cell and Gene Therapy CDMO Market Size, By Gene Therapy, By Value, 2019H-2029F (USD Million & CAGR)
- 7.5.4 Asia Pacific Cell and Gene Therapy CDMO Market Size, By Gene-modified Cell Therapies, By Value, 2019H-2029F (USD Million & CAGR)
- 7.6 Asia Pacific Cell and Gene Therapy CDMO Market Segmentation: By Application
- 7.6.1 Asia Pacific Cell and Gene Therapy CDMO Market, By Application Overview
- 7.6.2 Asia Pacific Cell and Gene Therapy CDMO Market Size, By Clinical, By Value, 2019H-2029F (USD Million & CAGR)
- 7.6.3 Asia Pacific Cell and Gene Therapy CDMO Market Size, By Pre-clinical, By Value, 2019H-2029F (USD Million & CAGR)
- 7.7 Asia Pacific Cell and Gene Therapy CDMO Market Segmentation: By Indication
- 7.7.1 Asia Pacific Cell and Gene Therapy CDMO Market, By Indication Overview
- 7.7.2 Asia Pacific Cell and Gene Therapy CDMO Market Size, By Oncology Diseases, By Value, 2019H-2029F (USD Million & CAGR)
- 7.7.3 Asia Pacific Cell and Gene Therapy CDMO Market Size, By Infectious Diseases, By Value, 2019H-2029F (USD Million & CAGR)
- 7.7.4 Asia Pacific Cell and Gene Therapy CDMO Market Size, By Neurological Disorder, By Value, 2019H-2029F (USD Million & CAGR)
- 7.7.5 Asia Pacific Cell and Gene Therapy CDMO Market Size, By Other Indications, By Value, 2019H-2029F (USD Million & CAGR)
- 7.8 Asia Pacific Cell and Gene Therapy CDMO Market Segmentation: By Country
- 7.8.1 Asia Pacific Cell and Gene Therapy CDMO Market, By Country Overview
- 7.8.2 China Cell and Gene Therapy CDMO Market: Market Size and CAGR, 2019-2029 (USD Million & CAGR)
- 7.8.2.1 China Cell and Gene Therapy CDMO Market, By Type
- 7.8.2.2 China Cell and Gene Therapy CDMO Market, By Application
- 7.8.2.3 China Cell and Gene Therapy CDMO Market, By Indication
- 7.8.3 Japan Cell and Gene Therapy CDMO Market: Market Size and CAGR, 2019-2029 (USD Million & CAGR)
- 7.8.3.1 Japan Cell and Gene Therapy CDMO Market, By Type
- 7.8.3.2 Japan Cell and Gene Therapy CDMO Market, By Application
- 7.8.3.3 Japan Cell and Gene Therapy CDMO Market, By Indication
- 7.8.4 South Korea Cell and Gene Therapy CDMO Market: Market Size and CAGR, 2019-2029 (USD Million & CAGR)
- 7.8.4.1 South Korea Cell and Gene Therapy CDMO Market, By Type
- 7.8.4.2 South Korea Cell and Gene Therapy CDMO Market, By Application
- 7.8.4.3 South Korea Cell and Gene Therapy CDMO Market, By Indication
- 7.8.5 India Cell and Gene Therapy CDMO Market: Market Size and CAGR, 2019-2029 (USD Million & CAGR)
- 7.8.5.1 India Cell and Gene Therapy CDMO Market, By Type
- 7.8.5.2 India Cell and Gene Therapy CDMO Market, By Application
- 7.8.5.3 India Cell and Gene Therapy CDMO Market, By Indication
- 7.8.6 Rest of Asia Pacific Cell and Gene Therapy CDMO Market: Market Size and CAGR, 2019-2029 (USD Million & CAGR)
- 7.8.7.1 Rest of Asia Pacific Cell and Gene Therapy CDMO Market, By Type
- 7.8.7.2 Rest of Asia Pacific Cell and Gene Therapy CDMO Market, By Application
- 7.8.7.3 Rest of Asia Pacific Cell and Gene Therapy CDMO Market, By Indication
8. Middle East & Africa Cell and Gene Therapy CDMO Market: Historic and Forecast (2019-2029)
- 8.1 Middle East & Africa Cell and Gene Therapy CDMO Market: Snapshot
- 8.2 Middle East & Africa Cell and Gene Therapy CDMO Market: Market Value Assessment, 2019-2029 (USD Million & CAGR)
- 8.3 Middle East & Africa Cell and Gene Therapy CDMO Market: Key Factors
- 8.4 Middle East & Africa Cell and Gene Therapy CDMO Market: Segment Analysis
- 8.5 Middle East & Africa Cell and Gene Therapy CDMO Market Segmentation: By Type
- 8.5.1 Middle East & Africa Cell and Gene Therapy CDMO Market, By Type Overview
- 8.5.2 Middle East & Africa Cell and Gene Therapy CDMO Market Size, By Cell Therapy, By Value, 2019H-2029F (USD Million & CAGR)
- 8.5.3 Middle East & Africa Cell and Gene Therapy CDMO Market Size, By Gene Therapy, By Value, 2019H-2029F (USD Million & CAGR)
- 8.5.4 Middle East & Africa Cell and Gene Therapy CDMO Market Size, By Gene-modified Cell Therapies, By Value, 2019H-2029F (USD Million & CAGR)
- 8.6 Middle East & Africa Cell and Gene Therapy CDMO Market Segmentation: By Application
- 8.6.1 Middle East & Africa Cell and Gene Therapy CDMO Market, By Application Overview
- 8.6.2 Middle East & Africa Cell and Gene Therapy CDMO Market Size, By Clinical, By Value, 2019H-2029F (USD Million & CAGR)
- 8.6.3 Middle East & Africa Cell and Gene Therapy CDMO Market Size, By Pre-clinical, By Value, 2019H-2029F (USD Million & CAGR)
- 8.7 Middle East & Africa Cell and Gene Therapy CDMO Market Segmentation: By Indication
- 8.7.1 Middle East & Africa Cell and Gene Therapy CDMO Market, By Indication Overview
- 8.7.2 Middle East & Africa Cell and Gene Therapy CDMO Market Size, By Oncology Diseases, By Value, 2019H-2029F (USD Million & CAGR)
- 8.7.3 Middle East & Africa Cell and Gene Therapy CDMO Market Size, By Infectious Diseases, By Value, 2019H-2029F (USD Million & CAGR)
- 8.7.4 Middle East & Africa Cell and Gene Therapy CDMO Market Size, By Neurological Disorder, By Value, 2019H-2029F (USD Million & CAGR)
- 8.7.5 Middle East & Africa Cell and Gene Therapy CDMO Market Size, By Other Indications, By Value, 2019H-2029F (USD Million & CAGR)
9. Market Dynamics
- 9.1 Impact Assessment of Market Dynamics on Global Cell and Gene Therapy CDMO Market
- 9.2 Drivers
- 9.3 Restraints
- 9.4 Trends
10. Industry Ecosystem Analysis
- 10.1 Value Chain Analysis
- 10.2 Porter's Five Forces Model
11. Competitive Positioning
- 11.1 Companies' Product Positioning
- 11.2 Competitive Positioning of Oxford Biomedica's Viral Vector Offering
- 11.3 Market Position Matrix
- 11.4 Market Share Analysis of Cell and Gene Therapy CDMO Market
- 11.5 Company Profiles
- 11.5.1 Oxford Biomedica
- 11.5.2 Lonza Group AG
- 11.5.3 Catalent, Inc.
- 11.5.4 Samsung Biologics
- 11.5.5 WuXi Biologics
- 11.5.6 Pfizer CentreOne
- 11.5.7 Danaher Corporation
- 11.5.8 Thermo Fisher Scientific Inc.
- 11.5.9 Charles River Laboratories International, Inc.
- 11.5.10 Novartis AG
