|
|
市場調査レポート
商品コード
1606468
マイクロCT市場:製品別、用途別、エンドユーザー別、国別、地域別 - 産業分析、市場規模、市場シェア、2024~2032年予測Micro Computed Tomography Market, By Product, By Application, By End User, By Country, and By Region - Industry Analysis, Market Size, Market Share & Forecast from 2024-2032 |
||||||
|
|||||||
カスタマイズ可能
|
|||||||

| マイクロCT市場:製品別、用途別、エンドユーザー別、国別、地域別 - 産業分析、市場規模、市場シェア、2024~2032年予測 |
|
出版日: 2024年11月04日
発行: AnalystView Market Insights
ページ情報: 英文 304 Pages
納期: 2~3営業日
|

全表示
- 概要
- 目次
レポートハイライト
マイクロCT市場規模は2023年に2億1,008万米ドルとなり、2024年から2032年にかけてCAGR 9.20%で拡大します。
マイクロCT市場 - 市場力学
非破壊検査、イメージングにおける前臨床・生物医学研究開発の需要増加が市場需要を促進する見込み
マイクロCTの高解像度画像は、骨密度、組織の微細構造、小動物の形態を研究する前臨床研究において非常に貴重です。疾病の進行、骨折、がん研究、薬剤の有効性を理解するために使用されることが増えており、市場の成長を後押ししています。非破壊検査は、内部構造解析が重要な材料科学、航空宇宙、製造などの産業で不可欠です。マイクロCTは、試料に損傷を与えることなく、内部の欠陥を可視化し、気孔率を分析し、製品の完全性を検証する方法を提供します。整形外科や歯科などの医療分野では、骨構造、骨密度、歯科用途の分析にマイクロCTが使用されています。これは、インプラントや補綴物、その他の医療機器の設計や試験に役立ち、臨床研究や応用研究におけるマイクロCTの有用性を拡大しています。
マイクロCTのハードウェアと解析ソフトウェアの進歩は、より高解像度のイメージング、より高速なスキャン時間、より使いやすいインターフェースをもたらしました。これらの開発により、ワークフローの効率が向上し、マイクロCTをより幅広いユーザーが利用できるようになりました。新素材やナノテクノロジーの開発がますます重視される中、マイクロCTはこれらの材料の内部微細構造や空隙率の評価に不可欠です。マイクロCTは、研究者が顕微鏡レベルで詳細な構造特性と相互作用を観察するのに役立ち、材料科学における技術革新を支援します。
マイクロCT市場 - 主要インサイト
リサーチアナリストの分析によると、世界市場は予測期間(2024-2032年)に約9.20%のCAGRで年間成長すると予測されています。
製品セグメンテーションに基づくと、生体外マイクロCTセグメントは、生物医学研究の高まりにより、2023年に最大の市場シェアを示すと予測されました。
用途セグメンテーションに基づくと、イメージング機能の急速な進歩により、ライフサイエンス分野が2023年の主要用途分野となりました。
エンドユーザーセグメンテーションに基づくと、主に生物医学研究、科学的発見などの増加により、診断画像ラボセグメントが2023年の主要エンドユーザーセグメントでした。
地域別では、北米が2023年の主要収益源でした。これは、新たな技術革新や発見において政府機関が支援しているためです。
マイクロCT市場 - セグメンテーション分析:
世界のマイクロCT市場は、製品、用途、エンドユーザー、地域に基づいてセグメント化されます。
製品は、生体内マイクロCTと生体外マイクロCTの2つに分類されます。生体外マイクロCTセグメントが市場を独占しています。がん、整形外科、再生医療における用途の増加が、このセグメントの需要を押し上げています。
市場は用途別に5つのカテゴリーに分類されます:ライフサイエンス、歯科、植物・食品、石油・ガス地質、その他です。ライフサイエンス分野が市場を独占しています。精密な3D画像により、マイクロCTは研究者がより良い方法で構造変化を観察することを可能にし、同分野の成長を後押ししています。
市場はエンドユーザーによって、研究機関、画像診断ラボ、その他の3つに分類されます。画像診断ラボセグメントは、予測期間中に最も速い速度で成長すると予測されています。人工知能(AI)と機械学習技術の統合が市場の需要を支えています。
マイクロCT市場 - 地理的洞察
地理的には、この市場は北米、ラテンアメリカ、欧州、アジア太平洋、中東・アフリカの地域に広がっています。北米(主に米国)は、ヘルスケア、生物医学研究、材料科学への旺盛な投資により、主要地域となっています。非破壊検査、前臨床研究、品質管理に対する需要は、ヘルスケアと産業分野の両方で高いです。アジア太平洋(APAC)は、工業化の進展、ヘルスケアの急速な進歩、製造業における品質管理の焦点の拡大により、急成長している地域の一つです。中国、日本、韓国は、エレクトロニクス、自動車、材料試験における大規模な産業用途で注目されています。この地域の生物医学研究分野の成長は、費用対効果の高い生産と相まって、市場の成長を維持すると予想されます。
マイクロCT市場 - 競合情勢:
マイクロコンピューテッドトモグラフィー(マイクロCT)市場は競争が激しく、複数の主要企業が高度なイメージング技術に注力し、さまざまな産業への応用を拡大しています。各社は、ライフサイエンス、航空宇宙、エレクトロニクス分野など、特定の産業ニーズに合わせたマイクロCTモデルの開発を進めています。このような専門化により、企業は高解像度イメージングに最適化されたソリューションを提供できるようになり、競争優位性を高めています。多くの企業がマイクロCTシステムにAIを活用した解析を組み込んでおり、より迅速で正確な画像処理と欠陥検出を可能にしています。この動向は、特に産業用途において、自動化された大規模な画像解析の需要に対応するのに役立っています。各社は新興地域、特にヘルスケア・インフラの成長により高度な画像処理技術への需要が高まっているアジア太平洋地域での拡大機会を模索しています。
2023年、Bruker Corporationは分子・材料研究、工業・応用分析向けの高性能科学機器とソリューションの提供を開始しました。Skyscan 1272やSkyscan 2214を含むマイクロCT製品のSkyscanシリーズです。
2022年、Perkin Elmer Inc.、前臨床研究向けに高速・高解像度のイメージングを実現するQuantum GX2マイクロCTイメージングシステム、SkyScanシリーズを発表しました。
目次
第1章 マイクロCT市場概要
- 調査範囲
- 市場推定年
第2章 エグゼクティブサマリー
- 市場内訳
- 競合考察
第3章 マイクロCTの主要市場動向
- 市場促進要因
- 市場抑制要因
- 市場機会
- 市場の将来動向
第4章 マイクロCT産業の調査
- PEST分析
- ポーターのファイブフォース分析
- 成長見通しマッピング
- 規制枠組み分析
第5章 マイクロCT市場: COVID-19の影響分析
- COVID-19以前の影響分析
- COVID-19後の影響分析
第6章 マイクロCT市場情勢
- マイクロCT市場シェア分析、2023年
- 主要メーカー別内訳データ
- 既存企業の分析
- 新興企業の分析
第7章 マイクロCT市場:製品別
- 概要
- 製品別セグメントシェア分析
- 生体内マイクロCT
- 生体外マイクロCT
第8章 マイクロCT市場:用途別
- 概要
- 用途別セグメントシェア分析
- ライフサイエンス
- 歯科
- 植物・食品
- 石油・ガス地質
- その他
第9章 マイクロCT市場:エンドユーザー別
- 概要
- エンドユーザー別セグメントシェア分析
- 調査機関
- 画像診断ラボ
- その他
第10章 マイクロCT市場-地域別
- イントロダクション
- 北米
- 概要
- 北米の主要メーカー
- 米国
- カナダ
- 欧州
- 概要
- 欧州の主要メーカー
- ドイツ
- イタリア
- 英国
- フランス
- ロシア
- オランダ
- スウェーデン
- ポーランド
- その他
- アジア太平洋(APAC)
- 概要
- アジア太平洋地域の主要メーカー
- インド
- 中国
- 日本
- 韓国
- オーストラリア
- タイ
- インドネシア
- フィリピン
- その他
- ラテンアメリカ
- 概要
- ラテンアメリカの主要メーカー
- ブラジル
- メキシコ
- アルゼンチン
- コロンビア
- その他
- 中東およびアフリカ
- 概要
- 中東・アフリカの主要メーカー
- サウジアラビア
- アラブ首長国連邦
- イスラエル
- トルコ
- アルジェリア
- エジプト
- その他
第11章 主要ベンダー分析 - マイクロCT業界
- 競争ダッシュボード
- 企業プロファイル
- Bruker Corporation
- Thermo Fisher Scientific
- ZEISS Group
- Rigaku Corporation
- Nikon Metrology
- SCANTECH
- YXLON International
- North Star Imaging(NSI)
- Micro Photonics
- Perkin Elmer Inc.
- SkyScan
- Oxford Instruments
- GE Inspection Technologies
- TESCAN
- Mediso Medical Imaging Systems
- Phoenix X-ray
- Others
第12章 アナリストの全方位展望
REPORT HIGHLIGHT
Micro Computed Tomography Market size was valued at USD 210.08 Million in 2023, expanding at a CAGR of 9.20% from 2024 to 2032.
Micro-Computed Tomography, often abbreviated as micro-CT, is an imaging technique that uses X-rays to create highly detailed, 3D images of small objects or the internal structures within them. It's like traditional CT (computed tomography) scanning but at a much higher resolution, typically in the micrometer range, allowing for precise imaging at a cellular or sub-cellular level. Micro-CT is widely used in fields like materials science, biology, geology, and medical research to analyze the internal composition and structure.
Micro Computed Tomography Market- Market Dynamics
Increasing demand in preclinical & biomedical research and development in NDT testing, imaging is expected to propel market demand
Micro-CT's high-resolution imaging is invaluable in preclinical research for studying bone density, microarchitecture of tissues, and the morphology of small animals. It is increasingly used to understand disease progression, bone fractures, cancer studies, and drug efficacy, boosting market growth. Non-destructive testing is essential in industries like materials science, aerospace, and manufacturing, where internal structural analysis is critical. Micro-CT provides a way to visualize internal defects, analyze porosity, and validate product integrity without damaging the samples. In medical fields such as orthopedics and dentistry, micro-CT is used to analyze bone structure, bone density, and dental applications. This helps in the design and testing of implants, prosthetics, and other medical devices, expanding micro-CT's utility in clinical and applied research.
Advances in micro-CT hardware and analysis software have led to higher-resolution imaging, faster scanning times, and more user-friendly interfaces. These developments improve workflow efficiency and make micro-CT accessible to a broader range of users. With the increasing emphasis on developing new materials and nanotechnology, micro-CT is critical for assessing the internal microstructure and porosity of these materials. It helps researchers observe the detailed structural properties and interactions on a microscopic level, supporting innovation in material sciences.
Micro Computed Tomography Market- Key Insights
As per the analysis shared by our research analyst, the global market is estimated to grow annually at a CAGR of around 9.20% over the forecast period (2024-2032)
Based on Product segmentation, the ex-vivo micro-CT segment was predicted to show maximum market share in the year 2023, owing to rising biomedical research.
Based on Application segmentation, the life sciences segment was the leading Application segment in 2023, due to rapid advancement in imaging capabilities.
Based on End-user segmentation, the diagnostic imaging labs segment was the leading End-user segment in 2023, mainly due to rising biomedical research, scientific discovery, etc.
On the basis of region, North America was the leading revenue generator in 2023, due to the supportive government bodies in new innovation and discovery.
Micro Computed Tomography Market- Segmentation Analysis:
Global Micro Computed Tomography Market is segmented on the basis of Product, Application, End User, and Region.
The market is divided into two categories based on Product: in-vivo micro-CT and ex-vivo micro-CT. The ex-vivo micro-CT segment dominates the market. Increasing applications in cancer, orthopedics, and regenerative medicine is boosting segment demand.
The market is divided into five categories based on Application: Life sciences, dentistry, plant & food, oi & gas geology, and others. The life sciences segment dominates the market. With the precise, 3D images, micro-CT allows researchers to observe structural alterations in better way, boosting segment growth.
The market is divided into three categories based on End Users: research institutes, diagnostic imaging labs, and others. The diagnostic imaging labs segment is anticipated to grow at the fastest rate over the forecast period. The integration of artificial intelligence (AI) and machine learning technologies is supporting market demand.
Micro Computed Tomography Market- Geographical Insights
Geographically, this market is widespread in the regions of North America, Latin America, Europe, Asia Pacific, and the Middle East and Africa. North America, mainly the United States, is a leading region due to strong investments in healthcare, biomedical research, and materials science. The demand for non-destructive testing, preclinical research, and quality control is high in both healthcare and industrial sectors. Asia-Pacific (APAC) is one of the fastest-growing regions due to increasing industrialization, rapid advancements in healthcare, and an expanding focus on quality control in manufacturing. China, Japan, and South Korea are notable for their large-scale industrial applications in electronics, automotive, and materials testing. The region's growing biomedical research sector, coupled with cost-effective production, is expected to sustain market growth.
Micro Computed Tomography Market- Competitive Landscape:
The micro-computed tomography (micro-CT) market is competitive, with several leading companies focusing on advanced imaging technology and expanding applications across various industries. Companies are increasingly developing micro-CT models tailored to specific industry needs, such as the life sciences, aerospace, and electronics sectors. This specialization allows companies to provide optimized solutions for high-resolution imaging, enhancing their competitive advantage. Many companies are incorporating AI-driven analysis in their micro-CT systems, which allows for faster, more accurate image processing and defect detection. This trend helps companies meet the demand for automated and large-scale image analysis, especially in industrial applications. Companies are exploring expansion opportunities in emerging regions, particularly in Asia-Pacific, where demand for advanced imaging technology is increasing due to growing healthcare infrastructure.
In 2023, Bruker Corporation started offering high-performance scientific instruments and solutions for molecular and materials research, as well as industrial and applied analysis. The Skyscan series of micro-CT products, including the Skyscan 1272 and Skyscan 2214.
In 2022, Perkin Elmer Inc., introduced Quantum GX2 micro-CT imaging system, which delivers high-speed and high-resolution imaging for preclinical research, and the SkyScan series.
SCOPE OF THE REPORT
The scope of this report covers the market by its major segments, which include as follows:
GLOBAL MICRO COMPUTED TOMOGRAPHY MARKET KEY PLAYERS
- Bruker Corporation
- Thermo Fisher Scientific
- ZEISS Group
- Rigaku Corporation
- Nikon Metrology
- SCANTECH
- YXLON International
- North Star Imaging (NSI)
- Micro Photonics
- Perkin Elmer Inc.
- SkyScan
- Oxford Instruments
- GE Inspection Technologies
- TESCAN
- Mediso Medical Imaging Systems
- Phoenix X-ray
- Others
GLOBAL MICRO COMPUTED TOMOGRAPHY MARKET, BY PRODUCT- MARKET ANALYSIS, 2019-2032
- In-vivo micro-CT
- Ex-vivo micro-CT
GLOBAL MICRO COMPUTED TOMOGRAPHY MARKET, BY APPLICATION- MARKET ANALYSIS, 2019-2032
- Life sciences
- Dentistry
- Plant & food
- Oil & gas geology
- Others
GLOBAL MICRO COMPUTED TOMOGRAPHY MARKET, BY END USER- MARKET ANALYSIS, 2019-2032
- Research institutes
- Diagnostic imaging labs
- Others
GLOBAL MICRO COMPUTED TOMOGRAPHY MARKET, BY REGION- MARKET ANALYSIS, 2019-2032
- North America
- The U.S.
- Canada
- Europe
- Germany
- France
- Italy
- Spain
- United Kingdom
- Russia
- Netherlands
- Sweden
- Poland
- Rest of Europe
- Asia Pacific
- India
- China
- South Korea
- Japan
- Australia
- Thailand
- Indonesia
- Philippines
- Rest of APAC
- Latin America
- Brazil
- Mexico
- Argentina
- Colombia
- Rest of LATAM
- The Middle East and Africa
- Saudi Arabia
- United Arab Emirates
- Israel
- Turkey
- Algeria
- Egypt
- Rest of MEA
Table of Contents
1. Micro Computed Tomography Market Overview
- 1.1. Study Scope
- 1.2. Market Estimation Years
2. Executive Summary
- 2.1. Market Snippet
- 2.1.1. Micro Computed Tomography Market Snippet by Product
- 2.1.2. Micro Computed Tomography Market Snippet by Application
- 2.1.3. Micro Computed Tomography Market Snippet by End User
- 2.1.4. Micro Computed Tomography Market Snippet by Country
- 2.1.5. Micro Computed Tomography Market Snippet by Region
- 2.2. Competitive Insights
3. Micro Computed Tomography Key Market Trends
- 3.1. Micro Computed Tomography Market Drivers
- 3.1.1. Impact Analysis of Market Drivers
- 3.2. Micro Computed Tomography Market Restraints
- 3.2.1. Impact Analysis of Market Restraints
- 3.3. Micro Computed Tomography Market Opportunities
- 3.4. Micro Computed Tomography Market Future Trends
4. Micro Computed Tomography Industry Study
- 4.1. PEST Analysis
- 4.2. Porter's Five Forces Analysis
- 4.3. Growth Prospect Mapping
- 4.4. Regulatory Framework Analysis
5. Micro Computed Tomography Market: COVID-19 Impact Analysis
- 5.1. Pre-COVID-19 Impact Analysis
- 5.2. Post-COVID-19 Impact Analysis
- 5.2.1. Top Performing Segments
- 5.2.2. Marginal Growth Segments
- 5.2.3. Top Looser Segments
- 5.2.4. Marginal Loss Segments
6. Micro Computed Tomography Market Landscape
- 6.1. Micro Computed Tomography Market Share Analysis, 2023
- 6.2. Breakdown Data, by Key Manufacturer
- 6.2.1. Established Players' Analysis
- 6.2.2. Emerging Players' Analysis
7. Micro Computed Tomography Market - By Product
- 7.1. Overview
- 7.1.1. Segment Share Analysis, By Product, 2024 & 2032 (%)
- 7.1.2. In-vivo micro-CT
- 7.1.3. Ex-vivo micro-CT
8. Micro Computed Tomography Market - By Application
- 8.1. Overview
- 8.1.1. Segment Share Analysis, By Application, 2024 & 2032 (%)
- 8.1.2. Life sciences
- 8.1.3. Dentistry
- 8.1.4. Plant & food
- 8.1.5. Oil & gas geology
- 8.1.6. Others
9. Micro Computed Tomography Market - By End User
- 9.1. Overview
- 9.1.1. Segment Share Analysis, By End User, 2024 & 2032 (%)
- 9.1.2. Research institutes
- 9.1.3. Diagnostic imaging labs
- 9.1.4. Others
10. Micro Computed Tomography Market- By Geography
- 10.1. Introduction
- 10.1.1. Segment Share Analysis, By Geography, 2024 & 2032 (%)
- 10.2. North America
- 10.2.1. Overview
- 10.2.2. Micro Computed Tomography Key Manufacturers in North America
- 10.2.3. North America Market Size and Forecast, By Country, 2019 - 2032 (US$ Million)
- 10.2.4. North America Market Size and Forecast, By Product, 2019 - 2032 (US$ Million)
- 10.2.5. North America Market Size and Forecast, By Application, 2019 - 2032 (US$ Million)
- 10.2.6. North America Market Size and Forecast, By End User, 2019 - 2032 (US$ Million)
- 10.2.7. U.S.
- 10.2.7.1. Overview
- 10.2.7.2. Market Analysis, Forecast, and Y-O-Y Growth Rate, 2019 - 2032, (US$ Million)
- 10.2.7.3. U.S. Market Size and Forecast, By Product, 2019 - 2032 (US$ Million)
- 10.2.7.4. U.S. Market Size and Forecast, By Application, 2019 - 2032 (US$ Million)
- 10.2.7.5. U.S. Market Size and Forecast, By End User, 2019 - 2032 (US$ Million)
- 10.2.8. Canada
- 10.2.8.1. Overview
- 10.2.8.2. Market Analysis, Forecast, and Y-O-Y Growth Rate, 2019 - 2032, (US$ Million)
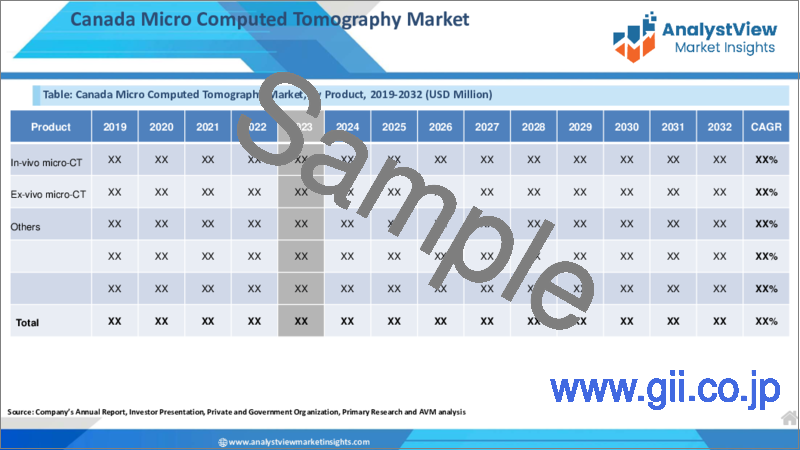
- 10.2.8.3. Canada Market Size and Forecast, By Product, 2019 - 2032 (US$ Million)
- 10.2.8.4. Canada Market Size and Forecast, By Application, 2019 - 2032 (US$ Million)
- 10.2.8.5. Canada Market Size and Forecast, By End User, 2019 - 2032 (US$ Million)
- 10.3. Europe
- 10.3.1. Overview
- 10.3.2. Micro Computed Tomography Key Manufacturers in Europe
- 10.3.3. Europe Market Size and Forecast, By Country, 2019 - 2032 (US$ Million)
- 10.3.4. Europe Market Size and Forecast, By Product, 2019 - 2032 (US$ Million)
- 10.3.5. Europe Market Size and Forecast, By Application, 2019 - 2032 (US$ Million)
- 10.3.6. Europe Market Size and Forecast, By End User, 2019 - 2032 (US$ Million)
- 10.3.7. Germany
- 10.3.7.1. Overview
- 10.3.7.2. Market Analysis, Forecast, and Y-O-Y Growth Rate, 2019 - 2032, (US$ Million)
- 10.3.7.3. Germany Market Size and Forecast, By Product, 2019 - 2032 (US$ Million)
- 10.3.7.4. Germany Market Size and Forecast, By Application, 2019 - 2032 (US$ Million)
- 10.3.7.5. Germany Market Size and Forecast, By End User, 2019 - 2032 (US$ Million)
- 10.3.8. Italy
- 10.3.8.1. Overview
- 10.3.8.2. Market Analysis, Forecast, and Y-O-Y Growth Rate, 2019 - 2032, (US$ Million)
- 10.3.8.3. Italy Market Size and Forecast, By Product, 2019 - 2032 (US$ Million)
- 10.3.8.4. Italy Market Size and Forecast, By Application, 2019 - 2032 (US$ Million)
- 10.3.8.5. Italy Market Size and Forecast, By End User, 2019 - 2032 (US$ Million)
- 10.3.9. United Kingdom
- 10.3.9.1. Overview
- 10.3.9.2. Market Analysis, Forecast, and Y-O-Y Growth Rate, 2019 - 2032, (US$ Million)
- 10.3.9.3. United Kingdom Market Size and Forecast, By Product, 2019 - 2032 (US$ Million)
- 10.3.9.4. United Kingdom Market Size and Forecast, By Application, 2019 - 2032 (US$ Million)
- 10.3.9.5. United Kingdom Market Size and Forecast, By End User, 2019 - 2032 (US$ Million)
- 10.3.10. France
- 10.3.10.1. Overview
- 10.3.10.2. Market Analysis, Forecast, and Y-O-Y Growth Rate, 2019 - 2032, (US$ Million)
- 10.3.10.3. France Market Size and Forecast, By Product, 2019 - 2032 (US$ Million)
- 10.3.10.4. France Market Size and Forecast, By Application, 2019 - 2032 (US$ Million)
- 10.3.10.5. France Market Size and Forecast, By End User, 2019 - 2032 (US$ Million)
- 10.3.11. Russia
- 10.3.11.1. Market Analysis, Forecast, and Y-O-Y Growth Rate, 2019 - 2032, (US$ Million)
- 10.3.11.2. Russia Market Size and Forecast, By Product, 2019 - 2032 (US$ Million)
- 10.3.11.3. Russia Market Size and Forecast, By Application, 2019 - 2032 (US$ Million)
- 10.3.11.4. Russia Market Size and Forecast, By End User, 2019 - 2032 (US$ Million)
- 10.3.12. Netherlands
- 10.3.12.1. Market Analysis, Forecast, and Y-O-Y Growth Rate, 2019 - 2032, (US$ Million)
- 10.3.12.2. Netherlands Market Size and Forecast, By Product, 2019 - 2032 (US$ Million)
- 10.3.12.3. Netherlands Market Size and Forecast, By Application, 2019 - 2032 (US$ Million)
- 10.3.12.4. Netherlands Market Size and Forecast, By End User, 2019 - 2032 (US$ Million)
- 10.3.13. Sweden
- 10.3.13.1. Market Analysis, Forecast, and Y-O-Y Growth Rate, 2019 - 2032, (US$ Million)
- 10.3.13.2. Sweden Market Size and Forecast, By Product, 2019 - 2032 (US$ Million)
- 10.3.13.3. Sweden Market Size and Forecast, By Application, 2019 - 2032 (US$ Million)
- 10.3.13.4. Sweden Market Size and Forecast, By End User, 2019 - 2032 (US$ Million)
- 10.3.14. Poland
- 10.3.14.1. Market Analysis, Forecast, and Y-O-Y Growth Rate, 2019 - 2032, (US$ Million)
- 10.3.14.2. Poland Market Size and Forecast, By Product, 2019 - 2032 (US$ Million)
- 10.3.14.3. Poland Market Size and Forecast, By Application, 2019 - 2032 (US$ Million)
- 10.3.14.4. Poland Market Size and Forecast, By End User, 2019 - 2032 (US$ Million)
- 10.3.15. Rest of Europe
- 10.3.15.1. Overview
- 10.3.15.2. Market Analysis, Forecast, and Y-O-Y Growth Rate, 2019 - 2032, (US$ Million)
- 10.3.15.3. Rest of the Europe Market Size and Forecast, By Product, 2019 - 2032 (US$ Million)
- 10.3.15.4. Rest of the Europe Market Size and Forecast, By Application, 2019 - 2032 (US$ Million)
- 10.3.15.5. Rest of the Europe Market Size and Forecast, By End User, 2019 - 2032 (US$ Million)
- 10.4. Asia Pacific (APAC)
- 10.4.1. Overview
- 10.4.2. Micro Computed Tomography Key Manufacturers in Asia Pacific
- 10.4.3. Asia Pacific Market Size and Forecast, By Country, 2019 - 2032 (US$ Million)
- 10.4.4. Asia Pacific Market Size and Forecast, By Product, 2019 - 2032 (US$ Million)
- 10.4.5. Asia Pacific Market Size and Forecast, By Application, 2019 - 2032 (US$ Million)
- 10.4.6. Asia Pacific Market Size and Forecast, By End User, 2019 - 2032 (US$ Million)
- 10.4.7. India
- 10.4.7.1. Overview
- 10.4.7.2. Market Analysis, Forecast, and Y-O-Y Growth Rate, 2019 - 2032, (US$ Million)
- 10.4.7.3. India Market Size and Forecast, By Product, 2019 - 2032 (US$ Million)
- 10.4.7.4. India Market Size and Forecast, By Application, 2019 - 2032 (US$ Million)
- 10.4.7.5. India Market Size and Forecast, By End User, 2019 - 2032 (US$ Million)
- 10.4.8. China
- 10.4.8.1. Overview
- 10.4.8.2. Market Analysis, Forecast, and Y-O-Y Growth Rate, 2019 - 2032, (US$ Million)
- 10.4.8.3. China Market Size and Forecast, By Product, 2019 - 2032 (US$ Million)
- 10.4.8.4. China Market Size and Forecast, By Application, 2019 - 2032 (US$ Million)
- 10.4.8.5. China Market Size and Forecast, By End User, 2019 - 2032 (US$ Million)
- 10.4.9. Japan
- 10.4.9.1. Overview
- 10.4.9.2. Market Analysis, Forecast, and Y-O-Y Growth Rate, 2019 - 2032, (US$ Million)
- 10.4.9.3. Japan Market Size and Forecast, By Product, 2019 - 2032 (US$ Million)
- 10.4.9.4. Japan Market Size and Forecast, By Application, 2019 - 2032 (US$ Million)
- 10.4.9.5. Japan Market Size and Forecast, By End User, 2019 - 2032 (US$ Million)
- 10.4.10. South Korea
- 10.4.10.1. Overview
- 10.4.10.2. Market Analysis, Forecast, and Y-O-Y Growth Rate, 2019 - 2032, (US$ Million)
- 10.4.10.3. South Korea Market Size and Forecast, By Product, 2019 - 2032 (US$ Million)
- 10.4.10.4. South Korea Market Size and Forecast, By Application, 2019 - 2032 (US$ Million)
- 10.4.10.5. South Korea Market Size and Forecast, By End User, 2019 - 2032 (US$ Million)
- 10.4.11. Australia
- 10.4.11.1. Overview
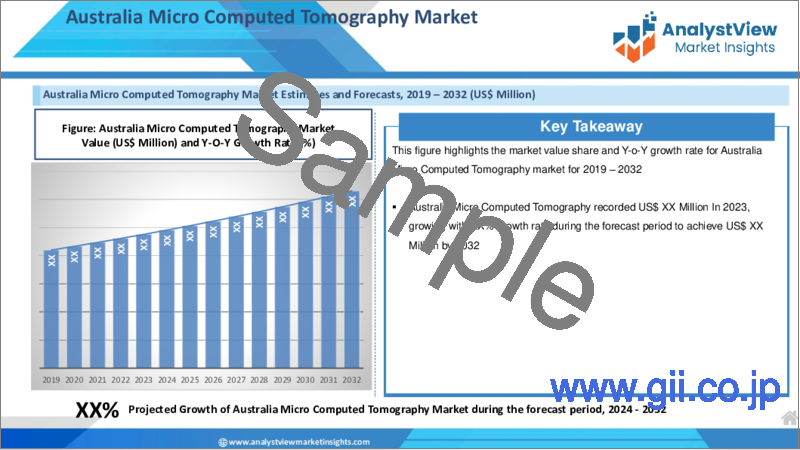
- 10.4.11.2. Market Analysis, Forecast, and Y-O-Y Growth Rate, 2019 - 2032, (US$ Million)
- 10.4.11.3. Australia Market Size and Forecast, By Product, 2019 - 2032 (US$ Million)
- 10.4.11.4. Australia Market Size and Forecast, By Application, 2019 - 2032 (US$ Million)
- 10.4.11.5. Australia Market Size and Forecast, By End User, 2019 - 2032 (US$ Million)
- 10.4.12. Thailand
- 10.4.12.1. Overview
- 10.4.12.2. Market Analysis, Forecast, and Y-O-Y Growth Rate, 2019 - 2032, (US$ Million)
- 10.4.12.3. Thailand Market Size and Forecast, By Product, 2019 - 2032 (US$ Million)
- 10.4.12.4. Thailand Market Size and Forecast, By Application, 2019 - 2032 (US$ Million)
- 10.4.12.5. Thailand Market Size and Forecast, By End User, 2019 - 2032 (US$ Million)
- 10.4.13. Indonesia
- 10.4.13.1. Overview
- 10.4.13.2. Market Analysis, Forecast, and Y-O-Y Growth Rate, 2019 - 2032, (US$ Million)
- 10.4.13.3. Indonesia Market Size and Forecast, By Product, 2019 - 2032 (US$ Million)
- 10.4.13.4. Indonesia Market Size and Forecast, By Application, 2019 - 2032 (US$ Million)
- 10.4.13.5. Indonesia Market Size and Forecast, By End User, 2019 - 2032 (US$ Million)
- 10.4.14. Philippines
- 10.4.14.1. Overview
- 10.4.14.2. Market Analysis, Forecast, and Y-O-Y Growth Rate, 2019 - 2032, (US$ Million)
- 10.4.14.3. Philippines Market Size and Forecast, By Product, 2019 - 2032 (US$ Million)
- 10.4.14.4. Philippines Market Size and Forecast, By Application, 2019 - 2032 (US$ Million)
- 10.4.14.5. Philippines Market Size and Forecast, By End User, 2019 - 2032 (US$ Million)
- 10.4.15. Rest of APAC
- 10.4.15.1. Overview
- 10.4.15.2. Market Analysis, Forecast, and Y-O-Y Growth Rate, 2019 - 2032, (US$ Million)
- 10.4.15.3. Rest of APAC Market Size and Forecast, By Product, 2019 - 2032 (US$ Million)
- 10.4.15.4. Rest of APAC Market Size and Forecast, By Application, 2019 - 2032 (US$ Million)
- 10.4.15.5. Rest of APAC Market Size and Forecast, By End User, 2019 - 2032 (US$ Million)
- 10.5. Latin America
- 10.5.1. Overview
- 10.5.2. Micro Computed Tomography Key Manufacturers in Latin America
- 10.5.3. Latin America Market Size and Forecast, By Country, 2019 - 2032 (US$ Million)
- 10.5.4. Latin America Market Size and Forecast, By Product, 2019 - 2032 (US$ Million)
- 10.5.5. Latin America Market Size and Forecast, By Application, 2019 - 2032 (US$ Million)
- 10.5.6. Latin America Market Size and Forecast, By End User, 2019 - 2032 (US$ Million)
- 10.5.7. Brazil
- 10.5.7.1. Overview
- 10.5.7.2. Market Analysis, Forecast, and Y-O-Y Growth Rate, 2019 - 2032, (US$ Million)
- 10.5.7.3. Brazil Market Size and Forecast, By Product, 2019 - 2032 (US$ Million)
- 10.5.7.4. Brazil Market Size and Forecast, By Application, 2019 - 2032 (US$ Million)
- 10.5.7.5. Brazil Market Size and Forecast, By End User, 2019 - 2032 (US$ Million)
- 10.5.8. Mexico
- 10.5.8.1. Overview
- 10.5.8.2. Market Analysis, Forecast, and Y-O-Y Growth Rate, 2019 - 2032, (US$ Million)
- 10.5.8.3. Mexico Market Size and Forecast, By Product, 2019 - 2032 (US$ Million)
- 10.5.8.4. Mexico Market Size and Forecast, By Application, 2019 - 2032 (US$ Million)
- 10.5.8.5. Mexico Market Size and Forecast, By End User, 2019 - 2032 (US$ Million)
- 10.5.9. Argentina
- 10.5.9.1. Overview
- 10.5.9.2. Market Analysis, Forecast, and Y-O-Y Growth Rate, 2019 - 2032, (US$ Million)
- 10.5.9.3. Argentina Market Size and Forecast, By Product, 2019 - 2032 (US$ Million)
- 10.5.9.4. Argentina Market Size and Forecast, By Application, 2019 - 2032 (US$ Million)
- 10.5.9.5. Argentina Market Size and Forecast, By End User, 2019 - 2032 (US$ Million)
- 10.5.10. Colombia
- 10.5.10.1. Overview
- 10.5.10.2. Market Analysis, Forecast, and Y-O-Y Growth Rate, 2019 - 2032, (US$ Million)
- 10.5.10.3. Colombia Market Size and Forecast, By Product, 2019 - 2032 (US$ Million)
- 10.5.10.4. Colombia Market Size and Forecast, By Application, 2019 - 2032 (US$ Million)
- 10.5.10.5. Colombia Market Size and Forecast, By End User, 2019 - 2032 (US$ Million)
- 10.5.11. Rest of LATAM
- 10.5.11.1. Overview
- 10.5.11.2. Market Analysis, Forecast, and Y-O-Y Growth Rate, 2019 - 2032, (US$ Million)
- 10.5.11.3. Rest of LATAM Market Size and Forecast, By Product, 2019 - 2032 (US$ Million)
- 10.5.11.4. Rest of LATAM Market Size and Forecast, By Application, 2019 - 2032 (US$ Million)
- 10.5.11.5. Rest of LATAM Market Size and Forecast, By End User, 2019 - 2032 (US$ Million)
- 10.6. Middle East and Africa
- 10.6.1. Overview
- 10.6.2. Micro Computed Tomography Key Manufacturers in Middle East and Africa
- 10.6.3. Middle East and Africa Market Size and Forecast, By Country, 2019 - 2032 (US$ Million)
- 10.6.4. Middle East and Africa Market Size and Forecast, By Product, 2019 - 2032 (US$ Million)
- 10.6.5. Middle East and Africa Market Size and Forecast, By Application, 2019 - 2032 (US$ Million)
- 10.6.6. Middle East and Africa Market Size and Forecast, By End User, 2019 - 2032 (US$ Million)
- 10.6.7. Saudi Arabia
- 10.6.7.1. Overview
- 10.6.7.2. Market Analysis, Forecast, and Y-O-Y Growth Rate, 2019 - 2032, (US$ Million)
- 10.6.7.3. Saudi Arabia Market Size and Forecast, By Product, 2019 - 2032 (US$ Million)
- 10.6.7.4. Saudi Arabia Market Size and Forecast, By Application, 2019 - 2032 (US$ Million)
- 10.6.7.5. Saudi Arabia Market Size and Forecast, By End User, 2019 - 2032 (US$ Million)
- 10.6.8. United Arab Emirates
- 10.6.8.1. Overview
- 10.6.8.2. Market Analysis, Forecast, and Y-O-Y Growth Rate, 2019 - 2032, (US$ Million)
- 10.6.8.3. United Arab Emirates Market Size and Forecast, By Product, 2019 - 2032 (US$ Million)
- 10.6.8.4. United Arab Emirates Market Size and Forecast, By Application, 2019 - 2032 (US$ Million)
- 10.6.8.5. United Arab Emirates Market Size and Forecast, By End User, 2019 - 2032 (US$ Million)
- 10.6.9. Israel
- 10.6.9.1. Overview
- 10.6.9.2. Market Analysis, Forecast, and Y-O-Y Growth Rate, 2019 - 2032, (US$ Million)
- 10.6.9.3. Israel Market Size and Forecast, By Product, 2019 - 2032 (US$ Million)
- 10.6.9.4. Israel Market Size and Forecast, By Application, 2019 - 2032 (US$ Million)
- 10.6.9.5. Israel Market Size and Forecast, By End User, 2019 - 2032 (US$ Million)
- 10.6.10. Turkey
- 10.6.10.1. Overview
- 10.6.10.2. Market Analysis, Forecast, and Y-O-Y Growth Rate, 2019 - 2032, (US$ Million)
- 10.6.10.3. Turkey Market Size and Forecast, By Product, 2019 - 2032 (US$ Million)
- 10.6.10.4. Turkey Market Size and Forecast, By Application, 2019 - 2032 (US$ Million)
- 10.6.10.5. Turkey Market Size and Forecast, By End User, 2019 - 2032 (US$ Million)
- 10.6.11. Algeria
- 10.6.11.1. Overview
- 10.6.11.2. Market Analysis, Forecast, and Y-O-Y Growth Rate, 2019 - 2032, (US$ Million)
- 10.6.11.3. Algeria Market Size and Forecast, By Product, 2019 - 2032 (US$ Million)
- 10.6.11.4. Algeria Market Size and Forecast, By Application, 2019 - 2032 (US$ Million)
- 10.6.11.5. Algeria Market Size and Forecast, By End User, 2019 - 2032 (US$ Million)
- 10.6.12. Egypt
- 10.6.12.1. Overview
- 10.6.12.2. Market Analysis, Forecast, and Y-O-Y Growth Rate, 2019 - 2032, (US$ Million)
- 10.6.12.3. Egypt Market Size and Forecast, By Product, 2019 - 2032 (US$ Million)
- 10.6.12.4. Egypt Market Size and Forecast, By Application, 2019 - 2032 (US$ Million)
- 10.6.12.5. Egypt Market Size and Forecast, By End User, 2019 - 2032 (US$ Million)
- 10.6.13. Rest of MEA
- 10.6.13.1. Overview
- 10.6.13.2. Market Analysis, Forecast, and Y-O-Y Growth Rate, 2019 - 2032, (US$ Million)
- 10.6.13.3. Rest of MEA Market Size and Forecast, By Product, 2019 - 2032 (US$ Million)
- 10.6.13.4. Rest of MEA Market Size and Forecast, By Application, 2019 - 2032 (US$ Million)
- 10.6.13.5. Rest of MEA Market Size and Forecast, By End User, 2019 - 2032 (US$ Million)
11. Key Vendor Analysis- Micro Computed Tomography Industry
- 11.1. Competitive Dashboard
- 11.2. Company Profiles
- 11.2.1. Bruker Corporation
- 11.2.2. Thermo Fisher Scientific
- 11.2.3. ZEISS Group
- 11.2.4. Rigaku Corporation
- 11.2.5. Nikon Metrology
- 11.2.6. SCANTECH
- 11.2.7. YXLON International
- 11.2.8. North Star Imaging (NSI)
- 11.2.9. Micro Photonics
- 11.2.10. Perkin Elmer Inc.
- 11.2.11. SkyScan
- 11.2.12. Oxford Instruments
- 11.2.13. GE Inspection Technologies
- 11.2.14. TESCAN
- 11.2.15. Mediso Medical Imaging Systems
- 11.2.16. Phoenix X-ray
- 11.2.17. Others
12. 360 Degree Analyst View
13. Appendix
- 13.1. Research Methodology
- 13.2. References
- 13.3. Abbreviations
- 13.4. Disclaimer
- 13.5. Contact Us

