|
|
市場調査レポート
商品コード
1515398
データセンター電力および冷却ソリューション市場:製品タイプ別、エンドユーザー別、国別、地域別 - 産業分析、市場規模、市場シェア、2024年~2032年の予測Data Center Power and Cooling Solutions Market, By Product Type, By End User, By Country, and By Region - Industry Analysis, Market Size, Market Share & Forecast from 2024-2032 |
||||||
|
|||||||
カスタマイズ可能
|
|||||||

| データセンター電力および冷却ソリューション市場:製品タイプ別、エンドユーザー別、国別、地域別 - 産業分析、市場規模、市場シェア、2024年~2032年の予測 |
|
出版日: 2024年06月24日
発行: AnalystView Market Insights
ページ情報: 英文 350 Pages
納期: 2~3営業日
|

全表示
- 概要
- 図表
- 目次
レポートハイライト
データセンター電力および冷却ソリューション市場は2023年に275億6,412万米ドルとなり、2024年から2032年にかけてCAGR 8.5%で拡大
データセンター電力および冷却ソリューション市場-市場力学
データセンター需要の増加が市場需要を促進
データセンター電力および冷却ソリューション市場は、いくつかの主要な要因によって牽引されています。クラウドコンピューティングとビッグデータの成長に後押しされたデータセンター需要の増加により、中断のない運用を確保するための効率的で信頼性の高い電源および冷却ソリューションが必要とされています。デジタル化とモノのインターネット(IoT)の増加は、堅牢なインフラの必要性をさらに高めています。さらに、エネルギー効率に関する政府の厳しい規制とエネルギーコストの上昇が、企業に高度な冷却技術の採用を促しています。再生可能エネルギーと持続可能な実践における革新も市場力学に影響を与え、環境に優しいソリューションの採用を促進しています。
市場-主な洞察
当社リサーチアナリストの分析によると、世界市場は予測期間(2024-2032年)に約8.5%のCAGRで毎年成長すると推定されます。
製品タイプ別では、無停電電源装置が2023年に最大の市場シェアを示すと予測されています。
エンドユーザー別では、2023年には産業用電源が主要タイプでした。
地域別では、北米が2023年に収益でリードしました。
データセンター電力および冷却ソリューション市場-セグメンテーション分析:
データセンター電力および冷却ソリューションの世界市場は、重要電源タイプ、冷却タイプ、エンドユーザー、地域によって区分されます。重要電源タイプでは、市場は発電機、無停電電源装置(UPS)、その他の関連技術に分けられます。発電機は、停電時にバックアップ電力を供給し、重要インフラの継続的な運用を確保するために不可欠です。一方、UPSシステムは、停電時に即座に電力サポートを提供し、繊細な機器を損傷から守るために極めて重要です。その他」のカテゴリーには、重要な電力ニーズをサポートする様々な補助技術やシステムが含まれます。
冷却タイプに関しては、市場セグメンテーションには、空調、チリングユニット、冷却塔、液体冷却システム、その他の特殊冷却ソリューションが含まれます。空調は、さまざまな機器や設備の最適な稼働を維持するために不可欠な、制御された環境を提供するための定番であり続けています。チリングユニットは、精密な温度制御を必要とする工業プロセスには欠かせません。冷却塔は、熱を効率的に放散させるために、一般的に大規模な産業用途で使用されます。液冷システムは、高密度の熱負荷を処理するのに有効なため、特にデータセンターで脚光を浴びています。
エンドユーザー分野には、産業、商業、輸送、データセンター、ヘルスケア、製造、通信など、幅広い産業が含まれます。特にデータセンターは、継続的なアップタイムと効率的な熱管理に対する需要が高いため、データセンター電力および冷却ソリューションの重要な消費者となっています。
データセンター電力および冷却ソリューション市場-地域別洞察
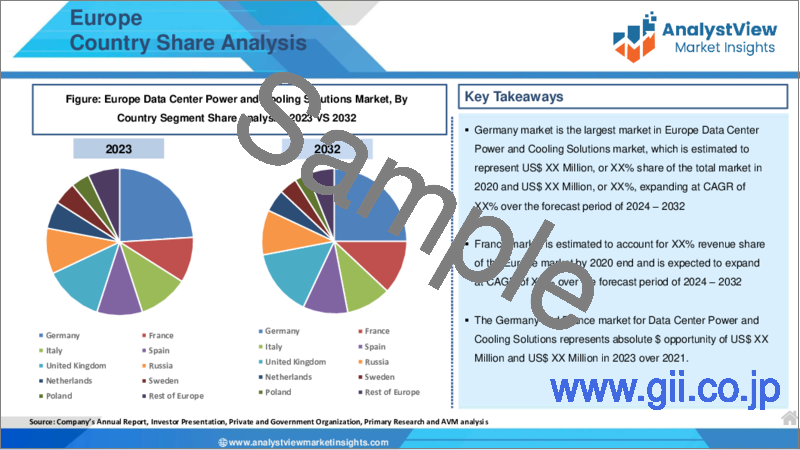
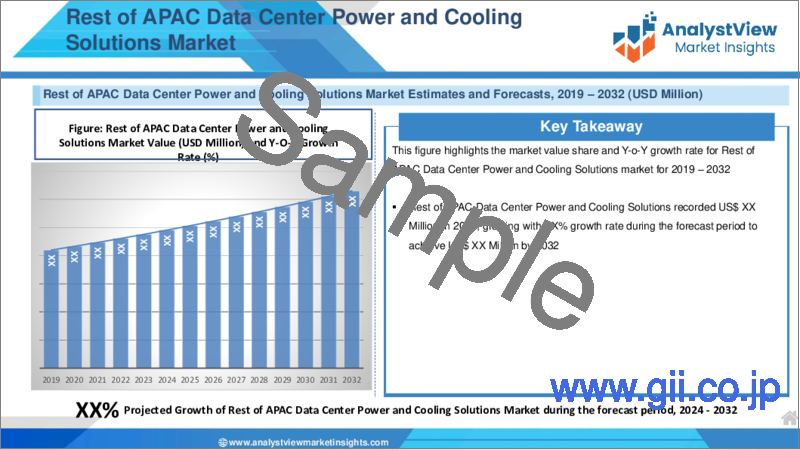
地域別では、産業化、技術進歩、インフラ整備などの要因に影響され、需要や成長率にばらつきが見られます。北米と欧州は、先進的な産業基盤と厳しい規制基準により、伝統的に強力な市場となっています。一方、アジア太平洋地域は、産業部門の拡大とインフラへの投資の増加により、急成長を遂げています。全体として、世界のデータセンター向け電力・冷却ソリューション市場は、さまざまな産業で運用の信頼性と効率性を確保するために不可欠です。重要な電源タイプ、冷却タイプ、エンドユーザー、地域別に市場をセグメンテーションすることで、その多面的な性質と、最適なパフォーマンスと運用の継続性を維持するための多様なニーズが浮き彫りになります。
データセンター電力および冷却ソリューション市場-競合情勢:
データセンター電力および冷却ソリューション市場は、効率的なエネルギー管理と冷却システムに対する需要の高まりに対応するため、革新的で信頼性の高いソリューションの提供を目指す主要企業間の激しい競争が特徴です。シュナイダーエレクトリック、イートン、ABB、Vertiv、シーメンスなどの大手企業が、技術的進歩と広範な販売網を活用して市場を独占しています。これらの企業は、提供する製品を強化し競争力を維持するため、研究開発に継続的に投資しています。さらに、市場ではM&Aによる統合が進み、各社の能力と地理的プレゼンスが拡大しています。持続可能性が優先課題となるなか、エネルギー効率が高く環境に優しいソリューションへの注目が、競合をさらに激化させています。
目次
第1章 データセンター電力および冷却ソリューション市場概要
- 調査範囲
- 市場推定年
第2章 エグゼクティブサマリー
- 市場内訳
- 競合考察
第3章 データセンター電力および冷却ソリューションの主要市場動向
- 市場促進要因
- 市場抑制要因
- 市場機会
- 市場の将来動向
第4章 データセンター電力および冷却ソリューション業界調査
- PEST分析
- ポーターのファイブフォース分析
- 成長見通しマッピング
- 規制枠組み分析
第5章 データセンター電力および冷却ソリューション市場: COVID-19の影響分析
- COVID-19以前の影響分析
- COVID-19後の影響分析
第6章 データセンター電力および冷却ソリューション市場情勢
- データセンター電力および冷却ソリューション市場シェア分析、2023年
- 主要メーカー別内訳データ
- 既存企業の分析
- 新興企業の分析
第7章 データセンター電力および冷却ソリューション市場:製品タイプ別
- 概要
- セグメントシェア分析
- クリティカルパワータイプ
- 発電機
- 無停電電源装置
- その他
- クリティカル冷却タイプ
- 空調
- 冷却塔
- チラー
- 液体冷却システム
- その他
第8章 データセンター電力および冷却ソリューション市場:エンドユーザー別
- 概要
- セグメントシェア分析
- 産業
- 商業
- 輸送機関
- ITおよび通信
- その他
第9章 データセンター電力および冷却ソリューション市場:地域別
- イントロダクション
- 北米
- 概要
- 北米の主要メーカー
- 米国
- カナダ
- 欧州
- 概要
- 欧州の主要メーカー
- ドイツ
- イタリア
- 英国
- フランス
- ロシア
- オランダ
- スウェーデン
- ポーランド
- その他
- アジア太平洋(APAC)
- 概要
- アジア太平洋地域の主要メーカー
- インド
- 中国
- 日本
- 韓国
- オーストラリア
- タイ
- インドネシア
- フィリピン
- その他
- ラテンアメリカ
- 概要
- ラテンアメリカの主要メーカー
- ブラジル
- メキシコ
- アルゼンチン
- コロンビア
- その他
- 中東およびアフリカ
- 概要
- 中東・アフリカの主要メーカー
- サウジアラビア
- アラブ首長国連邦
- イスラエル
- トルコ
- アルジェリア
- エジプト
- その他
第10章 主要ベンダー分析:データセンター電力および冷却ソリューション業界
- 競合ダッシュボード
- 企業プロファイル
- Schneider Electric
- Eaton
- ABB
- Vertiv
- Siemens
- nVent
- STULZ
- Cloud &Heat
- General Electric
- Critical Power
第11章 アナリストの全方位展望
List of Tables
- TABLE List of data sources
- TABLE Market drivers; Impact Analysis
- TABLE Market restraints; Impact Analysis
- TABLE Data Center Power and Cooling Solutions Market: Product Type Snapshot (2023)
- TABLE Segment Dashboard; Definition and Scope, by Product Type
- TABLE Global Data Center Power and Cooling Solutions Market, by Product Type 2019-2032 (USD Million)
- TABLE Data Center Power and Cooling Solutions Market: End-User Snapshot (2023)
- TABLE Segment Dashboard; Definition and Scope, by End-User
- TABLE Global Data Center Power and Cooling Solutions Market, by End-User 2019-2032 (USD Million)
- TABLE Data Center Power and Cooling Solutions Market: Regional snapshot (2023)
- TABLE Segment Dashboard; Definition and Scope, by Region
- TABLE Global Data Center Power and Cooling Solutions Market, by Region 2019-2032 (USD Million)
- TABLE North America Data Center Power and Cooling Solutions Market, by Country, 2019-2032 (USD Million)
- TABLE North America Data Center Power and Cooling Solutions Market
ket, by Product Type, 2019-2032 (USD Million)
- TABLE North America Data Center Power and Cooling Solutions Market, by End-User, 2019-2032 (USD Million)
- TABLE Europe Data Center Power and Cooling Solutions Market, by Country, 2019-2032 (USD Million)
- TABLE Europe Data Center Power and Cooling Solutions Market, by Product Type, 2019-2032 (USD Million)
- TABLE Europe Data Center Power and Cooling Solutions Market, by End-User, 2019-2032 (USD Million)
- TABLE Asia Pacific Data Center Power and Cooling Solutions Market, by Country, 2019-2032 (USD Million)
- TABLE Asia Pacific Data Center Power and Cooling Solutions Market, by Product Type, 2019-2032 (USD Million)
- TABLE Asia Pacific Data Center Power and Cooling Solutions Market, by End-User, 2019-2032 (USD Million)
- TABLE Latin America Data Center Power and Cooling Solutions Market, by Country, 2019-2032 (USD Million)
- TABLE Latin America Data Center Power and Cooling Solutions Market, by Product Type, 2019-2032 (USD Million)
- TABLE Latin America Data Center Power and Cooling Solutions Market, by End-User, 2019-2032 (USD Million)
- TABLE Middle East and Africa Data Center Power and Cooling Solutions Market, by Country, 2019-2032 (USD Million)
- TABLE Middle East and Africa Data Center Power and Cooling Solutions Market, by Product Type, 2019-2032 (USD Million)
- TABLE Middle East and Africa Data Center Power and Cooling Solutions Market, by End-User, 2019-2032 (USD Million)
List of Figures
- FIGURE Data Center Power and Cooling Solutions Market Segmentation
- FIGURE Market research methodology
- FIGURE Value chain analysis
- FIGURE Porter's Five Forces Analysis
- FIGURE Market Attractiveness Analysis
- FIGURE COVID-19 Impact Analysis
- FIGURE Pre & Post COVID-19 Impact Comparision Study
- FIGURE Competitive Landscape; Key company market share analysis, 2023
- FIGURE Product Type segment market share analysis, 2023 & 2032
- FIGURE Product Type segment market size forecast and trend analysis, 2019 to 2032 (USD Million)
- FIGURE End-User segment market share analysis, 2023 & 2032
- FIGURE End-User segment market size forecast and trend analysis, 2019 to 2032 (USD Million)
- FIGURE Regional segment market share analysis, 2023 & 2032
- FIGURE Regional segment market size forecast and trend analysis, 2019 to 2032 (USD Million)
- FIGURE North America Data Center Power and Cooling Solutions Market share and leading players, 2023
- FIGURE Europe Data Center Power and Cooling Solutions Market share and leading players, 2023
- FIGURE Asia Pacific Data Center Power and Cooling Solutions Market share and leading players, 2023
- FIGURE Latin America Data Center Power and Cooling Solutions Market share and leading players, 2023
- FIGURE Middle East and Africa Data Center Power and Cooling Solutions Market share and leading players, 2023
- FIGURE North America market share analysis by country, 2023
- FIGURE U.S. Data Center Power and Cooling Solutions Market size, forecast and trend analysis, 2019 to 2032 (USD Million)
- FIGURE Canada Data Center Power and Cooling Solutions Market size, forecast and trend analysis, 2019 to 2032 (USD Million)
- FIGURE Europe Data Center Power and Cooling Solutions Market share analysis by country, 2023
- FIGURE Germany Data Center Power and Cooling Solutions Market size, forecast and trend analysis, 2019 to 2032 (USD Million)
- FIGURE Spain Data Center Power and Cooling Solutions Market size, forecast and trend analysis, 2019 to 2032 (USD Million)
- FIGURE Italy Data Center Power and Cooling Solutions Market size, forecast and trend analysis, 2019 to 2032 (USD Million)
- FIGURE France Data Center Power and Cooling Solutions Market size, forecast and trend analysis, 2019 to 2032 (USD Million)
- FIGURE UK Data Center Power and Cooling Solutions Market size, forecast and trend analysis, 2019 to 2032 (USD Million)
- FIGURE Russia Data Center Power and Cooling Solutions Market size, forecast and trend analysis, 2019 to 2032 (USD Million)
- FIGURE Netherlands Data Center Power and Cooling Solutions Market size, forecast and trend analysis, 2019 to 2032 (USD Million)
- FIGURE Sweden Data Center Power and Cooling Solutions Market size, forecast and trend analysis, 2019 to 2032 (USD Million)
- FIGURE Poland Data Center Power and Cooling Solutions Market size, forecast and trend analysis, 2019 to 2032 (USD Million)
- FIGURE Rest of the Europe Data Center Power and Cooling Solutions Market size, forecast and trend analysis, 2019 to 2032 (USD Million)
- FIGURE Asia Pacific Data Center Power and Cooling Solutions Market share analysis by country, 2023
- FIGURE India Data Center Power and Cooling Solutions Market size, forecast and trend analysis, 2019 to 2032 (USD Million)
- FIGURE China Data Center Power and Cooling Solutions Market size, forecast and trend analysis, 2019 to 2032 (USD Million)
- FIGURE Japan Data Center Power and Cooling Solutions Market size, forecast and trend analysis, 2019 to 2032 (USD Million)
- FIGURE South Korea Data Center Power and Cooling Solutions Market size, forecast and trend analysis, 2019 to 2032 (USD Million)
- FIGURE Australia Data Center Power and Cooling Solutions Market size, forecast and trend analysis, 2019 to 2032 (USD Million)
- FIGURE Thailand Data Center Power and Cooling Solutions Market size, forecast and trend analysis, 2019 to 2032 (USD Million)
- FIGURE Indonesia Data Center Power and Cooling Solutions Market size, forecast and trend analysis, 2019 to 2032 (USD Million)
- FIGURE Philippines Data Center Power and Cooling Solutions Market size, forecast and trend analysis, 2019 to 2032 (USD Million)
- FIGURE Rest of APAC Data Center Power and Cooling Solutions Market size, forecast and trend analysis, 2019 to 2032 (USD Million)
- FIGURE Latin America Data Center Power and Cooling Solutions Market size, forecast and trend analysis, 2019 to 2032 (USD Million)
- FIGURE Latin America Data Center Power and Cooling Solutions Market share analysis by country, 2023
- FIGURE Brazil Data Center Power and Cooling Solutions Market size, forecast and trend analysis, 2019 to 2032 (USD Million)
- FIGURE Mexico Data Center Power and Cooling Solutions Market size, forecast and trend analysis, 2019 to 2032 (USD Million)
- FIGURE Argentina Data Center Power and Cooling Solutions Market size, forecast and trend analysis, 2019 to 2032 (USD Million)
- FIGURE Colombia Data Center Power and Cooling Solutions Market size, forecast and trend analysis, 2019 to 2032 (USD Million)
- FIGURE Rest of LATAM Data Center Power and Cooling Solutions Market size, forecast and trend analysis, 2019 to 2032 (USD Million)
- FIGURE Middle East and Africa Data Center Power and Cooling Solutions Market size, forecast and trend analysis, 2019 to 2032 (USD Million)
- FIGURE Middle East and Africa Data Center Power and Cooling Solutions Market share analysis by country, 2023
- FIGURE Saudi Arabia Data Center Power and Cooling Solutions Market size, forecast and trend analysis, 2019 to 2032 (USD Million)
- FIGURE United Arab Emirates Data Center Power and Cooling Solutions Market size, forecast and trend analysis, 2019 to 2032 (USD Million)
- FIGURE Israel Data Center Power and Cooling Solutions Market size, forecast and trend analysis, 2019 to 2032 (USD Million)
- FIGURE Turkey Data Center Power and Cooling Solutions Market size, forecast and trend analysis, 2019 to 2032 (USD Million)
- FIGURE Algeria Data Center Power and Cooling Solutions Market size, forecast and trend analysis, 2019 to 2032 (USD Million)
- FIGURE Egypt Data Center Power and Cooling Solutions Market size, forecast and trend analysis, 2019 to 2032 (USD Million)
- FIGURE Rest of MEA Data Center Power and Cooling Solutions Market size, forecast and trend analysis, 2019 to 2032 (USD Million)
REPORT HIGHLIGHT
Data Center Power and Cooling Solutions Market was valued at USD 27,564.12 million in 2023, expanding at a CAGR of 8.5% from 2024 to 2032.
The Data Center Power and Cooling Solutions market is a vital segment of the infrastructure industry, focusing on providing reliable power and thermal management solutions to ensure the continuous operation of critical systems. This market encompasses a range of products and services, including uninterruptible power supplies (UPS), generators, cooling systems, and power distribution units (PDUs). These solutions are essential for data centers, hospitals, telecommunication facilities, and other environments where downtime can result in significant financial and operational consequences. The market is driven by the increasing demand for data processing and storage, the expansion of cloud computing, and the need for robust disaster recovery solutions. Advances in technology, such as energy-efficient cooling systems and smart grid integration, are also contributing to market growth. As businesses and institutions continue to rely heavily on digital infrastructure, the Data Center Power and Cooling Solutions market is expected to see sustained growth, with a focus on innovation and reliability.
Data Center Power and Cooling Solutions Market- Market Dynamics
O Increasing demand for data centers to propel market demand
The Data Center Power and Cooling Solutions market is driven by several key factors. Increasing demand for data centers, fueled by the growth of cloud computing and big data, necessitates efficient and reliable power and cooling solutions to ensure uninterrupted operations. The rise in digitalization and the Internet of Things (IoT) further boosts the need for robust infrastructure. Additionally, stringent government regulations on energy efficiency and the rising cost of energy compel businesses to adopt advanced cooling technologies. Innovations in renewable energy and sustainable practices also influence market dynamics, promoting the adoption of eco-friendly solutions.
Market- Key Insights
v As per the analysis shared by our research analyst, the global market is estimated to grow annually at a CAGR of around 8.5% over the forecast period (2024-2032)
v Based on product type segmentation, the uninterruptible power supply was predicted to show maximum market share in the year 2023
v Based on end-user segmentation, the industrial was the leading type in 2023
v Based on region, North America was the leading revenue generator in 2023
Data Center Power and Cooling Solutions Market- Segmentation Analysis:
The Global Data Center Power and Cooling Solutions Market is segmented based on critical power type, cooling type, end user, and region. In terms of critical power type, the market is divided into generators, uninterruptible power supplies (UPS), and other related technologies. Generators are essential for providing backup power during outages, ensuring continuous operations for critical infrastructure. UPS systems, on the other hand, are crucial for delivering immediate power support during power disturbances and safeguarding sensitive equipment from damage. The 'Others' category encompasses various ancillary technologies and systems that support critical power needs.
Regarding cooling type, the market segmentation includes air conditioning, chilling units, cooling towers, liquid cooling systems, and other specialized cooling solutions. Air conditioning remains a staple in providing a controlled environment, essential for maintaining the optimal operation of various equipment and facilities. Chilling units are vital for industrial processes requiring precise temperature control. Cooling towers are typically used in large-scale industrial applications to dissipate heat efficiently. Liquid cooling systems are gaining prominence, particularly in data centers, due to their effectiveness in handling high-density heat loads.
The end user segment encompasses a wide range of industries, including industrial, commercial, transportation, data centers, healthcare, manufacturing, telecommunications, and more. Data centers, in particular, are significant consumers of both Data Center Power and Cooling Solutions solutions due to the high demand for continuous uptime and efficient thermal management.
Data Center Power and Cooling Solutions Market- Geographical Insights
Regionally, the market exhibits variations in demand and growth rates, influenced by factors such as industrialization, technological advancements, and infrastructural development. North America and Europe are traditionally strong markets due to their advanced industrial base and stringent regulatory standards. Meanwhile, the Asia-Pacific region is witnessing rapid growth driven by expanding industrial sectors and increasing investments in infrastructure. Overall, the Global Data Center Power and Cooling Solutions Market is essential for ensuring the reliability and efficiency of operations across various industries. The market's segmentation by critical power type, cooling type, end user, and region highlights its multifaceted nature and the diverse needs it caters to in maintaining optimal performance and operational continuity.
Data Center Power and Cooling Solutions Market- Competitive Landscape:
The Data Center Power and Cooling Solutions market is characterized by intense competition among key players aiming to offer innovative and reliable solutions to meet the growing demand for efficient energy management and cooling systems. Major companies such as Schneider Electric, Eaton, ABB, Vertiv, and Siemens dominate the market, leveraging their technological advancements and extensive distribution networks. These companies are continually investing in research and development to enhance their product offerings and maintain a competitive edge. Additionally, the market is witnessing increased consolidation through mergers and acquisitions, enabling firms to expand their capabilities and geographic presence. As sustainability becomes a priority, the focus on energy-efficient and eco-friendly solutions is further intensifying the competition.
Recent Developments:
v In February 2019, nVent announced the launch of two smart precision liquid cooling platforms designed to handle high heat loads and meet the critical cooling requirements of data center computing, server, and storage racks. These platforms can deliver precise cooling performance of up to 55KW when connected to a chilled water inlet temperature of 14°C.
v In September 2018, STULZ and Cloud & Heat revealed plans for a collaboration on their first joint products, with Cloud & Heat introducing a new waste electricity concept. Through this international partnership, STULZ aims to expand its services and sales in the cloud and heating markets.
SCOPE OF THE REPORT
The scope of this report covers the market by its major segments, which include as follows:
GLOBAL DATA CENTER POWER AND COOLING SOLUTIONS MARKET KEY PLAYERS- DETAILED COMPETITIVE INSIGHTS
O Schneider Electric
O Eaton
O ABB
O Vertiv
O Siemens
O nVent
O STULZ
O Cloud & Heat
O General Electric
O Critical Power
GLOBAL DATA CENTER POWER AND COOLING SOLUTIONS MARKET, BY PRODUCT TYPE- MARKET ANALYSIS, 2019 - 2032
- O Critical Power Type
- Generators
- Uninterruptible Power Supply
- Others
- O Critical Cooling Type
- Air Conditioning
- Cooling Tower
- Chiller
- Liquid Cooling System
- Others
GLOBAL DATA CENTER POWER AND COOLING SOLUTIONS MARKET, BY END USER- MARKET ANALYSIS, 2019 - 2032
- O Industrial
- O Commercial,
- O Transportation,
- O IT & Telecommunications
- O Others
GLOBAL DATA CENTER POWER AND COOLING SOLUTIONS MARKET, BY REGION- MARKET ANALYSIS, 2019 - 2032
- O North America
- The U.S.
- Canada
- O Europe
- Germany
- France
- Italy
- Spain
- United Kingdom
- Russia
- Netherlands
- Sweden
- Poland
- Rest of Europe
- O Asia Pacific
- India
- China
- South Korea
- Japan
- Australia
- Thailand
- Indonesia
- Philippines
- Rest of APAC
- O Latin America
- Brazil
- Mexico
- Argentina
- Colombia
- Rest of LATAM
- O The Middle East and Africa
- Saudi Arabia
- United Arab Emirates
- Israel
- Turkey
- Algeria
- Egypt
- Rest of MEA
Table of Contents
1. Data Center Power and Cooling Solutions Market Overview
- 1.1. Study Scope
- 1.2. Market Estimation Years
2. Executive Summary
- 2.1. Market Snippet
- 2.1.1. Data Center Power and Cooling Solutions Market Snippet by Product Type
- 2.1.2. Data Center Power and Cooling Solutions Market Snippet by End-User
- 2.1.3. Data Center Power and Cooling Solutions Market Snippet by Country
- 2.1.4. Data Center Power and Cooling Solutions Market Snippet by Region
- 2.2. Competitive Insights
3. Data Center Power and Cooling Solutions Key Market Trends
- 3.1. Data Center Power and Cooling Solutions Market Drivers
- 3.1.1. Impact Analysis of Market Drivers
- 3.2. Data Center Power and Cooling Solutions Market Restraints
- 3.2.1. Impact Analysis of Market Restraints
- 3.3. Data Center Power and Cooling Solutions Market Opportunities
- 3.4. Data Center Power and Cooling Solutions Market Future Trends
4. Data Center Power and Cooling Solutions Industry Study
- 4.1. PEST Analysis
- 4.2. Porter's Five Forces Analysis
- 4.3. Growth Prospect Mapping
- 4.4. Regulatory Framework Analysis
5. Data Center Power and Cooling Solutions Market: COVID-19 Impact Analysis
- 5.1. Pre-COVID-19 Impact Analysis
- 5.2. Post-COVID-19 Impact Analysis
- 5.2.1. Top Performing Segments
- 5.2.2. Marginal Growth Segments
- 5.2.3. Top Looser Segments
- 5.2.4. Marginal Loss Segments
6. Data Center Power and Cooling Solutions Market Landscape
- 6.1. Data Center Power and Cooling Solutions Market Share Analysis, 2023
- 6.2. Breakdown Data, by Key Manufacturer
- 6.2.1. Established Players' Analysis
- 6.2.2. Emerging Players' Analysis
7. Data Center Power and Cooling Solutions Market - By Product Type
- 7.1. Overview
- 7.1.1. Segment Share Analysis, By Product Type, 2023 & 2032 (%)
- 7.1.2. Critical Power Type
- 7.1.2.1. Generators
- 7.1.2.2. Uninterruptible Power Supply
- 7.1.2.3. Others
- 7.1.3. Critical Cooling Type
- 7.1.3.1. Air Conditioning
- 7.1.3.2. Cooling Tower
- 7.1.3.3. Chiller
- 7.1.3.4. Liquid Cooling System
- 7.1.3.5. Others
8. Data Center Power and Cooling Solutions Market - By End-User
- 8.1. Overview
- 8.1.1. Segment Share Analysis, By End-User, 2023 & 2032 (%)
- 8.1.2. Industrial
- 8.1.3. Commercial
- 8.1.4. Transportation
- 8.1.5. IT & Telecommunications
- 8.1.6. Others
9. Data Center Power and Cooling Solutions Market- By Geography
- 9.1. Introduction
- 9.1.1. Segment Share Analysis, By Geography, 2023 & 2032 (%)
- 9.2. North America
- 9.2.1. Overview
- 9.2.2. Data Center Power and Cooling Solutions Key Manufacturers in North America
- 9.2.3. North America Market Size and Forecast, By Country, 2019 - 2032 (US$ Million)
- 9.2.4. North America Market Size and Forecast, By Product Type, 2019 - 2032 (US$ Million)
- 9.2.5. North America Market Size and Forecast, By End-User, 2019 - 2032 (US$ Million)
- 9.2.6. U.S.
- 9.2.6.1. Overview
- 9.2.6.2. Market Analysis, Forecast, and Y-O-Y Growth Rate, 2019 - 2032, (US$ Million)
- 9.2.6.3. U.S. Market Size and Forecast, By Product Type, 2019 - 2032 (US$ Million)
- 9.2.6.4. U.S. Market Size and Forecast, By End-User, 2019 - 2032 (US$ Million)
- 9.2.7. Canada
- 9.2.7.1. Overview
- 9.2.7.2. Market Analysis, Forecast, and Y-O-Y Growth Rate, 2019 - 2032, (US$ Million)
- 9.2.7.3. Canada Market Size and Forecast, By Product Type, 2019 - 2032 (US$ Million)
- 9.2.7.4. Canada Market Size and Forecast, By End-User, 2019 - 2032 (US$ Million)
- 9.3. Europe
- 9.3.1. Overview
- 9.3.2. Data Center Power and Cooling Solutions Key Manufacturers in Europe
- 9.3.3. Europe Market Size and Forecast, By Country, 2019 - 2032 (US$ Million)
- 9.3.4. Europe Market Size and Forecast, By Product Type, 2019 - 2032 (US$ Million)
- 9.3.5. Europe Market Size and Forecast, By End-User, 2019 - 2032 (US$ Million)
- 9.3.6. Germany
- 9.3.6.1. Overview
- 9.3.6.2. Market Analysis, Forecast, and Y-O-Y Growth Rate, 2019 - 2032, (US$ Million)
- 9.3.6.3. Germany Market Size and Forecast, By Product Type, 2019 - 2032 (US$ Million)
- 9.3.6.4. Germany Market Size and Forecast, By End-User, 2019 - 2032 (US$ Million)
- 9.3.7. Italy
- 9.3.7.1. Overview
- 9.3.7.2. Market Analysis, Forecast, and Y-O-Y Growth Rate, 2019 - 2032, (US$ Million)
- 9.3.7.3. Italy Market Size and Forecast, By Product Type, 2019 - 2032 (US$ Million)
- 9.3.7.4. Italy Market Size and Forecast, By End-User, 2019 - 2032 (US$ Million)
- 9.3.8. United Kingdom
- 9.3.8.1. Overview
- 9.3.8.2. Market Analysis, Forecast, and Y-O-Y Growth Rate, 2019 - 2032, (US$ Million)
- 9.3.8.3. United Kingdom Market Size and Forecast, By Product Type, 2019 - 2032 (US$ Million)
- 9.3.8.4. United Kingdom Market Size and Forecast, By End-User, 2019 - 2032 (US$ Million)
- 9.3.9. France
- 9.3.9.1. Overview
- 9.3.9.2. Market Analysis, Forecast, and Y-O-Y Growth Rate, 2019 - 2032, (US$ Million)
- 9.3.9.3. France Market Size and Forecast, By Product Type, 2019 - 2032 (US$ Million)
- 9.3.9.4. France Market Size and Forecast, By End-User, 2019 - 2032 (US$ Million)
- 9.3.10. Russia
- 9.3.10.1. Market Analysis, Forecast, and Y-O-Y Growth Rate, 2019 - 2032, (US$ Million)
- 9.3.10.2. Russia Market Size and Forecast, By Product Type, 2019 - 2032 (US$ Million)
- 9.3.10.3. Russia Market Size and Forecast, By End-User, 2019 - 2032 (US$ Million)
- 9.3.11. Netherlands
- 9.3.11.1. Market Analysis, Forecast, and Y-O-Y Growth Rate, 2019 - 2032, (US$ Million)
- 9.3.11.2. Netherlands Market Size and Forecast, By Product Type, 2019 - 2032 (US$ Million)
- 9.3.11.3. Netherlands Market Size and Forecast, By End-User, 2019 - 2032 (US$ Million)
- 9.3.12. Sweden
- 9.3.12.1. Market Analysis, Forecast, and Y-O-Y Growth Rate, 2019 - 2032, (US$ Million)
- 9.3.12.2. Sweden Market Size and Forecast, By Product Type, 2019 - 2032 (US$ Million)
- 9.3.12.3. Sweden Market Size and Forecast, By End-User, 2019 - 2032 (US$ Million)
- 9.3.13. Poland
- 9.3.13.1. Market Analysis, Forecast, and Y-O-Y Growth Rate, 2019 - 2032, (US$ Million)
- 9.3.13.2. Poland Market Size and Forecast, By Product Type, 2019 - 2032 (US$ Million)
- 9.3.13.3. Poland Market Size and Forecast, By End-User, 2019 - 2032 (US$ Million)
- 9.3.14. Rest of Europe
- 9.3.14.1. Overview
- 9.3.14.2. Market Analysis, Forecast, and Y-O-Y Growth Rate, 2019 - 2032, (US$ Million)
- 9.3.14.3. Rest of the Europe Market Size and Forecast, By Product Type, 2019 - 2032 (US$ Million)
- 9.3.14.4. Rest of the Europe Market Size and Forecast, By End-User, 2019 - 2032 (US$ Million)
- 9.4. Asia Pacific (APAC)
- 9.4.1. Overview
- 9.4.2. Data Center Power and Cooling Solutions Key Manufacturers in Asia Pacific
- 9.4.3. Asia Pacific Market Size and Forecast, By Country, 2019 - 2032 (US$ Million)
- 9.4.4. Asia Pacific Market Size and Forecast, By Product Type, 2019 - 2032 (US$ Million)
- 9.4.5. Asia Pacific Market Size and Forecast, By End-User, 2019 - 2032 (US$ Million)
- 9.4.6. India
- 9.4.6.1. Overview
- 9.4.6.2. Market Analysis, Forecast, and Y-O-Y Growth Rate, 2019 - 2032, (US$ Million)
- 9.4.6.3. India Market Size and Forecast, By Product Type, 2019 - 2032 (US$ Million)
- 9.4.6.4. India Market Size and Forecast, By End-User, 2019 - 2032 (US$ Million)
- 9.4.7. China
- 9.4.7.1. Overview
- 9.4.7.2. Market Analysis, Forecast, and Y-O-Y Growth Rate, 2019 - 2032, (US$ Million)
- 9.4.7.3. China Market Size and Forecast, By Product Type, 2019 - 2032 (US$ Million)
- 9.4.7.4. China Market Size and Forecast, By End-User, 2019 - 2032 (US$ Million)
- 9.4.8. Japan
- 9.4.8.1. Overview
- 9.4.8.2. Market Analysis, Forecast, and Y-O-Y Growth Rate, 2019 - 2032, (US$ Million)
- 9.4.8.3. Japan Market Size and Forecast, By Product Type, 2019 - 2032 (US$ Million)
- 9.4.8.4. Japan Market Size and Forecast, By End-User, 2019 - 2032 (US$ Million)
- 9.4.9. South Korea
- 9.4.9.1. Overview
- 9.4.9.2. Market Analysis, Forecast, and Y-O-Y Growth Rate, 2019 - 2032, (US$ Million)
- 9.4.9.3. South Korea Market Size and Forecast, By Product Type, 2019 - 2032 (US$ Million)
- 9.4.9.4. South Korea Market Size and Forecast, By End-User, 2019 - 2032 (US$ Million)
- 9.4.10. Australia
- 9.4.10.1. Overview
- 9.4.10.2. Market Analysis, Forecast, and Y-O-Y Growth Rate, 2019 - 2032, (US$ Million)
- 9.4.10.3. Australia Market Size and Forecast, By Product Type, 2019 - 2032 (US$ Million)
- 9.4.10.4. Australia Market Size and Forecast, By End-User, 2019 - 2032 (US$ Million)
- 9.4.11. Thailand
- 9.4.11.1. Overview
- 9.4.11.2. Market Analysis, Forecast, and Y-O-Y Growth Rate, 2019 - 2032, (US$ Million)
- 9.4.11.3. Thailand Market Size and Forecast, By Product Type, 2019 - 2032 (US$ Million)
- 9.4.11.4. Thailand Market Size and Forecast, By End-User, 2019 - 2032 (US$ Million)
- 9.4.12. Indonesia
- 9.4.12.1. Overview
- 9.4.12.2. Market Analysis, Forecast, and Y-O-Y Growth Rate, 2019 - 2032, (US$ Million)
- 9.4.12.3. Indonesia Market Size and Forecast, By Product Type, 2019 - 2032 (US$ Million)
- 9.4.12.4. Indonesia Market Size and Forecast, By End-User, 2019 - 2032 (US$ Million)
- 9.4.13. Philippines
- 9.4.13.1. Overview
- 9.4.13.2. Market Analysis, Forecast, and Y-O-Y Growth Rate, 2019 - 2032, (US$ Million)
- 9.4.13.3. Philippines Market Size and Forecast, By Product Type, 2019 - 2032 (US$ Million)
- 9.4.13.4. Philippines Market Size and Forecast, By End-User, 2019 - 2032 (US$ Million)
- 9.4.14. Rest of APAC
- 9.4.14.1. Overview
- 9.4.14.2. Market Analysis, Forecast, and Y-O-Y Growth Rate, 2019 - 2032, (US$ Million)
- 9.4.14.3. Rest of APAC Market Size and Forecast, By Product Type, 2019 - 2032 (US$ Million)
- 9.4.14.4. Rest of APAC Market Size and Forecast, By End-User, 2019 - 2032 (US$ Million)
- 9.5. Latin America
- 9.5.1. Overview
- 9.5.2. Data Center Power and Cooling Solutions Key Manufacturers in Latin America
- 9.5.3. Latin America Market Size and Forecast, By Country, 2019 - 2032 (US$ Million)
- 9.5.4. Latin America Market Size and Forecast, By Product Type, 2019 - 2032 (US$ Million)
- 9.5.5. Latin America Market Size and Forecast, By End-User, 2019 - 2032 (US$ Million)
- 9.5.6. Brazil
- 9.5.6.1. Overview
- 9.5.6.2. Market Analysis, Forecast, and Y-O-Y Growth Rate, 2019 - 2032, (US$ Million)
- 9.5.6.3. Brazil Market Size and Forecast, By Product Type, 2019 - 2032 (US$ Million)
- 9.5.6.4. Brazil Market Size and Forecast, By End-User, 2019 - 2032 (US$ Million)
- 9.5.7. Mexico
- 9.5.7.1. Overview
- 9.5.7.2. Market Analysis, Forecast, and Y-O-Y Growth Rate, 2019 - 2032, (US$ Million)
- 9.5.7.3. Mexico Market Size and Forecast, By Product Type, 2019 - 2032 (US$ Million)
- 9.5.7.4. Mexico Market Size and Forecast, By End-User, 2019 - 2032 (US$ Million)
- 9.5.8. Argentina
- 9.5.8.1. Overview
- 9.5.8.2. Market Analysis, Forecast, and Y-O-Y Growth Rate, 2019 - 2032, (US$ Million)
- 9.5.8.3. Argentina Market Size and Forecast, By Product Type, 2019 - 2032 (US$ Million)
- 9.5.8.4. Argentina Market Size and Forecast, By End-User, 2019 - 2032 (US$ Million)
- 9.5.9. Colombia
- 9.5.9.1. Overview
- 9.5.9.2. Market Analysis, Forecast, and Y-O-Y Growth Rate, 2019 - 2032, (US$ Million)
- 9.5.9.3. Colombia Market Size and Forecast, By Product Type, 2019 - 2032 (US$ Million)
- 9.5.9.4. Colombia Market Size and Forecast, By End-User, 2019 - 2032 (US$ Million)
- 9.5.10. Rest of LATAM
- 9.5.10.1. Overview
- 9.5.10.2. Market Analysis, Forecast, and Y-O-Y Growth Rate, 2019 - 2032, (US$ Million)
- 9.5.10.3. Rest of LATAM Market Size and Forecast, By Product Type, 2019 - 2032 (US$ Million)
- 9.5.10.4. Rest of LATAM Market Size and Forecast, By End-User, 2019 - 2032 (US$ Million)
- 9.6. Middle East and Africa
- 9.6.1. Overview
- 9.6.2. Data Center Power and Cooling Solutions Key Manufacturers in Middle East and Africa
- 9.6.3. Middle East and Africa Market Size and Forecast, By Country, 2019 - 2032 (US$ Million)
- 9.6.4. Middle East and Africa Market Size and Forecast, By Product Type, 2019 - 2032 (US$ Million)
- 9.6.5. Middle East and Africa Market Size and Forecast, By End-User, 2019 - 2032 (US$ Million)
- 9.6.6. Saudi Arabia
- 9.6.6.1. Overview
- 9.6.6.2. Market Analysis, Forecast, and Y-O-Y Growth Rate, 2019 - 2032, (US$ Million)
- 9.6.6.3. Saudi Arabia Market Size and Forecast, By Product Type, 2019 - 2032 (US$ Million)
- 9.6.6.4. Saudi Arabia Market Size and Forecast, By End-User, 2019 - 2032 (US$ Million)
- 9.6.7. United Arab Emirates
- 9.6.7.1. Overview
- 9.6.7.2. Market Analysis, Forecast, and Y-O-Y Growth Rate, 2019 - 2032, (US$ Million)
- 9.6.7.3. United Arab Emirates Market Size and Forecast, By Product Type, 2019 - 2032 (US$ Million)
- 9.6.7.4. United Arab Emirates Market Size and Forecast, By End-User, 2019 - 2032 (US$ Million)
- 9.6.8. Israel
- 9.6.8.1. Overview
- 9.6.8.2. Market Analysis, Forecast, and Y-O-Y Growth Rate, 2019 - 2032, (US$ Million)
- 9.6.8.3. Israel Market Size and Forecast, By Product Type, 2019 - 2032 (US$ Million)
- 9.6.8.4. Israel Market Size and Forecast, By End-User, 2019 - 2032 (US$ Million)
- 9.6.9. Turkey
- 9.6.9.1. Overview
- 9.6.9.2. Market Analysis, Forecast, and Y-O-Y Growth Rate, 2019 - 2032, (US$ Million)
- 9.6.9.3. Turkey Market Size and Forecast, By Product Type, 2019 - 2032 (US$ Million)
- 9.6.9.4. Turkey Market Size and Forecast, By End-User, 2019 - 2032 (US$ Million)
- 9.6.10. Algeria
- 9.6.10.1. Overview
- 9.6.10.2. Market Analysis, Forecast, and Y-O-Y Growth Rate, 2019 - 2032, (US$ Million)
- 9.6.10.3. Algeria Market Size and Forecast, By Product Type, 2019 - 2032 (US$ Million)
- 9.6.10.4. Algeria Market Size and Forecast, By End-User, 2019 - 2032 (US$ Million)
- 9.6.11. Egypt
- 9.6.11.1. Overview
- 9.6.11.2. Market Analysis, Forecast, and Y-O-Y Growth Rate, 2019 - 2032, (US$ Million)
- 9.6.11.3. Egypt Market Size and Forecast, By Product Type, 2019 - 2032 (US$ Million)
- 9.6.11.4. Egypt Market Size and Forecast, By End-User, 2019 - 2032 (US$ Million)
- 9.6.12. Rest of MEA
- 9.6.12.1. Overview
- 9.6.12.2. Market Analysis, Forecast, and Y-O-Y Growth Rate, 2019 - 2032, (US$ Million)
- 9.6.12.3. Rest of MEA Market Size and Forecast, By Product Type, 2019 - 2032 (US$ Million)
- 9.6.12.4. Rest of MEA Market Size and Forecast, By End-User, 2019 - 2032 (US$ Million)
10. Key Vendor Analysis- Data Center Power and Cooling Solutions Industry
- 10.1. Competitive Dashboard
- 10.1.1. Company Profiles
- 10.1.2. Schneider Electric
- 10.1.3. Eaton
- 10.1.4. ABB
- 10.1.5. Vertiv
- 10.1.6. Siemens
- 10.1.7. nVent
- 10.1.8. STULZ
- 10.1.9. Cloud & Heat
- 10.1.10. General Electric
- 10.1.11. Critical Power
11. 360 Degree Analyst View
12. Appendix
- 12.1. Research Methodology
- 12.2. References
- 12.3. Abbreviations
- 12.4. Disclaimer
- 12.5. Contact Us

