|
|
市場調査レポート
商品コード
1514963
ニューラルプロセッサー市場:用途別、エンドユーザー別、国別、地域別-2024~2032年の産業分析、市場規模、市場シェア、予測Neural Processor Market, By Application, By End User, By Country, and By Region - Industry Analysis, Market Size, Market Share & Forecast from 2024-2032 |
||||||
|
|||||||
カスタマイズ可能
|
|||||||

| ニューラルプロセッサー市場:用途別、エンドユーザー別、国別、地域別-2024~2032年の産業分析、市場規模、市場シェア、予測 |
|
出版日: 2024年06月04日
発行: AnalystView Market Insights
ページ情報: 英文 303 Pages
納期: 2~3営業日
|

全表示
- 概要
- 図表
- 目次
レポートハイライト
ニューラルプロセッサー市場規模は2023年に2億2,690万米ドルとなり、2024~2032年にかけてCAGR 19.00%で拡大
ニューラルプロセッサー市場-市場力学
スマートデバイスとスマートシティの需要増加
AIやIoTなどの新興諸国は、発展途上国におけるスマートシティプログラムを立ち上げる可能性を秘めています。AIやIoT対応ガジェットは大量のデータを生成します。データ量の急増により、あらゆる産業で高速プロセッサーの需要が増加しており、市場開拓に影響を与えていることは間違いないです。例えば、2021年1月、無線と音声処理チップセットソリューションの大手開発企業であるDSP Group Inc.は、低コストのAIと機械学習SOCであるDBM10のデビューを発表しました。このSOCは、デジタルシグナル・プロセッサーとナイトライトニューラルプロセッサーで構成されています。
ニューラルプロセッサー市場-主要洞察
当社の研究アナリストは、世界市場は2024~2032年にかけて約19.00%のCAGRで発展すると予測しています。
用途別では、2023年には金融予測が市場で収益シェアを占めていました。
エンドユーザー別では、2023年には小売セグメントが最大の市場収益シェアを占めました。
地域別では、アジア太平洋が2023年の収益で首位となりました。
ニューラルプロセッサー市場-セグメンテーション分析:
ニューラルプロセッサーの世界市場は、用途、エンドユーザー、地域によって区分されます。
市場は用途に基づいて5つのカテゴリーに分けられます:ハードウェア診断、画像最適化、不正検出、金融予測、その他。2023年には、金融予測カテゴリーが市場で収益シェアを占めました。ニューラルネットワークは、金融データの複雑なパターンや関係を特定することに優れており、その結果、より正確な予測モデルが実現されます。ニューラルプロセッサーがより強力になり、金融用途に特化するにつれて、予測精度の向上に寄与します。その結果、こうした特徴が同セグメントの拡大を牽引することになります。
市場はエンドユーザーに基づき7つのカテゴリーに分類されます:小売、防衛機関、メディア、BFSI、医療、物流、その他です。2023年の市場収益シェアは小売カテゴリーが最も大きいです。人工知能が民生用電子機器製品に普及するにつれ、小売機器におけるニューラルプロセッサーの需要は増加すると予測されています。メーカーは、スマートフォン、カメラ、スマートスピーカー、ウェアラブルなどのデバイスにAI機能を組み込んでおり、効率的なニューラルプロセッシングユニット(NPU)の需要を高めています。
ニューラルプロセッサー市場-地理的洞察
地理的には、この市場は北米、ラテンアメリカ、欧州、アジア太平洋、中東・アフリカに存在します。これらのゾーンは、どの国がビジネスをもたらすかに基づいてさらに分割されます。アジア太平洋は2023年に市場を席巻し、予測期間中もニューラルプロセッサー市場で最大のシェアを維持し続ける可能性が高いです。この地域の国々は研究開発に投資しており、これがニューラルプロセッサーセグメントの拡大を促進しています。中国、日本、インド、韓国はいずれも市場成長に大きく貢献しています。これらの国々は、大規模なニューラルプロセッサーメーカーや研究施設を含む充実した技術産業を持っています。
北米が2023年に最も急速に拡大する地域であるのは、多くの企業が新技術を広く採用しているためです。また、強化されたプロセッサーに投資する多数の大手メーカーの存在も、市場拡大の主要促進要因として認識されています。さらに、AI新興企業への投資の増加が地域市場の成長を促進しています。米国とカナダは、驚くほど発達した高度に訓練された労働力プールと、認知された研究開発機関を有しており、この地域における新技術の創出に影響を与えています。
ニューラルプロセッサー市場-競合情勢:
競争の激しいニューラルプロセッサー市場では、複数の重要な競合企業が優位なポジションを争っています。Applied Brain Research, Inc.、BrainChip Holdings Ltd.、Intel Corporation、Samsung Electronics Co., Ltd.などの企業がこのセグメントの主要参入企業です。これらの企業は、人工知能タスクを効果的に促進する最先端のニューラルプロセッシングユニットを提供しています。これらの企業は、さまざまな産業でAI用途に対するニーズの高まりに対応する高性能ニューラルプロセッサーを開発するため、絶えず技術革新を行っています。
目次
第1章 ニューラルプロセッサー市場概要
- 調査範囲
- 市場推定年
第2章 エグゼクティブ概要
- 市場内訳
- 競合考察
第3章 ニューラルプロセッサーの主要市場動向
- 市場促進要因
- 市場抑制要因
- 市場機会
- 市場の将来動向
第4章 ニューラルプロセッサー産業の調査
- PEST分析
- ポーターのファイブフォース分析
- 成長展望マッピング
- 規制枠組み分析
第5章 ニューラルプロセッサー市場: COVID-19の影響分析
- COVID-19前の影響分析
- COVID-19後の影響分析
第6章 ニューラルプロセッサー市場情勢
- ニューラルプロセッサー市場シェア分析、2023年
- 主要メーカー別内訳データ
- 既存企業の分析
- 新興企業の分析
第7章 ニューラルプロセッサー市場-用途別
- 概要
- 用途別セグメントシェア分析
- ハードウェア診断
- 画像の最適化
- 不正行為検出
- 財務予測
- その他
第8章 ニューラルプロセッサー市場-エンドユーザー別
- 概要
- エンドユーザー別セグメントシェア分析
- 小売
- 防衛機関
- 中
- BFSI
- 医療
- ロジスティクス
- その他
第9章 ニューラルプロセッサー市場-地域別
- イントロダクション
- 北米
- 概要
- 北米の主要メーカー
- 米国
- カナダ
- 欧州
- 概要
- 欧州の主要メーカー
- ドイツ
- イタリア
- 英国
- フランス
- ロシア
- オランダ
- スウェーデン
- ポーランド
- その他
- アジア太平洋
- 概要
- アジア太平洋の主要メーカー
- インド
- 中国
- 日本
- 韓国
- オーストラリア
- タイ
- インドネシア
- フィリピン
- その他
- ラテンアメリカ
- 概要
- ラテンアメリカの主要メーカー
- ブラジル
- メキシコ
- アルゼンチン
- コロンビア
- その他
- 中東・アフリカ
- 概要
- 中東・アフリカの主要メーカー
- サウジアラビア
- アラブ首長国連邦
- イスラエル
- トルコ
- アルジェリア
- エジプト
- その他
第10章 主要ベンダー分析-ニューラルプロセッサー業界
- 競合ダッシュボード
- 企業プロファイル
- Applied Brain Research, Inc.
- BrainChip Holdings Ltd
- Intel Corporation
- Samsung Electronics Co., Ltd.
- Hewlett Packard Enterprise Company
- NVIDIA Corporation
- Bit&Brain Technologies SL
- BrainCo, Inc.
- General Vision Inc.
- Aspinity, Inc.
- その他
第11章 アナリストの全方位展望
List of Tables
- TABLE List of data sources
- TABLE Market drivers; Impact Analysis
- TABLE Market restraints; Impact Analysis
- TABLE Neural Processor Market: Application Snapshot (2023)
- TABLE Segment Dashboard; Definition and Scope, by Application
- TABLE Global Neural Processor Market, by Application 2019-2032 (USD Million)
- TABLE Neural Processor Market: End User Snapshot (2023)
- TABLE Segment Dashboard; Definition and Scope, by End User
- TABLE Global Neural Processor Market, by End User 2019-2032 (USD Million)
- TABLE TABLE Neural Processor Market: Regional snapshot (2023)
- TABLE Segment Dashboard; Definition and Scope, by Region
- TABLE Global Neural Processor Market, by Region 2019-2032 (USD Million)
- TABLE North America Neural Processor Market, by Country, 2019-2032 (USD Million)
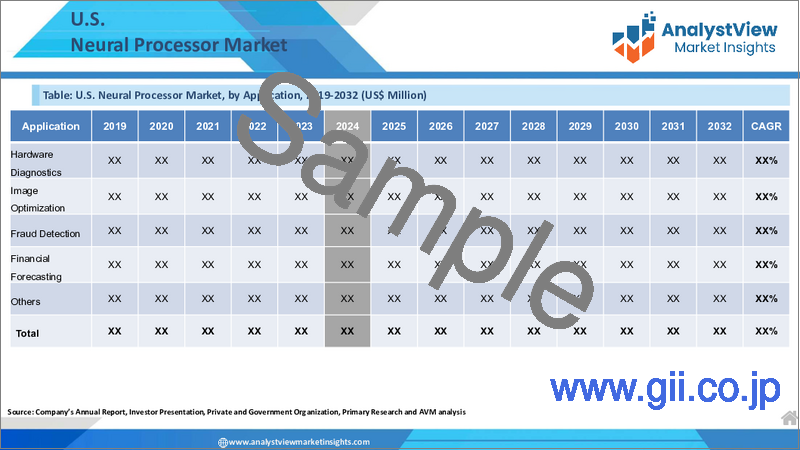
- TABLE North America Neural Processor Market, by Application, 2019-2032 (USD Million)
- TABLE North America Neural Processor Market, by End User, 2019-2032 (USD Million)
- TABLE Europe Neural Processor Market, by Country, 2019-2032 (USD Million)
- TABLE Europe Neural Processor Market, by Application, 2019-2032 (USD Million)
- TABLE Europe Neural Processor Market, by End User, 2019-2032 (USD Million)
- TABLE Asia Pacific Neural Processor Market, by Country, 2019-2032 (USD Million)
- TABLE Asia Pacific Neural Processor Market, by Application, 2019-2032 (USD Million)
- TABLE Asia Pacific Neural Processor Market, by End User, 2019-2032 (USD Million)
- TABLE Latin America Neural Processor Market, by Country, 2019-2032 (USD Million)
- TABLE Latin America Neural Processor Market, by Application, 2019-2032 (USD Million)
- TABLE Latin America Neural Processor Market, by End User, 2019-2032 (USD Million)
- TABLE Middle East and Africa Neural Processor Market, by Country, 2019-2032 (USD Million)
- TABLE Middle East and Africa Neural Processor Market, by Application, 2019-2032 (USD Million)
- TABLE Middle East and Africa Neural Processor Market, by End User, 2019-2032 (USD Million)
List of Figures
- FIGURE Neural Processor Market Segmentation
- FIGURE Market research methodology
- FIGURE Value chain analysis
- FIGURE Porter's Five Forces Analysis
- FIGURE Market Attractiveness Analysis
- FIGURE COVID-19 Impact Analysis
- FIGURE Pre & Post COVID-19 Impact Comparision Study
- FIGURE Competitive Landscape; Key company market share analysis, 2023
- FIGURE Application segment market share analysis, 2023 & 2032
- FIGURE Application segment market size forecast and trend analysis, 2019 to 2032 (USD Million)
- FIGURE End User segment market share analysis, 2023 & 2032
- FIGURE End User segment market size forecast and trend analysis, 2019 to 2032 (USD Million)
- FIGURE Regional segment market share analysis, 2023 & 2032
- FIGURE Regional segment market size forecast and trend analysis, 2019 to 2032 (USD Million)
- FIGURE North America Neural Processor Market share and leading players, 2023
- FIGURE Europe Neural Processor Market share and leading players, 2023
- FIGURE Asia Pacific Neural Processor Market share and leading players, 2023
- FIGURE Latin America Neural Processor Market share and leading players, 2023
- FIGURE Middle East and Africa Neural Processor Market share and leading players, 2023
- FIGURE North America market share analysis by country, 2023
- FIGURE U.S. Neural Processor Market size, forecast and trend analysis, 2019 to 2032 (USD Million)
- FIGURE Canada Neural Processor Market size, forecast and trend analysis, 2019 to 2032 (USD Million)
- FIGURE Europe Neural Processor Market share analysis by country, 2023
- FIGURE Germany Neural Processor Market size, forecast and trend analysis, 2019 to 2032 (USD Million)
- FIGURE Spain Neural Processor Market size, forecast and trend analysis, 2019 to 2032 (USD Million)
- FIGURE Italy Neural Processor Market size, forecast and trend analysis, 2019 to 2032 (USD Million)
- FIGURE France Neural Processor Market size, forecast and trend analysis, 2019 to 2032 (USD Million)
- FIGURE UK Neural Processor Market size, forecast and trend analysis, 2019 to 2032 (USD Million)
- FIGURE Russia Neural Processor Market size, forecast and trend analysis, 2019 to 2032 (USD Million)
- FIGURE Netherlands Neural Processor Market size, forecast and trend analysis, 2019 to 2032 (USD Million)
- FIGURE Sweden Neural Processor Market size, forecast and trend analysis, 2019 to 2032 (USD Million)
- FIGURE Poland Neural Processor Market size, forecast and trend analysis, 2019 to 2032 (USD Million)
- FIGURE Rest of the Europe Neural Processor Market size, forecast and trend analysis, 2019 to 2032 (USD Million)
- FIGURE Asia Pacific Neural Processor Market share analysis by country, 2023
- FIGURE India Neural Processor Market size, forecast and trend analysis, 2019 to 2032 (USD Million)
- FIGURE China Neural Processor Market size, forecast and trend analysis, 2019 to 2032 (USD Million)
- FIGURE Japan Neural Processor Market size, forecast and trend analysis, 2019 to 2032 (USD Million)
- FIGURE South Korea Neural Processor Market size, forecast and trend analysis, 2019 to 2032 (USD Million)
- FIGURE Australia Neural Processor Market size, forecast and trend analysis, 2019 to 2032 (USD Million)
- FIGURE Thailand Neural Processor Market size, forecast and trend analysis, 2019 to 2032 (USD Million)
- FIGURE Indonesia Neural Processor Market size, forecast and trend analysis, 2019 to 2032 (USD Million)
- FIGURE Philippines Neural Processor Market size, forecast and trend analysis, 2019 to 2032 (USD Million)
- FIGURE Rest of APAC Neural Processor Market size, forecast and trend analysis, 2019 to 2032 (USD Million)
- FIGURE Latin America Neural Processor Market size, forecast and trend analysis, 2019 to 2032 (USD Million)
- FIGURE Latin America Neural Processor Market share analysis by country, 2023
- FIGURE Brazil Neural Processor Market size, forecast and trend analysis, 2019 to 2032 (USD Million)
- FIGURE Mexico Neural Processor Market size, forecast and trend analysis, 2019 to 2032 (USD Million)
- FIGURE Argentina Neural Processor Market size, forecast and trend analysis, 2019 to 2032 (USD Million)
- FIGURE Colombia Neural Processor Market size, forecast and trend analysis, 2019 to 2032 (USD Million)
- FIGURE Rest of LATAM Neural Processor Market size, forecast and trend analysis, 2019 to 2032 (USD Million)
- FIGURE Middle East and Africa Neural Processor Market size, forecast and trend analysis, 2019 to 2032 (USD Million)
- FIGURE Middle East and Africa Neural Processor Market share analysis by country, 2023
- FIGURE Saudi Arabia Neural Processor Market size, forecast and trend analysis, 2019 to 2032 (USD Million)
- FIGURE United Arab Emirates Neural Processor Market size, forecast and trend analysis, 2019 to 2032 (USD Million)
- FIGURE Israel Neural Processor Market size, forecast and trend analysis, 2019 to 2032 (USD Million)
- FIGURE Turkey Neural Processor Market size, forecast and trend analysis, 2019 to 2032 (USD Million)
- FIGURE Algeria Neural Processor Market size, forecast and trend analysis, 2019 to 2032 (USD Million)
- FIGURE Egypt Neural Processor Market size, forecast and trend analysis, 2019 to 2032 (USD Million)
- FIGURE Rest of MEA Neural Processor Market size, forecast and trend analysis, 2019 to 2032 (USD Million)
REPORT HIGHLIGHT
Neural Processor Market size was valued at USD 226.9 Million in 2023, expanding at a CAGR of 19.00% from 2024 to 2032.
Neural processors, also known as neural processing units, are specialized microprocessor circuits that implement logic and arithmetic control. This is required to accelerate machine learning algorithms when working with predictive models such as random forests and artificial neural networks. Neural network processors lower the amount of computer processing used over the entire network. They employ neural networks to merge machine learning and artificial intelligence into a single system. They are ineffective at performing simple computing tasks.
Neural Processor Market- Market Dynamics
Increasing Demand for Smart Devices and Smart Cities
Emerging technologies such as AI and IoT have the potential to launch smart city programs in developing countries. AI and IoT-enabled gadgets generate massive amounts of data. Due to the rapid growth in data volume, there is an increase in demand for high-speed processors across all industries, which is undoubtedly influencing market development. For instance, in January 2021, DSP Group Inc., a major developer of wireless and speech processing chipset solutions, announced the debut of DBM10, a low-cost AI and machine learning SOC. The SOC consists of a Digital Signal Processor and a nitrite Neural Processor.
Neural Processor Market- Key Insights
Our research analyst estimates that the global market will develop at a CAGR of approximately 19.00% from 2024 to 2032.
Based on Application segmentation, in 2023, financial forecasting had a revenue share in the market.
Based on End-user segmentation, the retail segment had the largest market revenue share in 2023..
On the basis of region, Asia Pacific was the leading revenue generator in 2023
Neural Processor Market- Segmentation Analysis:
The Global Neural Processor Market is segmented on the basis of Application, End User, and Region.
The market is divided into five categories based on Application: Hardware Diagnostics, Image Optimization, Fraud Detection, Financial Forecasting, and Others. In 2023, the financial forecasting category had a revenue share in the market. Neural networks excel in identifying complicated patterns and relationships in financial data, resulting in more accurate forecasting models. As neural processors become more powerful and specialized for financial applications, they contribute to higher prediction accuracy. As a result, these features will drive the segment's expansion.
The market is divided into seven categories based on End Users: Retail, Defense Agencies, Media, BFSI, Healthcare, Logistics, and Others. The retail category had the biggest market revenue share in 2023. As artificial intelligence becomes more prevalent in consumer electronics, the demand for neural processors in retail devices is projected to increase. Manufacturers are incorporating AI capabilities into devices like smartphones, cameras, smart speakers, and wearables, increasing the demand for efficient neural processing units (NPUs).
Neural Processor Market- Geographical Insights
Geographically, this market is present in North America, Latin America, Europe, Asia Pacific, and the Middle East and Africa. These zones are further split based on which countries bring business. Asia Pacific dominated the market in 2023 and is likely to continue to maintain the greatest share of the Neural Processor Market during the forecast period. Countries in the area are investing in R&D, which is driving the expansion of the neural processor sector. China, Japan, India, and South Korea all make substantial contributions to market growth. These countries have substantial technical industries, including large neural processor manufacturers and research facilities.
North America is the fastest expanding region in 2023 because to widespread adoption of new technology by numerous enterprises. The existence of a large number of significant manufacturers investing in enhanced processors has also been identified as a major driver of market expansion. In addition, increased investment in AI start-ups is fueling regional market growth. The United States and Canada have incredibly well-developed and highly trained labor pools, as well as recognized research and development institutions, which influence the creation of new technology in this region.
Neural Processor Market- Competitive Landscape:
In the competitive Neural Processor market, several significant competitors are vying for a prominent position. Companies such as Applied Brain Research, Inc., BrainChip Holdings Ltd, Intel Corporation, and Samsung Electronics Co., Ltd. are key players in this field. They provide cutting-edge neural processing units that effectively expedite artificial intelligence tasks. These businesses are constantly innovating to create high-performance neural processors that meet the growing need for AI applications across multiple industries.
Recent Developments:
In January 2024, NVIDIA Corporation released new GeForce RTX(TM) SUPER desktop GPUs to improve generative AI performance, along with AI laptops from top OEMs. They also unveiled new NVIDIA RTX(TM)-accelerated AI package and tools for developers and consumers, using decades of PC experience. These technologies include NVIDIA TensorRT(TM) acceleration for text-to-image workflows, NVIDIA RTX Remix for AI-based texture creation, NVIDIA ACE microservices, and additional games which use DLSS 3 technology for frame generation.
SCOPE OF THE REPORT
The scope of this report covers the market by its major segments, which include as following:
GLOBAL NEURAL PROCESSOR MARKET KEY PLAYERS- DETAILED COMPETITIVE INSIGHTS
Applied Brain Research, Inc.
BrainChip Holdings Ltd
Intel Corporation
Samsung Electronics Co., Ltd.
Hewlett Packard Enterprise Company
NVIDIA Corporation
Bit&Brain Technologies S.L
BrainCo, Inc.
General Vision Inc.
Aspinity, Inc.
Others
GLOBAL NEURAL PROCESSOR MARKET, BY APPLICATION- MARKET ANALYSIS, 2019 - 2032
- Hardware Diagnostics
- Image Optimization
- Fraud Detection
- Financial Forecasting
- Others
GLOBAL NEURAL PROCESSOR MARKET, BY END USER- MARKET ANALYSIS, 2019 - 2032
- Retail
- Defense Agencies
- Media
- BFSI
- Healthcare
- Logistics
- Others
GLOBAL NEURAL PROCESSOR MARKET, BY REGION- MARKET ANALYSIS, 2019 - 2032
- North America
- The U.S.
- Canada
- Europe
- Germany
- France
- Italy
- Spain
- United Kingdom
- Russia
- Netherlands
- Sweden
- Poland
- Rest of Europe
- Asia Pacific
- India
- China
- South Korea
- Japan
- Australia
- Thailand
- Indonesia
- Philippines
- Rest of APAC
- Latin America
- Brazil
- Mexico
- Argentina
- Colombia
- Rest of LATAM
- The Middle East and Africa
- Saudi Arabia
- United Arab Emirates
- Israel
- Turkey
- Algeria
- Egypt
- Rest of MEA
Table of Contents
1. Neural Processor Market Overview
- 1.1. Study Scope
- 1.2. Market Estimation Years
2. Executive Summary
- 2.1. Market Snippet
- 2.1.1. Neural Processor Market Snippet by Application
- 2.1.2. Neural Processor Market Snippet by End User
- 2.1.3. Neural Processor Market Snippet by Country
- 2.1.4. Neural Processor Market Snippet by Region
- 2.2. Competitive Insights
3. Neural Processor Key Market Trends
- 3.1. Neural Processor Market Drivers
- 3.1.1. Impact Analysis of Market Drivers
- 3.2. Neural Processor Market Restraints
- 3.2.1. Impact Analysis of Market Restraints
- 3.3. Neural Processor Market Opportunities
- 3.4. Neural Processor Market Future Trends
4. Neural Processor Industry Study
- 4.1. PEST Analysis
- 4.2. Porter's Five Forces Analysis
- 4.3. Growth Prospect Mapping
- 4.4. Regulatory Framework Analysis
5. Neural Processor Market: COVID-19 Impact Analysis
- 5.1. Pre-COVID-19 Impact Analysis
- 5.2. Post-COVID-19 Impact Analysis
- 5.2.1. Top Performing Segments
- 5.2.2. Marginal Growth Segments
- 5.2.3. Top Looser Segments
- 5.2.4. Marginal Loss Segments
6. Neural Processor Market Landscape
- 6.1. Neural Processor Market Share Analysis, 2023
- 6.2. Breakdown Data, by Key Manufacturer
- 6.2.1. Established Players' Analysis
- 6.2.2. Emerging Players' Analysis
7. Neural Processor Market - By Application
- 7.1. Overview
- 7.1.1. Segment Share Analysis, By Application, 2023 & 2032 (%)
- 7.1.2. Hardware Diagnostics
- 7.1.3. Image Optimization
- 7.1.4. Fraud Detection
- 7.1.5. Financial Forecasting
- 7.1.6. Others
8. Neural Processor Market - By End User
- 8.1. Overview
- 8.1.1. Segment Share Analysis, By End User, 2023 & 2032 (%)
- 8.1.2. Retail
- 8.1.3. Defense Agencies
- 8.1.4. Media
- 8.1.5. BFSI
- 8.1.6. Healthcare
- 8.1.7. Logistics
- 8.1.8. Others
9. Neural Processor Market- By Geography
- 9.1. Introduction
- 9.1.1. Segment Share Analysis, By Geography, 2023 & 2032 (%)
- 9.2. North America
- 9.2.1. Overview
- 9.2.2. Neural Processor Key Manufacturers in North America
- 9.2.3. North America Market Size and Forecast, By Country, 2019 - 2032 (US$ Million)
- 9.2.4. North America Market Size and Forecast, By Application, 2019 - 2032 (US$ Million)
- 9.2.5. North America Market Size and Forecast, By End User, 2019 - 2032 (US$ Million)
- 9.2.6. U.S.
- 9.2.6.1. Overview
- 9.2.6.2. Market Analysis, Forecast, and Y-O-Y Growth Rate, 2019 - 2032, (US$ Million)
- 9.2.6.3. U.S. Market Size and Forecast, By Application, 2019 - 2032 (US$ Million)
- 9.2.6.4. U.S. Market Size and Forecast, By End User, 2019 - 2032 (US$ Million)
- 9.2.7. Canada
- 9.2.7.1. Overview
- 9.2.7.2. Market Analysis, Forecast, and Y-O-Y Growth Rate, 2019 - 2032, (US$ Million)
- 9.2.7.3. Canada Market Size and Forecast, By Application, 2019 - 2032 (US$ Million)
- 9.2.7.4. Canada Market Size and Forecast, By End User, 2019 - 2032 (US$ Million)
- 9.3. Europe
- 9.3.1. Overview
- 9.3.2. Neural Processor Key Manufacturers in Europe
- 9.3.3. Europe Market Size and Forecast, By Country, 2019 - 2032 (US$ Million)
- 9.3.4. Europe Market Size and Forecast, By Application, 2019 - 2032 (US$ Million)
- 9.3.5. Europe Market Size and Forecast, By End User, 2019 - 2032 (US$ Million)
- 9.3.6. Germany
- 9.3.6.1. Overview
- 9.3.6.2. Market Analysis, Forecast, and Y-O-Y Growth Rate, 2019 - 2032, (US$ Million)
- 9.3.6.3. Germany Market Size and Forecast, By Application, 2019 - 2032 (US$ Million)
- 9.3.6.4. Germany Market Size and Forecast, By End User, 2019 - 2032 (US$ Million)
- 9.3.7. Italy
- 9.3.7.1. Overview
- 9.3.7.2. Market Analysis, Forecast, and Y-O-Y Growth Rate, 2019 - 2032, (US$ Million)
- 9.3.7.3. Italy Market Size and Forecast, By Application, 2019 - 2032 (US$ Million)
- 9.3.7.4. Italy Market Size and Forecast, By End User, 2019 - 2032 (US$ Million)
- 9.3.8. United Kingdom
- 9.3.8.1. Overview
- 9.3.8.2. Market Analysis, Forecast, and Y-O-Y Growth Rate, 2019 - 2032, (US$ Million)
- 9.3.8.3. United Kingdom Market Size and Forecast, By Application, 2019 - 2032 (US$ Million)
- 9.3.8.4. United Kingdom Market Size and Forecast, By End User, 2019 - 2032 (US$ Million)
- 9.3.9. France
- 9.3.9.1. Overview
- 9.3.9.2. Market Analysis, Forecast, and Y-O-Y Growth Rate, 2019 - 2032, (US$ Million)
- 9.3.9.3. France Market Size and Forecast, By Application, 2019 - 2032 (US$ Million)
- 9.3.9.4. France Market Size and Forecast, By End User, 2019 - 2032 (US$ Million)
- 9.3.10. Russia
- 9.3.10.1. Market Analysis, Forecast, and Y-O-Y Growth Rate, 2019 - 2032, (US$ Million)
- 9.3.10.2. Russia Market Size and Forecast, By Application, 2019 - 2032 (US$ Million)
- 9.3.10.3. Russia Market Size and Forecast, By End User, 2019 - 2032 (US$ Million)
- 9.3.11. Netherlands
- 9.3.11.1. Market Analysis, Forecast, and Y-O-Y Growth Rate, 2019 - 2032, (US$ Million)
- 9.3.11.2. Netherlands Market Size and Forecast, By Application, 2019 - 2032 (US$ Million)
- 9.3.11.3. Netherlands Market Size and Forecast, By End User, 2019 - 2032 (US$ Million)
- 9.3.12. Sweden
- 9.3.12.1. Market Analysis, Forecast, and Y-O-Y Growth Rate, 2019 - 2032, (US$ Million)
- 9.3.12.2. Sweden Market Size and Forecast, By Application, 2019 - 2032 (US$ Million)
- 9.3.12.3. Sweden Market Size and Forecast, By End User, 2019 - 2032 (US$ Million)
- 9.3.13. Poland
- 9.3.13.1. Market Analysis, Forecast, and Y-O-Y Growth Rate, 2019 - 2032, (US$ Million)
- 9.3.13.2. Poland Market Size and Forecast, By Application, 2019 - 2032 (US$ Million)
- 9.3.13.3. Poland Market Size and Forecast, By End User, 2019 - 2032 (US$ Million)
- 9.3.14. Rest of Europe
- 9.3.14.1. Overview
- 9.3.14.2. Market Analysis, Forecast, and Y-O-Y Growth Rate, 2019 - 2032, (US$ Million)
- 9.3.14.3. Rest of the Europe Market Size and Forecast, By Application, 2019 - 2032 (US$ Million)
- 9.3.14.4. Rest of the Europe Market Size and Forecast, By End User, 2019 - 2032 (US$ Million)
- 9.4. Asia Pacific (APAC)
- 9.4.1. Overview
- 9.4.2. Neural Processor Key Manufacturers in Asia Pacific
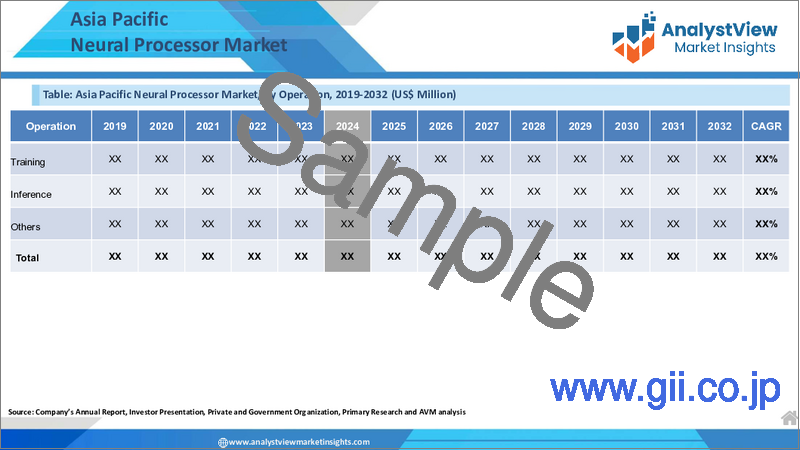
- 9.4.3. Asia Pacific Market Size and Forecast, By Country, 2019 - 2032 (US$ Million)
- 9.4.4. Asia Pacific Market Size and Forecast, By Application, 2019 - 2032 (US$ Million)
- 9.4.5. Asia Pacific Market Size and Forecast, By End User, 2019 - 2032 (US$ Million)
- 9.4.6. India
- 9.4.6.1. Overview
- 9.4.6.2. Market Analysis, Forecast, and Y-O-Y Growth Rate, 2019 - 2032, (US$ Million)
- 9.4.6.3. India Market Size and Forecast, By Application, 2019 - 2032 (US$ Million)
- 9.4.6.4. India Market Size and Forecast, By End User, 2019 - 2032 (US$ Million)
- 9.4.7. China
- 9.4.7.1. Overview
- 9.4.7.2. Market Analysis, Forecast, and Y-O-Y Growth Rate, 2019 - 2032, (US$ Million)
- 9.4.7.3. China Market Size and Forecast, By Application, 2019 - 2032 (US$ Million)
- 9.4.7.4. China Market Size and Forecast, By End User, 2019 - 2032 (US$ Million)
- 9.4.8. Japan
- 9.4.8.1. Overview
- 9.4.8.2. Market Analysis, Forecast, and Y-O-Y Growth Rate, 2019 - 2032, (US$ Million)
- 9.4.8.3. Japan Market Size and Forecast, By Application, 2019 - 2032 (US$ Million)
- 9.4.8.4. Japan Market Size and Forecast, By End User, 2019 - 2032 (US$ Million)
- 9.4.9. South Korea
- 9.4.9.1. Overview
- 9.4.9.2. Market Analysis, Forecast, and Y-O-Y Growth Rate, 2019 - 2032, (US$ Million)
- 9.4.9.3. South Korea Market Size and Forecast, By Application, 2019 - 2032 (US$ Million)
- 9.4.9.4. South Korea Market Size and Forecast, By End User, 2019 - 2032 (US$ Million)
- 9.4.10. Australia
- 9.4.10.1. Overview
- 9.4.10.2. Market Analysis, Forecast, and Y-O-Y Growth Rate, 2019 - 2032, (US$ Million)
- 9.4.10.3. Australia Market Size and Forecast, By Application, 2019 - 2032 (US$ Million)
- 9.4.10.4. Australia Market Size and Forecast, By End User, 2019 - 2032 (US$ Million)
- 9.4.11. Thailand
- 9.4.11.1. Overview
- 9.4.11.2. Market Analysis, Forecast, and Y-O-Y Growth Rate, 2019 - 2032, (US$ Million)
- 9.4.11.3. Thailand Market Size and Forecast, By Application, 2019 - 2032 (US$ Million)
- 9.4.11.4. Thailand Market Size and Forecast, By End User, 2019 - 2032 (US$ Million)
- 9.4.12. Indonesia
- 9.4.12.1. Overview
- 9.4.12.2. Market Analysis, Forecast, and Y-O-Y Growth Rate, 2019 - 2032, (US$ Million)
- 9.4.12.3. Indonesia Market Size and Forecast, By Application, 2019 - 2032 (US$ Million)
- 9.4.12.4. Indonesia Market Size and Forecast, By End User, 2019 - 2032 (US$ Million)
- 9.4.13. Philippines
- 9.4.13.1. Overview
- 9.4.13.2. Market Analysis, Forecast, and Y-O-Y Growth Rate, 2019 - 2032, (US$ Million)
- 9.4.13.3. Philippines Market Size and Forecast, By Application, 2019 - 2032 (US$ Million)
- 9.4.13.4. Philippines Market Size and Forecast, By End User, 2019 - 2032 (US$ Million)
- 9.4.14. Rest of APAC
- 9.4.14.1. Overview
- 9.4.14.2. Market Analysis, Forecast, and Y-O-Y Growth Rate, 2019 - 2032, (US$ Million)
- 9.4.14.3. Rest of APAC Market Size and Forecast, By Application, 2019 - 2032 (US$ Million)
- 9.4.14.4. Rest of APAC Market Size and Forecast, By End User, 2019 - 2032 (US$ Million)
- 9.5. Latin America
- 9.5.1. Overview
- 9.5.2. Neural Processor Key Manufacturers in Latin America
- 9.5.3. Latin America Market Size and Forecast, By Country, 2019 - 2032 (US$ Million)
- 9.5.4. Latin America Market Size and Forecast, By Application, 2019 - 2032 (US$ Million)
- 9.5.5. Latin America Market Size and Forecast, By End User, 2019 - 2032 (US$ Million)
- 9.5.6. Brazil
- 9.5.6.1. Overview
- 9.5.6.2. Market Analysis, Forecast, and Y-O-Y Growth Rate, 2019 - 2032, (US$ Million)
- 9.5.6.3. Brazil Market Size and Forecast, By Application, 2019 - 2032 (US$ Million)
- 9.5.6.4. Brazil Market Size and Forecast, By End User, 2019 - 2032 (US$ Million)
- 9.5.7. Mexico
- 9.5.7.1. Overview
- 9.5.7.2. Market Analysis, Forecast, and Y-O-Y Growth Rate, 2019 - 2032, (US$ Million)
- 9.5.7.3. Mexico Market Size and Forecast, By Application, 2019 - 2032 (US$ Million)
- 9.5.7.4. Mexico Market Size and Forecast, By End User, 2019 - 2032 (US$ Million)
- 9.5.8. Argentina
- 9.5.8.1. Overview
- 9.5.8.2. Market Analysis, Forecast, and Y-O-Y Growth Rate, 2019 - 2032, (US$ Million)
- 9.5.8.3. Argentina Market Size and Forecast, By Application, 2019 - 2032 (US$ Million)
- 9.5.8.4. Argentina Market Size and Forecast, By End User, 2019 - 2032 (US$ Million)
- 9.5.9. Colombia
- 9.5.9.1. Overview
- 9.5.9.2. Market Analysis, Forecast, and Y-O-Y Growth Rate, 2019 - 2032, (US$ Million)
- 9.5.9.3. Colombia Market Size and Forecast, By Application, 2019 - 2032 (US$ Million)
- 9.5.9.4. Colombia Market Size and Forecast, By End User, 2019 - 2032 (US$ Million)
- 9.5.10. Rest of LATAM
- 9.5.10.1. Overview
- 9.5.10.2. Market Analysis, Forecast, and Y-O-Y Growth Rate, 2019 - 2032, (US$ Million)
- 9.5.10.3. Rest of LATAM Market Size and Forecast, By Application, 2019 - 2032 (US$ Million)
- 9.5.10.4. Rest of LATAM Market Size and Forecast, By End User, 2019 - 2032 (US$ Million)
- 9.6. Middle East and Africa
- 9.6.1. Overview
- 9.6.2. Neural Processor Key Manufacturers in Middle East and Africa
- 9.6.3. Middle East and Africa Market Size and Forecast, By Country, 2019 - 2032 (US$ Million)
- 9.6.4. Middle East and Africa Market Size and Forecast, By Application, 2019 - 2032 (US$ Million)
- 9.6.5. Middle East and Africa Market Size and Forecast, By End User, 2019 - 2032 (US$ Million)
- 9.6.6. Saudi Arabia
- 9.6.6.1. Overview
- 9.6.6.2. Market Analysis, Forecast, and Y-O-Y Growth Rate, 2019 - 2032, (US$ Million)
- 9.6.6.3. Saudi Arabia Market Size and Forecast, By Application, 2019 - 2032 (US$ Million)
- 9.6.6.4. Saudi Arabia Market Size and Forecast, By End User, 2019 - 2032 (US$ Million)
- 9.6.7. United Arab Emirates
- 9.6.7.1. Overview
- 9.6.7.2. Market Analysis, Forecast, and Y-O-Y Growth Rate, 2019 - 2032, (US$ Million)
- 9.6.7.3. United Arab Emirates Market Size and Forecast, By Application, 2019 - 2032 (US$ Million)
- 9.6.7.4. United Arab Emirates Market Size and Forecast, By End User, 2019 - 2032 (US$ Million)
- 9.6.8. Israel
- 9.6.8.1. Overview
- 9.6.8.2. Market Analysis, Forecast, and Y-O-Y Growth Rate, 2019 - 2032, (US$ Million)
- 9.6.8.3. Israel Market Size and Forecast, By Application, 2019 - 2032 (US$ Million)
- 9.6.8.4. Israel Market Size and Forecast, By End User, 2019 - 2032 (US$ Million)
- 9.6.9. Turkey
- 9.6.9.1. Overview
- 9.6.9.2. Market Analysis, Forecast, and Y-O-Y Growth Rate, 2019 - 2032, (US$ Million)
- 9.6.9.3. Turkey Market Size and Forecast, By Application, 2019 - 2032 (US$ Million)
- 9.6.9.4. Turkey Market Size and Forecast, By End User, 2019 - 2032 (US$ Million)
- 9.6.10. Algeria
- 9.6.10.1. Overview
- 9.6.10.2. Market Analysis, Forecast, and Y-O-Y Growth Rate, 2019 - 2032, (US$ Million)
- 9.6.10.3. Algeria Market Size and Forecast, By Application, 2019 - 2032 (US$ Million)
- 9.6.10.4. Algeria Market Size and Forecast, By End User, 2019 - 2032 (US$ Million)
- 9.6.11. Egypt
- 9.6.11.1. Overview
- 9.6.11.2. Market Analysis, Forecast, and Y-O-Y Growth Rate, 2019 - 2032, (US$ Million)
- 9.6.11.3. Egypt Market Size and Forecast, By Application, 2019 - 2032 (US$ Million)
- 9.6.11.4. Egypt Market Size and Forecast, By End User, 2019 - 2032 (US$ Million)
- 9.6.12. Rest of MEA
- 9.6.12.1. Overview
- 9.6.12.2. Market Analysis, Forecast, and Y-O-Y Growth Rate, 2019 - 2032, (US$ Million)
- 9.6.12.3. Rest of MEA Market Size and Forecast, By Application, 2019 - 2032 (US$ Million)
- 9.6.12.4. Rest of MEA Market Size and Forecast, By End User, 2019 - 2032 (US$ Million)
10. Key Vendor Analysis- Neural Processor Industry
- 10.1. Competitive Dashboard
- 10.2. Company Profiles
- 10.2.1. Applied Brain Research, Inc.
- 10.2.2. BrainChip Holdings Ltd
- 10.2.3. Intel Corporation
- 10.2.4. Samsung Electronics Co., Ltd.
- 10.2.5. Hewlett Packard Enterprise Company
- 10.2.6. NVIDIA Corporation
- 10.2.7. Bit&Brain Technologies S.L
- 10.2.8. BrainCo, Inc.
- 10.2.9. General Vision Inc.
- 10.2.10. Aspinity, Inc.
- 10.2.11. Others
11. 360 Degree Analyst View
12. Appendix
- 12.1. Research Methodology
- 12.2. References
- 12.3. Abbreviations
- 12.4. Disclaimer
- 12.5. Contact Us

