|
|
市場調査レポート
商品コード
1320190
インテリジェントパイプラインピギングサービス市場:技術別、用途別、国別、地域別- 産業分析、市場規模、市場シェア、2023-2030年予測Intelligent Pipeline Pigging Services Market with COVID-19 Impact Analysis, By Technology, By Application, By Country, and By Region - Industry Analysis, Market Size, Market Share & Forecast from 2023-2030 |
||||||
|
|
|||||||
カスタマイズ可能
|
|||||||


| インテリジェントパイプラインピギングサービス市場:技術別、用途別、国別、地域別- 産業分析、市場規模、市場シェア、2023-2030年予測 |
|
出版日: 2023年07月01日
発行: AnalystView Market Insights
ページ情報: 英文 254 Pages
納期: 2~3営業日
|

- 全表示
- 概要
- 図表
- 目次
レポートハイライト
インテリジェントパイプラインピギングサービス市場規模は2022年に6億9,010万米ドルで、2023年から2030年にかけてCAGR 4.7%で拡大
インテリジェントパイプラインピギングサービス市場-市場力学:
石油・ガス需要の増加が市場成長を牽引
石油・ガス需要の増加が、予測期間中の市場成長を促進すると予測されます。例えば、IEAのIndia Energy Outlook 2021によると、インドの国内総生産(GDP)は2021年までに8兆6,000億米ドルに増加するため、一次エネルギー消費量は2021年までにほぼ2倍の11億2,300万トン(石油換算)になると予想されています。さらに、インド・ブランド・エクイティ財団によると、インドは非OECD諸国における石油消費量の増加に世界で最も貢献する国のひとつになると予想されています。4月から2023年1月までの期間に、インドは1億8,332万トンの石油製品を消費しました。22年度にインドで使用された石油製品の38.84%を占めた高速ディーゼルは、最も人気のある石油製品でした。このように、前述の事実が市場の成長を後押ししています。
インテリジェントパイプラインピギングサービス市場-主要洞察:
- 当社のリサーチアナリストが共有した分析によると、世界のインテリジェントパイプラインピギングサービス市場は、予測期間(2023-2030年)に約4.7%のCAGRで毎年成長すると推定されます。
- インテリジェントパイプラインピギングサービス産業は、世界中の一次エネルギー需要の増加により、著しい速度で成長すると予測されています。
- 技術ベースでは、キャリパーピグセグメントが予測期間中に市場を独占すると予想されます。
- 用途別では、金属損失/腐食検出セグメントが予測期間で最大の収益シェアを獲得すると予測されます。
- 地域別では、北米が予測期間で市場を独占すると予測される
インテリジェントパイプラインピギングサービス市場-セグメンテーション分析:
世界のインテリジェントパイプラインピギングサービス市場は、技術、用途、地域に基づいてセグメント化されます。
技術に基づいて、世界のインテリジェントパイプラインピギングサービス市場は、磁束漏れピグ、キャリパーピグと超音波ピグにセグメント化されます。予測期間中、キャリパーピグ部門が市場を独占すると予想されます。パイプラインの内径は、キャリパーピグを使用して正確に測定することができます。キャリパーピグには、直径の変化、楕円度、へこみや変形など、パイプラインの形状に関する徹底的な詳細が含まれます。パイプラインの完全性と流量能力を決定するために、この完全な検査能力は非常に重要です。さらに、キャリパーピグはパイプラインの完全性を維持するために不可欠です。オペレーターは、腐食、スケールの蓄積、物理的損傷などの異常を探すことで、より多くの検査やメンテナンスが必要な懸念箇所を検出することができます。壁の厚さを正確に測定するキャリパーピグの能力は、パイプラインの腐食や侵食の程度を判断するために特に有用です。したがって、キャリパーピグのこれらの用途は、市場の成長を促進すると予想されます。
用途に基づき、インテリジェントパイプラインピギングサービス産業は、亀裂&漏れ検出、金属損失/腐食検出、形状測定&曲がり検出、その他にセグメント化されます。金属損失/腐食検出セグメントは、予測期間中に最大の収益シェアを獲得すると予想されます。石油・ガスパイプラインシステムの機能に影響を与える主な問題の1つは腐食です。このため、大半のサプライヤーはパイプライン検査の第一段階としてピギングを採用しています。ベンダーは、石油・ガスパイプラインの腐食特定に役立つインテリジェントピグのようなツールを使用して検査するために、磁束漏洩(MFL)や超音波探傷(UT)など、さまざまな技術を使用しています。トランスデューサーを特徴とするこれらのマルチチャンネル機器は、正確なデータ収集とパイプ内壁のスキャンを可能にします。
インテリジェントパイプラインピギングサービス市場-地理的洞察:
地理的には、この市場は北米、ラテンアメリカ、欧州、アジア太平洋、中東アフリカの地域に広がっています。これらの地域は、ビジネスをもたらす国ごとにさらに分割されます。北米は、予測期間にわたって市場を独占すると予想されます。北米ではインテリジェントピギング技術が急速に発展しています。インテリジェントピギング装置の能力を向上させるための研究開発に従事する企業は、この地域を技術革新の中心地にしています。これらの開発は、世界中から顧客を引き寄せ、北米がビジネスを支配するのに役立ちます。さらに北米では、多くのパイプラインが数十年にわたって使用されており、老朽化のために定期的な検査と保守が必要です。これらのパイプラインの状態を評価し、起こりうる問題を発見し、保守作業の優先順位を設定する効率的な方法は、インテリジェント・ピギングです。例えば、2023年2月、数日前に漏水が発見された後、キンダー・モルガンはパイプラインの修理作業が終了し、操業を再開したと発表しました。問題のパイプラインは、ネバダ州南部の貯蔵施設に無鉛ガソリンとディーゼルを輸送しています。パイプラインの起点はカリフォルニア州です。それによって、この地域の市場成長を牽引しています。
インテリジェントパイプラインピギングサービス市場-競合情勢:
サービス内容を多様化し市場シェアを拡大するため、この分野の大手企業は有機的・無機的な開発戦術を実施しています。主な市場プレーヤーは、SGS SA、Decon International Technologies、Pigtek Ltd、Romstar Group、Enduro Pipeline Services Inc.、A.Hak Industrial Services B.V、PipeSurvey International、NDT Global Services Ltd.、Rosen Australia Pty.Ltd.、Penspen Limitedです。
最近の動き
2023年1月、CDIの画期的な装置であるQubeがパイプラインのピグ追跡戦略に革命を起こしました。Qubeは、石油・ガスセクターのために特別に作られた、前衛的で管理しやすく、耐久性のある地上監視(AGM)装置です。その主な仕事は、パイプラインのピグがパイプを通過するのを探すことです。Qubeの優れた機能には、GPSと磁気データセンサーにより、パイプラインピグに取り付けられた最大8つの周波数の磁気トランスミッターを認識する能力があります。また、MFL磁化器も認識できます。Qubeは、その工業用グレードの構造により、厳しい条件下でも信頼できる性能を保証します。この画期的な装置によって、パイプラインピグ追跡活動の有効性が再定義され、改善されるでしょう。
研究の主な特徴
- この調査レポートは、インテリジェントパイプラインピギングサービス市場の市場規模、複合年間成長率(CAGR %)、2022年を基準年とした推定・予測(2023-2030年)を提供しています。
- この調査レポートは、インテリジェントパイプラインピギングサービス市場に関する最新動向の洞察を顧客に提供します。
- 調査レポートは、さまざまなセグメント/国にわたる潜在的な成長機会を解明し、インテリジェントパイプラインピギングサービス市場の魅力的な投資提案マトリクスを説明します。
- レポート全体では、新規投資機会、既存企業が直面する課題、インテリジェントパイプラインピギングサービス市場で持続するための成長要因を特定します。
- インテリジェント式パイプラインピギングサービス市場規模、予測、CAGR、市場力学へのCOVID-19の影響は、調査範囲の下で詳細に議論されています。COVID後のインテリジェントパイプラインピギングサービス市場に関する詳細な洞察もカバーします。
- 本レポートのユーザーにインテリジェントパイプラインピギングサービス市場の包括的な見解を提供するために、インテリジェントパイプラインピギングサービス市場の競合情勢と主要イノベーター分析も含めています。
- この調査では、成長見通しマッピング分析を網羅し、市場規模、成長率、魅力度に基づいてすべての業界セグメントをベンチマークしています。
- 主要市場参入企業の詳細な企業プロファイルを掲載しており、インテリジェントパイプラインピギングサービス市場で活動する企業の財務情報や戦略的イニシアティブを理解するのに役立ちます。
- さらに、本レポートでは、世界レベルだけでなく、地域レベルで市場に関与する主要参入企業の重要な買収&合併、提携&ジョイントベンチャー、新発売、研究開発、地域展開についても明らかにしています。
- この調査レポートは、主にサプライヤー、投資家、新規参入者、流通業者、金融アナリストなど、この業界の様々な利害関係者を対象としています。
目次
第1章 インテリジェントパイプラインピギングサービス市場概要
- 調査範囲
- 市場推定年数
第2章 エグゼクティブサマリー
- 市場内訳
- 競合考察
第3章 インテリジェントパイプラインピギングサービスの主要な市場動向
- インテリジェントパイプラインピギングサービス市場促進要因
- インテリジェントパイプラインピギングサービス市場抑制要因
- インテリジェントパイプラインピギングサービスの市場機会
- インテリジェントパイプラインピギングサービス市場の将来の動向
第4章 インテリジェントパイプラインピギングサービス業界の調査
- PEST分析
- ポーターのファイブフォース分析
- 成長見通しのマッピング
- 規制枠組みの分析
第5章 インテリジェントパイプラインピギングサービス市場:COVID-19の影響分析
- 新型コロナウイルス感染症以前の影響分析
- 新型コロナウイルス感染症後の影響分析
第6章 インテリジェントパイプラインピギングサービス市場情勢
- インテリジェントパイプラインピギングサービス市場シェア分析、2022年
- 主要メーカー別の内訳データ
- 確立された企業の分析
- 新興企業の分析
第7章 インテリジェントパイプラインピギングサービス市場-技術別
- 概要
- 技術別セグメントシェア分析
- 磁束漏れピギング
- キャリパーピギング
- 超音波ピギング
第8章 インテリジェントパイプラインピギングサービス市場- 用途別
- 概要
- 用途別のセグメントシェア分析
- 亀裂と漏れの検出
- 減肉/腐食の検出
- 形状測定と曲げ検出
- その他
第9章 インテリジェントパイプラインピギングサービス市場-地域別
- イントロダクション
- 北米
- 概要
- インテリジェントパイプラインピギングサービス北米の主要メーカー
- 米国
- カナダ
- 欧州
- 概要
- インテリジェントパイプラインピギングサービス欧州の主要メーカー
- ドイツ
- イタリア
- 英国
- フランス
- ロシア
- オランダ
- スウェーデン
- ポーランド
- その他
- アジア太平洋(APAC)
- 概要
- インテリジェントパイプラインピギングサービスアジア太平洋地域の主要メーカー
- インド
- 中国
- 日本
- 韓国
- オーストラリア
- タイ
- インドネシア
- フィリピン
- その他
- ラテンアメリカ
- 概要
- インテリジェントパイプラインピギングサービスラテンアメリカの主要メーカー
- ブラジル
- メキシコ
- アルゼンチン
- コロンビア
- その他
- 中東とアフリカ
- 概要
- インテリジェントパイプラインピギングサービス中東およびアフリカの主要メーカー
- サウジアラビア
- アラブ首長国連邦
- イスラエル
- トルコ
- アルジェリア
- エジプト
- その他
第10章 主要ベンダー分析- インテリジェントパイプラインピギングサービス業界
- 競合ダッシュボード
- 企業プロファイル
- SGS SA
- Decon International Technologies
- Pigtek Ltd
- Romstar Group
- Enduro Pipeline Services Inc.
- A.Hak Industrial Services BV
- PipeSurvey International
- NDT Global Services Ltd.
- Rosen Australia Pty. Ltd.
- Penspen Limited
第11章 アナリストの全方位展望
List of Tables
- TABLE List of data sources
- TABLE Market drivers; Impact Analysis
- TABLE Market restraints; Impact Analysis
- TABLE Intelligent Pipeline Pigging Services Market: Technology Snapshot (2022)
- TABLE Segment Dashboard; Definition and Scope, by Technology
- TABLE Global Intelligent Pipeline Pigging Services Market, by Technology 2018-2030 (USD Million)
- TABLE Intelligent Pipeline Pigging Services Market: Application Snapshot (2022)
- TABLE Segment Dashboard; Definition and Scope, by Application
- TABLE Global Intelligent Pipeline Pigging Services Market, by Application 2018-2030 (USD Million)
- TABLE Intelligent Pipeline Pigging Services Market: Regional snapshot (2022)
- TABLE Segment Dashboard; Definition and Scope, by Region
- TABLE Global Intelligent Pipeline Pigging Services Market, by Region 2018-2030 (USD Million)
- TABLE North America Intelligent Pipeline Pigging Services Market, by Country, 2018-2030 (USD Million)
- TABLE North America Intelligent Pipeline Pigging Services Market, by Technology, 2018-2030 (USD Million)
- TABLE North America Intelligent Pipeline Pigging Services Market, by Application, 2018-2030 (USD Million)
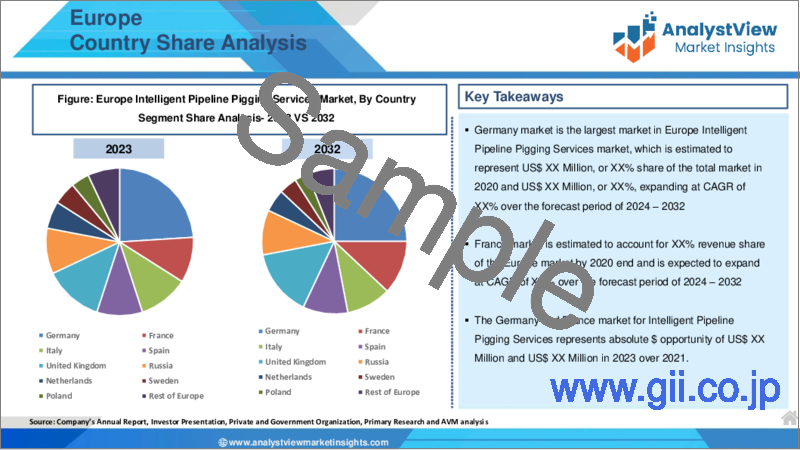
- TABLE Europe Intelligent Pipeline Pigging Services Market, by Country, 2018-2030 (USD Million)
- TABLE Europe Intelligent Pipeline Pigging Services Market, by Technology, 2018-2030 (USD Million)
- TABLE Europe Intelligent Pipeline Pigging Services Market, by Application, 2018-2030 (USD Million)
- TABLE Asia Pacific Intelligent Pipeline Pigging Services Market, by Country, 2018-2030 (USD Million)
- TABLE Asia Pacific Intelligent Pipeline Pigging Services Market, by Technology, 2018-2030 (USD Million)
- TABLE Asia Pacific Intelligent Pipeline Pigging Services Market, by Application, 2018-2030 (USD Million)
- TABLE Latin America Intelligent Pipeline Pigging Services Market, by Country, 2018-2030 (USD Million)
- TABLE Latin America Intelligent Pipeline Pigging Services Market, by Technology, 2018-2030 (USD Million)
- TABLE Latin America Intelligent Pipeline Pigging Services Market, by Application, 2018-2030 (USD Million)
- TABLE Middle East and Africa Intelligent Pipeline Pigging Services Market, by Country, 2018-2030 (USD Million)
- TABLE Middle East and Africa Intelligent Pipeline Pigging Services Market, by Technology, 2018-2030 (USD Million)
- TABLE Middle East and Africa Intelligent Pipeline Pigging Services Market, by Application, 2018-2030 (USD Million)
REPORT HIGHLIGHT
Intelligent Pipeline Pigging Services Market size was valued at USD 690.1 Million in 2022, expanding at a CAGR of 4.7% from 2023 to 2030.
Pipeline pigging is the term for the regular cleaning, maintenance, and inspection of pipelines using pigging equipment or machinery, more precisely Pipeline Integrity Gauges, or "PIGs." PIGs are moved through the pipeline by product flow and differential pressure.
Intelligent Pipeline Pigging Services Market- Market Dynamics:
Increasing demand for oil & gas drives the market growth
The increasing demand for oil & gas is expected to propel the growth of the market over the forecast period. For instance, primary energy consumption is anticipated to nearly double to 1,123 million tonnes of oil equivalent by 2021, according to the IEA's India Energy Outlook 2021, as India's gross domestic product (GDP) rises to US$8.6 trillion by that year. Moreover, according to the India Brand Equity Foundation, India is anticipated to provide one of the biggest worldwide contributions to the increase in non-OECD petroleum consumption. In the period from April to January 2023, India consumed 183.32 MMT of petroleum products. High-Speed Diesel, which made up 38.84% of all petroleum products used in FY22 in India, was the most popular oil product. Thus, the aforementioned facts propel the market growth.
Intelligent Pipeline Pigging Services Market- Key Insights:
- As per the analysis shared by our research analyst, the global Intelligent Pipeline Pigging Services market is estimated to grow annually at a CAGR of around 4.7% over the forecast period (2023-2030)
- The Intelligent Pipeline Pigging Services industry is projected to grow at a significant rate owing to the growing demand for primary energy across the globe
- Based on the technology, the caliper pigs' segment is expected to dominate the market over the forecast period
- Based on the application, the metal loss/corrosion detection segment is expected to capture the largest revenue share over the projected period
- Based on region, North America is expected to dominate the market over the forecast period
Intelligent Pipeline Pigging Services Market- Segmentation Analysis:
The Global Intelligent Pipeline Pigging Services Market is segmented based on Technology, Application, and Region.
Based on technology, the global Intelligent Pipeline Pigging Services market is segmented into magnetic flux leakage pigs, caliper pigs and ultrasonic pigs. The caliper pigs segment is expected to dominate the market over the forecast period. Pipeline interior diameter may be precisely measured using caliper pigs. They include thorough details regarding the geometry of the pipeline, such as diameter changes, ovality, and dents or deformations. For determining the integrity and flow capacity of pipelines, this complete inspection capability is crucial. In addition, caliper pigging is essential for maintaining pipeline integrity. Operators can detect areas of concern that need more inspection or maintenance by looking for abnormalities like corrosion, scale accumulation, or physical damage. Caliper pigs' capacity to precisely measure wall thickness is especially useful for determining the degree of corrosion or erosion in pipelines. Thus, these applications of caliper pigs are expected to propel market growth.
Based on the application, the Intelligent Pipeline Pigging Services industry is segmented into crack & leakage detection, metal loss/corrosion detection, geometry measurement & bend detection and others. The metal loss/corrosion detection segment is expected to capture the largest revenue share over the projected period. One of the main problems affecting the functionality of the oil and gas pipeline system is corrosion. Because of this, the majority of suppliers employ pigging as a first step in pipeline inspection. Vendors use a variety of technologies, including Magnetic Flux Leakage (MFL) and Ultrasonic Testing (UT), to inspect with the use of tools like intelligent pigs that help with corrosion identification for oil and gas pipelines. These multi-channel instruments, which feature transducers, enable accurate data collecting and internal pipe wall scanning.
Intelligent Pipeline Pigging Services Market- Geographical Insights:
Geographically, this market is widespread in the regions of North America, Latin America, Europe, Asia Pacific, and the Middle East and Africa. These regions are further divided as per the nations bringing business. North America is expected to dominate the market over the forecast period. Intelligent pigging technology is developing quickly in North America. Companies engaging in R&D to improve the capabilities of intelligent pigging devices have made the region a centre for innovation. These developments draw clients from all around the world and help North America dominate the business. Additionally, in North America, a large number of pipelines have been in use for several decades and need to be regularly inspected and maintained due to age. An efficient way to evaluate these pipelines' conditions, spot possible problems, and set priorities for maintenance tasks is through intelligent pigging. For instance, in February 2023, following the discovery of a leak a few days earlier, Kinder Morgan announced that repair work on a pipeline had been finished and it had resumed operations. The pipeline in question transports unleaded gasoline and diesel to storage facilities in southern Nevada. It originates in California. Thereby, driving the market growth in the region.
Intelligent Pipeline Pigging Services Market- Competitive Landscape:
To diversify their service offerings and increase market share, leading firms in the sector are implementing a range of organic and inorganic development tactics. The key market players are SGS SA, Decon International Technologies, Pigtek Ltd, Romstar Group, Enduro Pipeline Services Inc., A.Hak Industrial Services B.V, PipeSurvey International, NDT Global Services Ltd., Rosen Australia Pty. Ltd. and Penspen Limited.
Recent Developments:
In January 2023, the Qube, a ground-breaking device from CDI, revolutionized the pipeline pig tracking strategy. The Qube is an avant-garde, manageable, and durable above-ground monitoring (AGM) device created especially for the oil and gas sector. Its main job is to look for pipeline pigs as they go through the pipes. The Qube's impressive features include the ability to recognize up to eight frequencies of magnetic transmitters attached to the pipeline pigs due to its GPS and magnetic data sensors. It can also recognize MFL magnetizers. The Qube guarantees dependable performance in tough conditions thanks to its industrial-grade build. The effectiveness of pipeline pig tracking activities will be redefined and improved by this ground-breaking device.
Key features of the study:
- This proposed research study on Intelligent Pipeline Pigging Services market provides market size (US$ million), compound annual growth rate (CAGR %) and forecast estimation (2023-2030), considering 2022 as the base year
- The report provides the client the latest up-to-date and trending insights about the Intelligent Pipeline Pigging Services market.
- The research report elucidates potential growth opportunities across different segments/countries and explains attractive investment proposition matrix for Intelligent Pipeline Pigging Services market
- The overall report identifies new investment opportunities, challenges faced by established players, and growth factors to sustain in the Intelligent Pipeline Pigging Services market
- Impact of COVID-19 on Intelligent Pipeline Pigging Services market size, forecast, CAGR, and market dynamics are discussed in detail under the research scope. Detailed insight on Intelligent Pipeline Pigging Services market post-COVID will also be covered.
- In order to give the users of this report a comprehensive view on the Intelligent Pipeline Pigging Services market, we have also included competitive landscape and key innovator analysis for the Intelligent Pipeline Pigging Services market.
- The study encompasses a growth prospect mapping analysis, wherein all the industry segments are benchmarked based on their market size, growth rate and attractiveness.
- The report offers detailed company profiling featuring major market participants which will help users to understand their financial information and strategic initiatives of players operating in the Intelligent Pipeline Pigging Services market.
- In addition, the report also unveils the important acquisitions & mergers, collaborations & joint ventures, new launch, research & development, regional expansion of major participants involved in the market on global as well as regional level.
- The global Intelligent Pipeline Pigging Services market report primarily caters to various stakeholders in this industry including suppliers, investors, new entrants, distributors, and financial analysts
SCOPE OF THE REPORT
The scope of this report covers the market by its major segments, which include as follows:
GLOBAL INTELLIGENT PIPELINE PIGGING SERVICES MARKET KEY PLAYERS
- SGS SA
- Decon International Technologies
- Pigtek Ltd
- Romstar Group
- Enduro Pipeline Services Inc.
- A.Hak Industrial Services B.V
- PipeSurvey International
- NDT Global Services Ltd.
- Rosen Australia Pty. Ltd.
- Penspen Limited
GLOBAL INTELLIGENT PIPELINE PIGGING SERVICES MARKET, BY TECHNOLOGY
- Magnetic Flux Leakage Pigs
- Caliper Pigs
- Ultrasonic Pigs
GLOBAL INTELLIGENT PIPELINE PIGGING SERVICES MARKET, BY APPLICATION
- Crack & Leakage Detection
- Metal Loss/Corrosion Detection
- Geometry Measurement & Bend Detection
- Others
GLOBAL INTELLIGENT PIPELINE PIGGING SERVICES MARKET, BY REGION
- North America
- The U.S.
- Canada
- Europe
- Germany
- France
- Italy
- Spain
- United Kingdom
- Russia
- Netherlands
- Sweden
- Poland
- Rest of Europe
- Asia Pacific
- India
- China
- South Korea
- Japan
- Australia
- Thailand
- Indonesia
- Philippines
- Rest of APAC
- Latin America
- Brazil
- Mexico
- Argentina
- Colombia
- Rest of LATAM
- The Middle East and Africa
- Saudi Arabia
- United Arab Emirates
- Israel
- Turkey
- Algeria
- Egypt
- Rest of MEA
Table of Contents
1. Intelligent Pipeline Pigging Services Market Overview
- 1.1. Study Scope
- 1.2. Market Estimation Years
2. Executive Summary
- 2.1. Market Snippet
- 2.1.1. Intelligent Pipeline Pigging Services Market Snippet by Technology
- 2.1.2. Intelligent Pipeline Pigging Services Market Snippet by Application
- 2.1.3. Intelligent Pipeline Pigging Services Market Snippet by Country
- 2.1.4. Intelligent Pipeline Pigging Services Market Snippet by Region
- 2.2. Competitive Insights
3. Intelligent Pipeline Pigging Services Key Market Trends
- 3.1. Intelligent Pipeline Pigging Services Market Drivers
- 3.1.1. Impact Analysis of Market Drivers
- 3.2. Intelligent Pipeline Pigging Services Market Restraints
- 3.2.1. Impact Analysis of Market Restraints
- 3.3. Intelligent Pipeline Pigging Services Market Opportunities
- 3.4. Intelligent Pipeline Pigging Services Market Future Trends
4. Intelligent Pipeline Pigging Services Industry Study
- 4.1. PEST Analysis
- 4.2. Porter's Five Forces Analysis
- 4.3. Growth Prospect Mapping
- 4.4. Regulatory Framework Analysis
5. Intelligent Pipeline Pigging Services Market: COVID-19 Impact Analysis
- 5.1. Pre-COVID-19 Impact Analysis
- 5.2. Post-COVID-19 Impact Analysis
- 5.2.1. Top Performing Segments
- 5.2.2. Marginal Growth Segments
- 5.2.3. Top Looser Segments
- 5.2.4. Marginal Loss Segments
6. Intelligent Pipeline Pigging Services Market Landscape
- 6.1. Intelligent Pipeline Pigging Services Market Share Analysis, 2022
- 6.2. Breakdown Data, by Key Manufacturer
- 6.2.1. Established Players' Analysis
- 6.2.2. Emerging Players' Analysis
7. Intelligent Pipeline Pigging Services Market - By Technology
- 7.1. Overview
- 7.1.1. Segment Share Analysis, By Technology, 2022 & 2030 (%)
- 7.1.2. Magnetic Flux Leakage Pigs
- 7.1.3. Caliper Pigs
- 7.1.4. Ultrasonic Pigs
8. Intelligent Pipeline Pigging Services Market - By Application
- 8.1. Overview
- 8.1.1. Segment Share Analysis, By Application, 2022 & 2030 (%)
- 8.1.2. Crack & Leakage Detection
- 8.1.3. Metal Loss/Corrosion Detection
- 8.1.4. Geometry Measurement & Bend Detection
- 8.1.5. Others
9. Intelligent Pipeline Pigging Services Market- By Geography
- 9.1. Introduction
- 9.1.1. Segment Share Analysis, By Geography, 2022 & 2030 (%)
- 9.2. North America
- 9.2.1. Overview
- 9.2.2. Intelligent Pipeline Pigging Services Key Manufacturers in North America
- 9.2.3. North America Market Size and Forecast, By Country, 2018 - 2030 (US$ Million)
- 9.2.4. North America Market Size and Forecast, By Technology, 2018 - 2030 (US$ Million)
- 9.2.5. North America Market Size and Forecast, By Application, 2018 - 2030 (US$ Million)
- 9.2.6. U.S.
- 9.2.6.1. Overview
- 9.2.6.2. Market Analysis, Forecast, and Y-O-Y Growth Rate, 2018 - 2030, (US$ Million)
- 9.2.6.3. U.S. Market Size and Forecast, By Technology, 2018 - 2030 (US$ Million)
- 9.2.6.4. U.S. Market Size and Forecast, By Application, 2018 - 2030 (US$ Million)
- 9.2.7. Canada
- 9.2.7.1. Overview
- 9.2.7.2. Market Analysis, Forecast, and Y-O-Y Growth Rate, 2018 - 2030, (US$ Million)
- 9.2.7.3. Canada Market Size and Forecast, By Technology, 2018 - 2030 (US$ Million)
- 9.2.7.4. Canada Market Size and Forecast, By Application, 2018 - 2030 (US$ Million)
- 9.3. Europe
- 9.3.1. Overview
- 9.3.2. Intelligent Pipeline Pigging Services Key Manufacturers in Europe
- 9.3.3. Europe Market Size and Forecast, By Country, 2018 - 2030 (US$ Million)
- 9.3.4. Europe Market Size and Forecast, By Technology, 2018 - 2030 (US$ Million)
- 9.3.5. Europe Market Size and Forecast, By Application, 2018 - 2030 (US$ Million)
- 9.3.6. Germany
- 9.3.6.1. Overview
- 9.3.6.2. Market Analysis, Forecast, and Y-O-Y Growth Rate, 2018 - 2030, (US$ Million)
- 9.3.6.3. Germany Market Size and Forecast, By Technology, 2018 - 2030 (US$ Million)
- 9.3.6.4. Germany Market Size and Forecast, By Application, 2018 - 2030 (US$ Million)
- 9.3.7. Italy
- 9.3.7.1. Overview
- 9.3.7.2. Market Analysis, Forecast, and Y-O-Y Growth Rate, 2018 - 2030, (US$ Million)
- 9.3.7.3. Italy Market Size and Forecast, By Technology, 2018 - 2030 (US$ Million)
- 9.3.7.4. Italy Market Size and Forecast, By Application, 2018 - 2030 (US$ Million)
- 9.3.8. United Kingdom
- 9.3.8.1. Overview
- 9.3.8.2. Market Analysis, Forecast, and Y-O-Y Growth Rate, 2018 - 2030, (US$ Million)
- 9.3.8.3. United Kingdom Market Size and Forecast, By Technology, 2018 - 2030 (US$ Million)
- 9.3.8.4. United Kingdom Market Size and Forecast, By Application, 2018 - 2030 (US$ Million)
- 9.3.9. France
- 9.3.9.1. Overview
- 9.3.9.2. Market Analysis, Forecast, and Y-O-Y Growth Rate, 2018 - 2030, (US$ Million)
- 9.3.9.3. France Market Size and Forecast, By Technology, 2018 - 2030 (US$ Million)
- 9.3.9.4. France Market Size and Forecast, By Application, 2018 - 2030 (US$ Million)
- 9.3.10. Russia
- 9.3.10.1. Market Analysis, Forecast, and Y-O-Y Growth Rate, 2018 - 2030, (US$ Million)
- 9.3.10.2. Russia Market Size and Forecast, By Technology, 2018 - 2030 (US$ Million)
- 9.3.10.3. Russia Market Size and Forecast, By Application, 2018 - 2030 (US$ Million)
- 9.3.11. Netherlands
- 9.3.11.1. Market Analysis, Forecast, and Y-O-Y Growth Rate, 2018 - 2030, (US$ Million)
- 9.3.11.2. Netherlands Market Size and Forecast, By Technology, 2018 - 2030 (US$ Million)
- 9.3.11.3. Netherlands Market Size and Forecast, By Application, 2018 - 2030 (US$ Million)
- 9.3.12. Sweden
- 9.3.12.1. Market Analysis, Forecast, and Y-O-Y Growth Rate, 2018 - 2030, (US$ Million)
- 9.3.12.2. Sweden Market Size and Forecast, By Technology, 2018 - 2030 (US$ Million)
- 9.3.12.3. Sweden Market Size and Forecast, By Application, 2018 - 2030 (US$ Million)
- 9.3.13. Poland
- 9.3.13.1. Market Analysis, Forecast, and Y-O-Y Growth Rate, 2018 - 2030, (US$ Million)
- 9.3.13.2. Poland Market Size and Forecast, By Technology, 2018 - 2030 (US$ Million)
- 9.3.13.3. Poland Market Size and Forecast, By Application, 2018 - 2030 (US$ Million)
- 9.3.14. Rest of Europe
- 9.3.14.1. Overview
- 9.3.14.2. Market Analysis, Forecast, and Y-O-Y Growth Rate, 2018 - 2030, (US$ Million)
- 9.3.14.3. Rest of the Europe Market Size and Forecast, By Technology, 2018 - 2030 (US$ Million)
- 9.3.14.4. Rest of the Europe Market Size and Forecast, By Application, 2018 - 2030 (US$ Million)
- 9.4. Asia Pacific (APAC)
- 9.4.1. Overview
- 9.4.2. Intelligent Pipeline Pigging Services Key Manufacturers in Asia Pacific
- 9.4.3. Asia Pacific Market Size and Forecast, By Country, 2018 - 2030 (US$ Million)
- 9.4.4. Asia Pacific Market Size and Forecast, By Technology, 2018 - 2030 (US$ Million)
- 9.4.5. Asia Pacific Market Size and Forecast, By Application, 2018 - 2030 (US$ Million)
- 9.4.6. India
- 9.4.6.1. Overview
- 9.4.6.2. Market Analysis, Forecast, and Y-O-Y Growth Rate, 2018 - 2030, (US$ Million)
- 9.4.6.3. India Market Size and Forecast, By Technology, 2018 - 2030 (US$ Million)
- 9.4.6.4. India Market Size and Forecast, By Application, 2018 - 2030 (US$ Million)
- 9.4.7. China
- 9.4.7.1. Overview
- 9.4.7.2. Market Analysis, Forecast, and Y-O-Y Growth Rate, 2018 - 2030, (US$ Million)
- 9.4.7.3. China Market Size and Forecast, By Technology, 2018 - 2030 (US$ Million)
- 9.4.7.4. China Market Size and Forecast, By Application, 2018 - 2030 (US$ Million)
- 9.4.8. Japan
- 9.4.8.1. Overview
- 9.4.8.2. Market Analysis, Forecast, and Y-O-Y Growth Rate, 2018 - 2030, (US$ Million)
- 9.4.8.3. Japan Market Size and Forecast, By Technology, 2018 - 2030 (US$ Million)
- 9.4.8.4. Japan Market Size and Forecast, By Application, 2018 - 2030 (US$ Million)
- 9.4.9. South Korea
- 9.4.9.1. Overview
- 9.4.9.2. Market Analysis, Forecast, and Y-O-Y Growth Rate, 2018 - 2030, (US$ Million)
- 9.4.9.3. South Korea Market Size and Forecast, By Technology, 2018 - 2030 (US$ Million)
- 9.4.9.4. South Korea Market Size and Forecast, By Application, 2018 - 2030 (US$ Million)
- 9.4.10. Australia
- 9.4.10.1. Overview
- 9.4.10.2. Market Analysis, Forecast, and Y-O-Y Growth Rate, 2018 - 2030, (US$ Million)
- 9.4.10.3. Australia Market Size and Forecast, By Technology, 2018 - 2030 (US$ Million)
- 9.4.10.4. Australia Market Size and Forecast, By Application, 2018 - 2030 (US$ Million)
- 9.4.11. Thailand
- 9.4.11.1. Overview
- 9.4.11.2. Market Analysis, Forecast, and Y-O-Y Growth Rate, 2018 - 2030, (US$ Million)
- 9.4.11.3. Thailand Market Size and Forecast, By Technology, 2018 - 2030 (US$ Million)
- 9.4.11.4. Thailand Market Size and Forecast, By Application, 2018 - 2030 (US$ Million)
- 9.4.12. Indonesia
- 9.4.12.1. Overview
- 9.4.12.2. Market Analysis, Forecast, and Y-O-Y Growth Rate, 2018 - 2030, (US$ Million)
- 9.4.12.3. Indonesia Market Size and Forecast, By Technology, 2018 - 2030 (US$ Million)
- 9.4.12.4. Indonesia Market Size and Forecast, By Application, 2018 - 2030 (US$ Million)
- 9.4.13. Philippines
- 9.4.13.1. Overview
- 9.4.13.2. Market Analysis, Forecast, and Y-O-Y Growth Rate, 2018 - 2030, (US$ Million)
- 9.4.13.3. Philippines Market Size and Forecast, By Technology, 2018 - 2030 (US$ Million)
- 9.4.13.4. Philippines Market Size and Forecast, By Application, 2018 - 2030 (US$ Million)
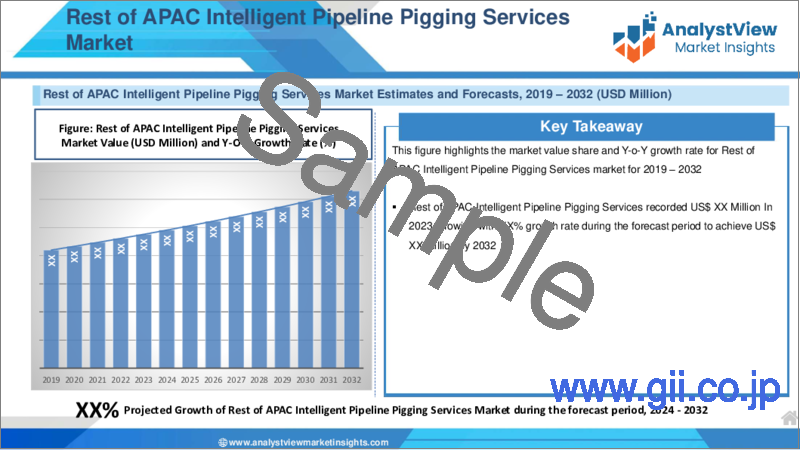
- 9.4.14. Rest of APAC
- 9.4.14.1. Overview
- 9.4.14.2. Market Analysis, Forecast, and Y-O-Y Growth Rate, 2018 - 2030, (US$ Million)
- 9.4.14.3. Rest of APAC Market Size and Forecast, By Technology, 2018 - 2030 (US$ Million)
- 9.4.14.4. Rest of APAC Market Size and Forecast, By Application, 2018 - 2030 (US$ Million)
- 9.5. Latin America
- 9.5.1. Overview
- 9.5.2. Intelligent Pipeline Pigging Services Key Manufacturers in Latin America
- 9.5.3. Latin America Market Size and Forecast, By Country, 2018 - 2030 (US$ Million)
- 9.5.4. Latin America Market Size and Forecast, By Technology, 2018 - 2030 (US$ Million)
- 9.5.5. Latin America Market Size and Forecast, By Application, 2018 - 2030 (US$ Million)
- 9.5.6. Brazil
- 9.5.6.1. Overview
- 9.5.6.2. Market Analysis, Forecast, and Y-O-Y Growth Rate, 2018 - 2030, (US$ Million)
- 9.5.6.3. Brazil Market Size and Forecast, By Technology, 2018 - 2030 (US$ Million)
- 9.5.6.4. Brazil Market Size and Forecast, By Application, 2018 - 2030 (US$ Million)
- 9.5.7. Mexico
- 9.5.7.1. Overview
- 9.5.7.2. Market Analysis, Forecast, and Y-O-Y Growth Rate, 2018 - 2030, (US$ Million)
- 9.5.7.3. Mexico Market Size and Forecast, By Technology, 2018 - 2030 (US$ Million)
- 9.5.7.4. Mexico Market Size and Forecast, By Application, 2018 - 2030 (US$ Million)
- 9.5.8. Argentina
- 9.5.8.1. Overview
- 9.5.8.2. Market Analysis, Forecast, and Y-O-Y Growth Rate, 2018 - 2030, (US$ Million)
- 9.5.8.3. Argentina Market Size and Forecast, By Technology, 2018 - 2030 (US$ Million)
- 9.5.8.4. Argentina Market Size and Forecast, By Application, 2018 - 2030 (US$ Million)
- 9.5.9. Colombia
- 9.5.9.1. Overview
- 9.5.9.2. Market Analysis, Forecast, and Y-O-Y Growth Rate, 2018 - 2030, (US$ Million)
- 9.5.9.3. Colombia Market Size and Forecast, By Technology, 2018 - 2030 (US$ Million)
- 9.5.9.4. Colombia Market Size and Forecast, By Application, 2018 - 2030 (US$ Million)
- 9.5.10. Rest of LATAM
- 9.5.10.1. Overview
- 9.5.10.2. Market Analysis, Forecast, and Y-O-Y Growth Rate, 2018 - 2030, (US$ Million)
- 9.5.10.3. Rest of LATAM Market Size and Forecast, By Technology, 2018 - 2030 (US$ Million)
- 9.5.10.4. Rest of LATAM Market Size and Forecast, By Application, 2018 - 2030 (US$ Million)
- 9.6. Middle East and Africa
- 9.6.1. Overview
- 9.6.2. Intelligent Pipeline Pigging Services Key Manufacturers in Middle East and Africa
- 9.6.3. Middle East and Africa Market Size and Forecast, By Country, 2018 - 2030 (US$ Million)
- 9.6.4. Middle East and Africa Market Size and Forecast, By Technology, 2018 - 2030 (US$ Million)
- 9.6.5. Middle East and Africa Market Size and Forecast, By Application, 2018 - 2030 (US$ Million)
- 9.6.6. Saudi Arabia
- 9.6.6.1. Overview
- 9.6.6.2. Market Analysis, Forecast, and Y-O-Y Growth Rate, 2018 - 2030, (US$ Million)
- 9.6.6.3. Saudi Arabia Market Size and Forecast, By Technology, 2018 - 2030 (US$ Million)
- 9.6.6.4. Saudi Arabia Market Size and Forecast, By Application, 2018 - 2030 (US$ Million)
- 9.6.7. United Arab Emirates
- 9.6.7.1. Overview
- 9.6.7.2. Market Analysis, Forecast, and Y-O-Y Growth Rate, 2018 - 2030, (US$ Million)
- 9.6.7.3. United Arab Emirates Market Size and Forecast, By Technology, 2018 - 2030 (US$ Million)
- 9.6.7.4. United Arab Emirates Market Size and Forecast, By Application, 2018 - 2030 (US$ Million)
- 9.6.8. Israel
- 9.6.8.1. Overview
- 9.6.8.2. Market Analysis, Forecast, and Y-O-Y Growth Rate, 2018 - 2030, (US$ Million)
- 9.6.8.3. Israel Market Size and Forecast, By Technology, 2018 - 2030 (US$ Million)
- 9.6.8.4. Israel Market Size and Forecast, By Application, 2018 - 2030 (US$ Million)
- 9.6.9. Turkey
- 9.6.9.1. Overview
- 9.6.9.2. Market Analysis, Forecast, and Y-O-Y Growth Rate, 2018 - 2030, (US$ Million)
- 9.6.9.3. Turkey Market Size and Forecast, By Technology, 2018 - 2030 (US$ Million)
- 9.6.9.4. Turkey Market Size and Forecast, By Application, 2018 - 2030 (US$ Million)
- 9.6.10. Algeria
- 9.6.10.1. Overview
- 9.6.10.2. Market Analysis, Forecast, and Y-O-Y Growth Rate, 2018 - 2030, (US$ Million)
- 9.6.10.3. Algeria Market Size and Forecast, By Technology, 2018 - 2030 (US$ Million)
- 9.6.10.4. Algeria Market Size and Forecast, By Application, 2018 - 2030 (US$ Million)
- 9.6.11. Egypt
- 9.6.11.1. Overview
- 9.6.11.2. Market Analysis, Forecast, and Y-O-Y Growth Rate, 2018 - 2030, (US$ Million)
- 9.6.11.3. Egypt Market Size and Forecast, By Technology, 2018 - 2030 (US$ Million)
- 9.6.11.4. Egypt Market Size and Forecast, By Application, 2018 - 2030 (US$ Million)
- 9.6.12. Rest of MEA
- 9.6.12.1. Overview
- 9.6.12.2. Market Analysis, Forecast, and Y-O-Y Growth Rate, 2018 - 2030, (US$ Million)
- 9.6.12.3. Rest of MEA Market Size and Forecast, By Technology, 2018 - 2030 (US$ Million)
- 9.6.12.4. Rest of MEA Market Size and Forecast, By Application, 2018 - 2030 (US$ Million)
10. Key Vendor Analysis- Intelligent Pipeline Pigging Services Industry
- 10.1. Competitive Dashboard
- 10.2. Company Profiles
- 10.2.1. SGS SA
- 10.2.2. Decon International Technologies
- 10.2.3. Pigtek Ltd
- 10.2.4. Romstar Group
- 10.2.5. Enduro Pipeline Services Inc.
- 10.2.6. A.Hak Industrial Services B.V
- 10.2.7. PipeSurvey International
- 10.2.8. NDT Global Services Ltd.
- 10.2.9. Rosen Australia Pty. Ltd.
- 10.2.10. Penspen Limited
11. 360 Degree Analyst View
12. Appendix
- 12.1. Research Methodology
- 12.2. References
- 12.3. Abbreviations
- 12.4. Disclaimer
- 12.5. Contact Us