|
|
市場調査レポート
商品コード
1304643
CAR-T細胞療法市場:薬剤タイプ別、適応症別、エンドユーザー別、国別、地域別- 産業分析、市場規模、市場シェア、2023-2030年予測CAR T-cell therapy Market with COVID-19 Impact Analysis, By Drug Type, By Indication, By End User, By Country, and By Region - Industry Analysis, Market Size, Market Share & Forecast from 2023-2030 |
||||||
|
|
|||||||
カスタマイズ可能
|
|||||||


| CAR-T細胞療法市場:薬剤タイプ別、適応症別、エンドユーザー別、国別、地域別- 産業分析、市場規模、市場シェア、2023-2030年予測 |
|
出版日: 2023年07月01日
発行: AnalystView Market Insights
ページ情報: 英文 288 Pages
納期: 2~3営業日
|

- 全表示
- 概要
- 図表
- 目次
レポートハイライト
CAR-T細胞療法の市場規模は2022年に23億840万米ドルとなり、2023年から2030年にかけてCAGR 21.8%で拡大
CAR-T細胞療法市場-市場力学:
がんの有病率の増加が市場需要を促進する見込み
がんの有病率の増加がCAR-T細胞療法市場の成長を支配すると予想されます。キメラ抗原受容体CAR-T細胞療法は、がんに対する免疫細胞療法における進歩的な新しい柱です。現在、利用可能なCAR-T細胞療法は、患者ごとにカスタマイズされています。世界保健機関(WHO)によると、がんは世界の主要死因であり、2020年には約1,000万人、つまり6人に1人が死亡するとされています。米国だけでも、現在1000人を超える患者がCAR-T細胞の投与を受けており、奏効例における長期的な効果を調べる研究がいくつか開始されています。新規の生物学的療法に関する調査の進展と生物製剤の供給と安全性の向上は、CAR-T細胞療法市場に成長機会をもたらすと期待される要因です。生命を脅かす重篤な毒性、控えめな抗腫瘍活性、抗原逃避、輸送制限、腫瘍浸潤制限などが市場成長を制限する要因です。
CAR-T細胞療法市場-主要インサイト:
- 当社のリサーチアナリストが共有した分析によると、世界のCAR-T細胞療法市場は予測期間(2023-2030年)に約21.8%のCAGRで毎年成長すると予測されています。
- 薬剤タイプ別セグメンテーションでは、ティサゲンレキュセル薬剤タイプが2022年に最大市場シェアを示すと予測される
- 適応症別では、リンパ腫が2022年の主要タイプでした。
- エンドユーザー別では、病院が2022年の主要タイプでした。
- 地域別では、北米が2022年の主要収益源でした。
CAR-T細胞療法市場-セグメンテーション分析:
世界のCAR-T細胞療法市場は、薬剤タイプ、適応症、エンドユーザー、地域に基づいてセグメント化されます。
薬剤タイプにより、市場はCiloleucel、Tisagenlecleucel、Axicabtagene、Autoleucel、Brexucabtagene、その他の5つに分類されます。Tisagenlecleucel薬剤タイプが市場を独占しています。最近認可された製品としては、患者の自己T細胞を用いたB細胞性急性リンパ芽球性白血病(B-ALL)の治療薬として承認されたCAR T療法であるティサゲンロイセルがあります。ティサジェンレクリューセルは現在、B-ALLに対する標準治療となっているため、患者のCAR T細胞を正確にモニタリングできることが臨床上不可欠です。
市場は適応症別に6つのカテゴリーに分類される:慢性リンパ性白血病(CLL)、多発性骨髄腫(MM)、リンパ腫、急性リンパ性白血病、その他です。同療法は、患者自身のT細胞を遺伝子改変してがんを攻撃させるという、高度に専門化された治療法です。
市場はエンドユーザー別に6つのカテゴリーに分類される:病院とがん治療センター。ホスピタリティが2022年の主要タイプです。専門のがんセンターやCAR-T細胞療法プログラムのある病院は、この治療法の実施に対応できる設備が整っています。これらの病院には、安全で効果的な治療を提供するためのインフラ、施設、経験豊富な医療専門家が揃っています。
CAR-T細胞療法市場-地理的洞察:
地理的には、この市場は北米、ラテンアメリカ、欧州、アジア太平洋、中東・アフリカの各地域に広がっています。これらの地域は、ビジネスを展開する国によってさらに区分されます。がんの負担の増加とCAR-T細胞療法を開発するための研究開発の増加は、北米におけるCAR-T細胞療法市場の成長を促進すると予想されます。米国がん学会によると、2021年の新規がん罹患者数と死亡者数は、2021年、米国で新たに診断されるがん罹患者数は190万人、がん死亡者数は60万8570人と推定されます。欧州とアジア太平洋は、キメラ抗原受容体CAR-T細胞療法に関連する製品承認の増加により、CAR-T細胞療法市場の大幅な成長を促進すると予想されます。
CAR-T細胞療法市場-競合情勢:
各社は、細胞株開発技術の強化、新製品の開発、新規治療用途の開拓のため、研究開発に多額の投資を行っています。これらの企業は、研究受託、製造受託、臨床試験サービス、その他バイオ医薬品企業へのサポートサービスなど、幅広いサービスを提供しています。CAR-T細胞療法の安全性を向上させるプラットフォーム技術を開発しているあるバイオベンチャー企業は、現在のCAR-T細胞療法領域をより深く理解するため、包括的な競合情勢の調査をアラクリティに依頼しました。同社は、開発中の主要なCAR-T細胞療法の企業プロファイル、この分野における現在の課題、他社が採用しているソリューション、さらに取引状況を把握したいと考えていました。このことは、自社技術の価値を最大化するための事業戦略や製品開発戦略の指針となると思われます。
最近の動向
2023年5月2日、ジョンソン・エンド・ジョンソンのヤンセンファーマシューティカルカンパニーのひとつであるヤンセンファーマは、B細胞性悪性腫瘍の治療を目的とした次世代キメラ抗原受容体CAR-T細胞療法の開発、製造、商業化に関して、Cellular Biomedicine Group Inc.(CBMG)と世界の提携およびライセンス契約を締結したと発表しました。
調査の主な特徴
この調査レポートは、CAR-T細胞療法市場の市場規模、年間平均成長率(CAGR %)、2022年を基準年とした推定・予測(2023-2030年)を提供しています。
この調査レポートは、CAR-T細胞療法市場に関する最新動向の洞察を顧客に提供します。
調査レポートは、異なるセグメント/国にわたる潜在的な成長機会を解明し、CAR-T細胞療法市場の魅力的な投資提案マトリクスを説明します。
全体的なレポートでは、CAR-T細胞療法市場における新たな投資機会、既存企業が直面する課題、持続的な成長要因を特定しています。
COVID-19のCAR-T細胞療法市場規模、予測、CAGR、市場力学への影響は、調査範囲の下で詳細に議論されています。COVID後のCAR-T細胞療法市場に関する詳細な洞察もカバーします。
本レポートのユーザーにCAR-T細胞療法市場の包括的な見解を提供するために、CAR-T細胞療法市場の競合情勢と主要イノベーター分析も含めています。
本調査では、市場規模、成長率、魅力度に基づき、すべての業界セグメントをベンチマークとした成長見通しマッピング分析を網羅しています。
主要市場参入企業の詳細な企業プロファイルを掲載しており、CAR-T細胞療法市場で事業を展開する企業の財務情報や戦略的イニシアチブを理解するのに役立ちます。
さらに、本レポートでは、世界レベルだけでなく、地域レベルで市場に関与する主要参入企業の重要な買収&合併、提携&ジョイントベンチャー、新発売、研究開発、地域展開も明らかにしています。
世界のCAR-T細胞療法市場レポートは主に、サプライヤー、投資家、新規参入者、流通業者、金融アナリストなど、この業界の様々な利害関係者を対象としています。
目次
第1章 CAR-T細胞療法市場概要
- 調査範囲
- 市場推定年数
第2章 エグゼクティブサマリー
- 市場内訳
- 競合考察
第3章 CAR-T細胞療法の主要な市場動向
- CAR-T細胞療法市場促進要因
- CAR-T細胞療法市場抑制要因
- CAR-T細胞療法の市場機会
- CAR-T細胞療法市場の今後の動向
第4章 CAR-T細胞療法産業の調査
- PEST分析
- ポーターのファイブフォース分析
- 成長見通しのマッピング
- 規制枠組みの分析
第5章 CAR-T細胞療法市場:COVID-19の影響分析
- 新型コロナウイルス感染症以前の影響分析
- 新型コロナウイルス感染症後の影響分析
第6章 CAR-T細胞療法市場情勢
- CAR-T細胞療法市場シェア分析、2022年
- 主要メーカー別の内訳データ
- 確立された企業の分析
- 新興企業の分析
第7章 CAR-T細胞療法市場- 薬剤タイプ別
- 概要
- 薬剤タイプ別セグメントシェア分析
- アクシカブタゲン・シロロイセル
- ティサゲンルクルーセル
- ブレクスカブタゲン・オートロイセル
- その他
第8章 CAR-T細胞療法市場- 適応症別
- 概要
- 適応症別セグメントシェア分析
- リンパ腫
- 急性リンパ性白血病
- 慢性リンパ性白血病(CLL)
- 多発性骨髄腫(MM)
- その他
第9章 CAR-T細胞療法市場- エンドユーザー別
- 概要
- エンドユーザー別のセグメントシェア分析
- 病院
- がん治療センター
第10章 CAR-T細胞療法市場-地域別
- イントロダクション
- 北米
- 概要
- 北米のCAR-T細胞療法の主要メーカー
- 米国
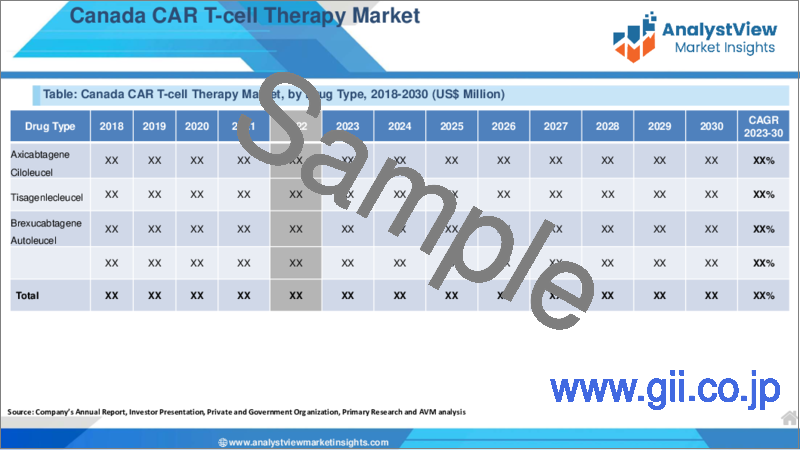
- カナダ
- 欧州
- 概要
- 欧州のCAR-T細胞療法の主要メーカー
- ドイツ
- イタリア
- 英国
- フランス
- ロシア
- オランダ
- スウェーデン
- ポーランド
- その他
- アジア太平洋(APAC)
- 概要
- アジア太平洋地域のCAR-T細胞療法の主要メーカー
- インド
- 中国
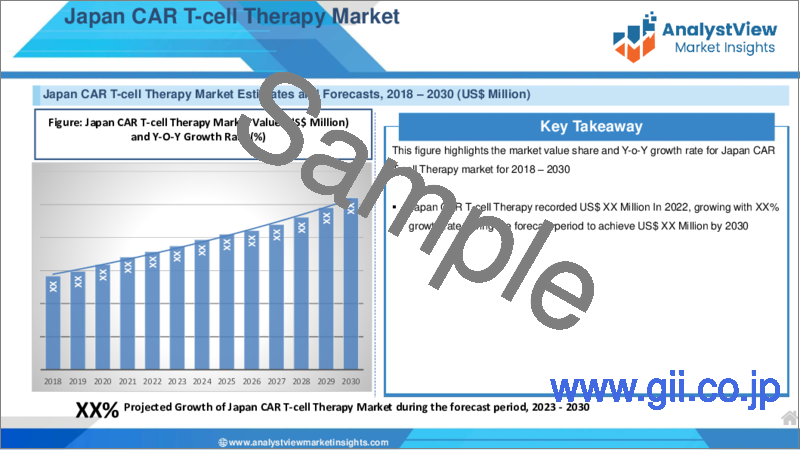
- 日本
- 韓国
- オーストラリア
- タイ
- インドネシア
- フィリピン
- その他
- ラテンアメリカ
- 概要
- ラテンアメリカのCAR-T細胞療法の主要メーカー
- ブラジル
- メキシコ
- アルゼンチン
- コロンビア
- その他
- 中東とアフリカ
- 概要
- 中東およびアフリカのCAR-T細胞療法の主要メーカー
- サウジアラビア
- アラブ首長国連邦
- イスラエル
- トルコ
- アルジェリア
- エジプト
- その他
第11章 主要ベンダー分析-CAR-T細胞療法産業
- 競合ダッシュボード
- 企業プロファイル
- Johnson &Johnson Services, Inc.
- ALLOGENE THERAPEUTICS
- Lonza
- Aurora Biopharma
- Cartesian Therapeutics, Inc.
- Novartis
- Bristol-Myers Squibb company
- Gilead Sciences
- Curocell Inc
- JW Therapeutics
第12章 アナリストの全方位展望
List of Tables
- TABLE List of data sources
- TABLE Market drivers; Impact Analysis
- TABLE Market restraints; Impact Analysis
- TABLE CAR T-Cell Therapy Market: Drug Type Snapshot (2022)
- TABLE Segment Dashboard; Definition and Scope, by Drug Type
- TABLE Global CAR T-Cell Therapy Market, by Drug Type 2018-2030 (USD Million)
- TABLE CAR T-Cell Therapy Market: Indication Snapshot (2022)
- TABLE Segment Dashboard; Definition and Scope, by Indication
- TABLE Global CAR T-Cell Therapy Market, by Indication 2018-2030 (USD Million)
- TABLE CAR T-Cell Therapy Market: End User Snapshot (2022)
- TABLE Segment Dashboard; Definition and Scope, by End User
- TABLE Global CAR T-Cell Therapy Market, by End User 2018-2030 (USD Million)
- TABLE CAR T-Cell Therapy Market: Regional snapshot (2022)
- TABLE Segment Dashboard; Definition and Scope, by Region
- TABLE Global CAR T-Cell Therapy Market, by Region 2018-2030 (USD Million)
- TABLE North America CAR T-Cell Therapy Market, by Country, 2018-2030 (USD Million)
- TABLE North America CAR T-Cell Therapy Market, by Drug Type, 2018-2030 (USD Million)
- TABLE North America CAR T-Cell Therapy Market, by Indication, 2018-2030 (USD Million)
- TABLE North America CAR T-Cell Therapy Market, by End User, 2018-2030 (USD Million)
- TABLE Europe CAR T-Cell Therapy Market, by Country, 2018-2030 (USD Million)
- TABLE Europe CAR T-Cell Therapy Market, by Drug Type, 2018-2030 (USD Million)
- TABLE Europe CAR T-Cell Therapy Market, by Indication, 2018-2030 (USD Million)
- TABLE Europe CAR T-Cell Therapy Market, by End User, 2018-2030 (USD Million)
- TABLE Asia Pacific CAR T-Cell Therapy Market, by Country, 2018-2030 (USD Million)
- TABLE Asia Pacific CAR T-Cell Therapy Market, by Drug Type, 2018-2030 (USD Million)
- TABLE Asia Pacific CAR T-Cell Therapy Market, by Indication, 2018-2030 (USD Million)
- TABLE Asia Pacific CAR T-Cell Therapy Market, by End User, 2018-2030 (USD Million)
- TABLE Latin America CAR T-Cell Therapy Market, by Country, 2018-2030 (USD Million)
- TABLE Latin America CAR T-Cell Therapy Market, by Drug Type, 2018-2030 (USD Million)
- TABLE Latin America CAR T-Cell Therapy Market, by Indication, 2018-2030 (USD Million)
- TABLE Latin America CAR T-Cell Therapy Market, by End User, 2018-2030 (USD Million)
- TABLE Middle East and Africa CAR T-Cell Therapy Market, by Country, 2018-2030 (USD Million)
- TABLE Middle East and Africa CAR T-Cell Therapy Market, by Drug Type, 2018-2030 (USD Million)
- TABLE Middle East and Africa CAR T-Cell Therapy Market, by Indication, 2018-2030 (USD Million)
- TABLE Middle East and Africa CAR T-Cell Therapy Market, by End User, 2018-2030 (USD Million)
REPORT HIGHLIGHT
CAR T-cell therapy Market size was valued at USD 2,308.4 million in 2022, expanding at a CAGR of 21.8% from 2023 to 2030.
Chimeric antigen receptor (CAR)-T cell therapy has been revolutionary as it has produced remarkably effective and durable clinical responses. CAR T-cell therapy is used to treat certain blood cancers, and it is being studied in the treatment of other types of cancer. Also called chimeric antigen receptor T-cell therapy. These therapies do not require aggressive chemotherapy, and unless there is an elevation in cytokines following infusion, patients receiving CAR T-cells do not typically require immunosuppression. The advantage of chimeric antigen receptor (CAR) T-cell therapy is that it is administered in a single infusion, requiring a shorter treatment time. Also, It Improves immunogenic memory, which provides continuous surveillance to treat local and distant metastatic lesions. The main benefit of CAR-T therapy is that it can be curative for people whose blood cancer has not responded to other types of treatments. While CAR-T therapy is often considered a last resort, it is often an effective one.
CAR T-cell therapy Market- Market Dynamics:
The increasing prevalence of cancer is expected to propel market demand
The increasing prevalence of cancer is expected to dominate the growth of the CAR T-cell therapy Market. Chimeric antigen receptor (CAR)-T cell therapy is a progressive new pillar in immune cell therapy for cancer. Currently, available CAR T-cell therapies are customized for each individual patient. According to World health organization, Cancer is a leading cause of death worldwide, accounting for nearly 10 million deaths in 2020, or nearly one in six deaths. In the United States alone, well over 1000 patients have now received CAR-T cells, and several studies have opened looking at the long-term effects in responders. Advancing research on novel biotherapies and increasing the supply and safety of biologics are the factors that are expected to provide growth opportunities for the CAR T-cell therapy market. The severe life-threatening toxicities, modest anti-tumor activity, antigen escape, restricted trafficking, and limited tumor infiltration are the factors which restrict the growth of market.
CAR T-cell Therapy Market- Key Insights:
- As per the analysis shared by our research analyst, the global CAR T-cell therapy market is estimated to grow annually at a CAGR of around 21.8% over the forecast period (2023-2030)
- Based on Drug Type segmentation, Tisagenlecleucel drug type was predicted to show maximum market share in the year 2022
- Based on Indication segmentation, Lymphoma was the leading type in 2022
- Based on End-User segmentation, Hospitals was the leading type in 2022
- On the basis of region, North America was the leading revenue generator in 2022
CAR T-cell Therapy Market- Segmentation Analysis:
The Global CAR T-cell therapy Market is segmented on the basis of Drug Type, Indication, End User, and Region.
The market is divided into five categories based on Drug Type: Ciloleucel, Tisagenlecleucel, Axicabtagene, Autoleucel, Brexucabtagene, and Others. Tisagenlecleucel drug type dominates the market. One such recently licensed product has been Tisagenlecleucel, a CAR T therapy approved for the treatment of B-cell acute lymphoblastic leukemia (B-ALL) using autologous T cells from the patient. Since Tisagenlecleucel is now a standard of care treatment for B-ALL, it is clinically essential to be able to accurately monitor these CAR T cells in patients.
The market is divided into six categories based on Indication: Chronic Lymphocytic Leukemia (CLL), Multiple Myeloma (MM), Lymphoma, Acute Lymphocytic Leukemia, and Others. dominates the market and is likely to maintain its dominance during the forecast period. It is a highly specialized therapy that involves genetically modifying a patient's own T cells to attack their cancer.
The market is divided into six categories based on End -User: Hospitals and Cancer Treatment Centers. Hospitals are the leading type in 2022. Hospitals with specialized cancer centers or designated CAR T-cell therapy programs are equipped to handle the administration of this therapy. They have the infrastructure, facilities and experienced health professionals to provide safe and effective treatment.
CAR T-cell therapy Market- Geographical Insights:
Geographically, this market is widespread into the regions of North America, Latin America, Europe, Asia Pacific, and the Middle East and Africa. These regions are further divided as per the nations bringing business. The increasing burden of cancer and the rise in research and development to develop CAR T-cell therapy is expected to drive the growth of CAR T-cell therapy Market in north America. According to the American cancer society, number of new cancer cases and deaths in 2021 (In 2021, there will be an estimated 1.9 million new cancer cases diagnosed and 608,570 cancer deaths in the United States. Europe and Asia Pacific are expected to propel significant growth in CAR T-cell therapy Market, due to the Growing Product Approvals Associated with Chimeric antigen receptor (CAR)-T cell therapy.
CAR T-cell therapy Market- Competitive Landscape:
Companies invest heavily in research and development to enhance their cell line development technologies, develop new products, and explore novel therapeutic applications. These players offer a wide range of services, including contract research, contract manufacturing, clinical trial services, and other support services for biopharmaceutical companies. A biotech company developing a platform technology to improve the safety of CAR T-cell therapies asked Alacrity to conduct a comprehensive competitive landscape to better understand the current CAR T-cell therapy space. The company wanted to understand the product profiles of top CAR T-cell therapies in development, current challenges in the field and solutions other companies are employing, as well as the deals landscape. This would help guide their business and product development strategy to maximize the value of their technology.
Recent Developments:
In May 2, 2023 -one of the Janssen Pharmaceutical Companies of Johnson & Johnson, announced nowadays that it has entered into a worldwide collaboration and license agreement with Cellular Biomedicine Group Inc. (CBMG) to develop, manufacture and commercialize next-generation chimeric antigen receptor (CAR) T-cell therapies for the treatment of B-cell malignancies.
Key features of the study:
This proposed research study on CAR T-cell therapy market provides market size (US$ million), compound annual growth rate (CAGR %) and forecast estimation (2023-2030), considering 2022 as the base year
The report provides the client the latest up-to-date and trending insights about the CAR T-cell therapy market.
The research report elucidates potential growth opportunities across different segments/countries and explains attractive investment proposition matrix for CAR T-cell therapy market
The overall report identifies new investment opportunities, challenges faced by established players, and growth factors to sustain in the CAR T-cell therapy market
Impact of COVID-19 on CAR T-cell therapy market size, forecast, CAGR, and market dynamics are discussed in detail under the research scope. Detailed insight on CAR T-cell therapy market post-COVID will also be covered.
In order to give the users of this report a comprehensive view on the CAR T-cell therapy market, we have also included competitive landscape and key innovator analysis for the CAR T-cell therapy market.
The study encompasses a growth prospect mapping analysis, wherein all the industry segments are benchmarked based on their market size, growth rate and attractiveness.
The report offers detailed company profiling featuring major market participants which will help users to understand their financial information and strategic initiatives of players operating in the CAR T-cell therapy market.
In addition, the report also unveil the important acquisitions & mergers, collaborations & joint ventures, new launch, research & development, regional expansion of major participants involved in the market on global as well as regional level.
The global CAR T-cell therapy market report primarily caters to various stakeholders in this industry including suppliers, investors, new entrants, distributors, and financial analysts
SCOPE OF THE REPORT
The scope of this report covers the market by its major segments, which include as follows:
GLOBAL CAR T-CELL THERAPY MARKET KEY PLAYERS
- Johnson & Johnson Services, Inc.
- ALLOGENE THERAPEUTICS
- Lonza
- Aurora Biopharma
- Cartesian Therapeutics, Inc.
- Novartis
- Bristol-Myers Squibb company
- Gilead Sciences
- Curocell Inc
- JW Therapeutics
GLOBAL CAR T-CELL THERAPY MARKET, BY DRUG TYPE
- Axicabtagene Ciloleucel
- Tisagenlecleucel
- Brexucabtagene Autoleucel
- Others
GLOBAL CAR T-CELL THERAPY MARKET, BY INDICATION
- Lymphoma
- Acute Lymphocytic Leukemia
- Chronic Lymphocytic Leukemia (CLL)
- Multiple Myeloma (MM)
- Others
GLOBAL CAR T-CELL THERAPY MARKET, BY END-USER
- Hospitals
- Cancer Treatment Centers
GLOBAL CAR T-CELL THERAPY MARKET, BY REGION
- North America
- The U.S.
- Canada
- Europe
- Germany
- France
- Italy
- Spain
- United Kingdom
- Russia
- Netherlands
- Sweden
- Poland
- Rest of Europe
- Asia Pacific
- India
- China
- South Korea
- Japan
- Australia
- Thailand
- Indonesia
- Philippines
- Rest of APAC
- Latin America
- Brazil
- Mexico
- Argentina
- Colombia
- Rest of LATAM
- The Middle East and Africa
- Saudi Arabia
- United Arab Emirates
- Israel
- Turkey
- Algeria
- Egypt
- Rest of MEA
Table of Contents
1. CAR T-Cell Therapy Market Overview
- 1.1. Study Scope
- 1.2. Market Estimation Years
2. Executive Summary
- 2.1. Market Snippet
- 2.1.1. CAR T-Cell Therapy Market Snippet by Drug Type
- 2.1.2. CAR T-Cell Therapy Market Snippet by Indication
- 2.1.3. CAR T-Cell Therapy Market Snippet by End User
- 2.1.4. CAR T-Cell Therapy Market Snippet by Country
- 2.1.5. CAR T-Cell Therapy Market Snippet by Region
- 2.2. Competitive Insights
3. CAR T-Cell Therapy Key Market Trends
- 3.1. CAR T-Cell Therapy Market Drivers
- 3.1.1. Impact Analysis of Market Drivers
- 3.2. CAR T-Cell Therapy Market Restraints
- 3.2.1. Impact Analysis of Market Restraints
- 3.3. CAR T-Cell Therapy Market Opportunities
- 3.4. CAR T-Cell Therapy Market Future Trends
4. CAR T-Cell Therapy Industry Study
- 4.1. PEST Analysis
- 4.2. Porter's Five Forces Analysis
- 4.3. Growth Prospect Mapping
- 4.4. Regulatory Framework Analysis
5. CAR T-Cell Therapy Market: COVID-19 Impact Analysis
- 5.1. Pre-COVID-19 Impact Analysis
- 5.2. Post-COVID-19 Impact Analysis
- 5.2.1. Top Performing Segments
- 5.2.2. Marginal Growth Segments
- 5.2.3. Top Looser Segments
- 5.2.4. Marginal Loss Segments
6. CAR T-Cell Therapy Market Landscape
- 6.1. CAR T-Cell Therapy Market Share Analysis, 2022
- 6.2. Breakdown Data, by Key Manufacturer
- 6.2.1. Established Players' Analysis
- 6.2.2. Emerging Players' Analysis
7. CAR T-Cell Therapy Market - By Drug Type
- 7.1. Overview
- 7.1.1. Segment Share Analysis, By Drug Type, 2022 & 2030 (%)
- 7.1.2. Axicabtagene Ciloleucel
- 7.1.3. Tisagenlecleucel
- 7.1.4. Brexucabtagene Autoleucel
- 7.1.5. Others
8. CAR T-Cell Therapy Market - By Indication
- 8.1. Overview
- 8.1.1. Segment Share Analysis, By Indication, 2022 & 2030 (%)
- 8.1.2. Lymphoma
- 8.1.3. Acute Lymphocytic Leukemia
- 8.1.4. Chronic Lymphocytic Leukemia (CLL)
- 8.1.5. Multiple Myeloma (MM)
- 8.1.6. Others
9. CAR T-Cell Therapy Market - By End User
- 9.1. Overview
- 9.1.1. Segment Share Analysis, By End User, 2022 & 2030 (%)
- 9.1.2. Hospitals
- 9.1.3. Cancer Treatment Centers
10. CAR T-Cell Therapy Market- By Geography
- 10.1. Introduction
- 10.1.1. Segment Share Analysis, By Geography, 2022 & 2030 (%)
- 10.2. North America
- 10.2.1. Overview
- 10.2.2. CAR T-Cell Therapy Key Manufacturers in North America
- 10.2.3. North America Market Size and Forecast, By Country, 2018 - 2030 (US$ Million)
- 10.2.4. North America Market Size and Forecast, By Drug Type, 2018 - 2030 (US$ Million)
- 10.2.5. North America Market Size and Forecast, By Indication, 2018 - 2030 (US$ Million)
- 10.2.6. North America Market Size and Forecast, By End User, 2018 - 2030 (US$ Million)
- 10.2.7. U.S.
- 10.2.7.1. Overview
- 10.2.7.2. Market Analysis, Forecast, and Y-O-Y Growth Rate, 2018 - 2030, (US$ Million)
- 10.2.7.3. U.S. Market Size and Forecast, By Drug Type, 2018 - 2030 (US$ Million)
- 10.2.7.4. U.S. Market Size and Forecast, By Indication, 2018 - 2030 (US$ Million)
- 10.2.7.5. U.S. Market Size and Forecast, By End User, 2018 - 2030 (US$ Million)
- 10.2.8. Canada
- 10.2.8.1. Overview
- 10.2.8.2. Market Analysis, Forecast, and Y-O-Y Growth Rate, 2018 - 2030, (US$ Million)
- 10.2.8.3. Canada Market Size and Forecast, By Drug Type, 2018 - 2030 (US$ Million)
- 10.2.8.4. Canada Market Size and Forecast, By Indication, 2018 - 2030 (US$ Million)
- 10.2.8.5. Canada Market Size and Forecast, By End User, 2018 - 2030 (US$ Million)
- 10.3. Europe
- 10.3.1. Overview
- 10.3.2. CAR T-Cell Therapy Key Manufacturers in Europe
- 10.3.3. Europe Market Size and Forecast, By Country, 2018 - 2030 (US$ Million)
- 10.3.4. Europe Market Size and Forecast, By Drug Type, 2018 - 2030 (US$ Million)
- 10.3.5. Europe Market Size and Forecast, By Indication, 2018 - 2030 (US$ Million)
- 10.3.6. Europe Market Size and Forecast, By End User, 2018 - 2030 (US$ Million)
- 10.3.7. Germany
- 10.3.7.1. Overview
- 10.3.7.2. Market Analysis, Forecast, and Y-O-Y Growth Rate, 2018 - 2030, (US$ Million)
- 10.3.7.3. Germany Market Size and Forecast, By Drug Type, 2018 - 2030 (US$ Million)
- 10.3.7.4. Germany Market Size and Forecast, By Indication, 2018 - 2030 (US$ Million)
- 10.3.7.5. Germany Market Size and Forecast, By End User, 2018 - 2030 (US$ Million)
- 10.3.8. Italy
- 10.3.8.1. Overview
- 10.3.8.2. Market Analysis, Forecast, and Y-O-Y Growth Rate, 2018 - 2030, (US$ Million)
- 10.3.8.3. Italy Market Size and Forecast, By Drug Type, 2018 - 2030 (US$ Million)
- 10.3.8.4. Italy Market Size and Forecast, By Indication, 2018 - 2030 (US$ Million)
- 10.3.8.5. Italy Market Size and Forecast, By End User, 2018 - 2030 (US$ Million)
- 10.3.9. United Kingdom
- 10.3.9.1. Overview
- 10.3.9.2. Market Analysis, Forecast, and Y-O-Y Growth Rate, 2018 - 2030, (US$ Million)
- 10.3.9.3. United Kingdom Market Size and Forecast, By Drug Type, 2018 - 2030 (US$ Million)
- 10.3.9.4. United Kingdom Market Size and Forecast, By Indication, 2018 - 2030 (US$ Million)
- 10.3.9.5. United Kingdom Market Size and Forecast, By End User, 2018 - 2030 (US$ Million)
- 10.3.10. France
- 10.3.10.1. Overview
- 10.3.10.2. Market Analysis, Forecast, and Y-O-Y Growth Rate, 2018 - 2030, (US$ Million)
- 10.3.10.3. France Market Size and Forecast, By Drug Type, 2018 - 2030 (US$ Million)
- 10.3.10.4. France Market Size and Forecast, By Indication, 2018 - 2030 (US$ Million)
- 10.3.10.5. France Market Size and Forecast, By End User, 2018 - 2030 (US$ Million)
- 10.3.11. Russia
- 10.3.11.1. Market Analysis, Forecast, and Y-O-Y Growth Rate, 2018 - 2030, (US$ Million)
- 10.3.11.2. Russia Market Size and Forecast, By Drug Type, 2018 - 2030 (US$ Million)
- 10.3.11.3. Russia Market Size and Forecast, By Indication, 2018 - 2030 (US$ Million)
- 10.3.11.4. Russia Market Size and Forecast, By End User, 2018 - 2030 (US$ Million)
- 10.3.12. Netherlands
- 10.3.12.1. Market Analysis, Forecast, and Y-O-Y Growth Rate, 2018 - 2030, (US$ Million)
- 10.3.12.2. Netherlands Market Size and Forecast, By Drug Type, 2018 - 2030 (US$ Million)
- 10.3.12.3. Netherlands Market Size and Forecast, By Indication, 2018 - 2030 (US$ Million)
- 10.3.12.4. Netherlands Market Size and Forecast, By End User, 2018 - 2030 (US$ Million)
- 10.3.13. Sweden
- 10.3.13.1. Market Analysis, Forecast, and Y-O-Y Growth Rate, 2018 - 2030, (US$ Million)
- 10.3.13.2. Sweden Market Size and Forecast, By Drug Type, 2018 - 2030 (US$ Million)
- 10.3.13.3. Sweden Market Size and Forecast, By Indication, 2018 - 2030 (US$ Million)
- 10.3.13.4. Sweden Market Size and Forecast, By End User, 2018 - 2030 (US$ Million)
- 10.3.14. Poland
- 10.3.14.1. Market Analysis, Forecast, and Y-O-Y Growth Rate, 2018 - 2030, (US$ Million)
- 10.3.14.2. Poland Market Size and Forecast, By Drug Type, 2018 - 2030 (US$ Million)
- 10.3.14.3. Poland Market Size and Forecast, By Indication, 2018 - 2030 (US$ Million)
- 10.3.14.4. Poland Market Size and Forecast, By End User, 2018 - 2030 (US$ Million)
- 10.3.15. Rest of Europe
- 10.3.15.1. Overview
- 10.3.15.2. Market Analysis, Forecast, and Y-O-Y Growth Rate, 2018 - 2030, (US$ Million)
- 10.3.15.3. Rest of the Europe Market Size and Forecast, By Drug Type, 2018 - 2030 (US$ Million)
- 10.3.15.4. Rest of the Europe Market Size and Forecast, By Indication, 2018 - 2030 (US$ Million)
- 10.3.15.5. Rest of the Europe Market Size and Forecast, By End User, 2018 - 2030 (US$ Million)
- 10.4. Asia Pacific (APAC)
- 10.4.1. Overview
- 10.4.2. CAR T-Cell Therapy Key Manufacturers in Asia Pacific
- 10.4.3. Asia Pacific Market Size and Forecast, By Country, 2018 - 2030 (US$ Million)
- 10.4.4. Asia Pacific Market Size and Forecast, By Drug Type, 2018 - 2030 (US$ Million)
- 10.4.5. Asia Pacific Market Size and Forecast, By Indication, 2018 - 2030 (US$ Million)
- 10.4.6. Asia Pacific Market Size and Forecast, By End User, 2018 - 2030 (US$ Million)
- 10.4.7. India
- 10.4.7.1. Overview
- 10.4.7.2. Market Analysis, Forecast, and Y-O-Y Growth Rate, 2018 - 2030, (US$ Million)
- 10.4.7.3. India Market Size and Forecast, By Drug Type, 2018 - 2030 (US$ Million)
- 10.4.7.4. India Market Size and Forecast, By Indication, 2018 - 2030 (US$ Million)
- 10.4.7.5. India Market Size and Forecast, By End User, 2018 - 2030 (US$ Million)
- 10.4.8. China
- 10.4.8.1. Overview
- 10.4.8.2. Market Analysis, Forecast, and Y-O-Y Growth Rate, 2018 - 2030, (US$ Million)
- 10.4.8.3. China Market Size and Forecast, By Drug Type, 2018 - 2030 (US$ Million)
- 10.4.8.4. China Market Size and Forecast, By Indication, 2018 - 2030 (US$ Million)
- 10.4.8.5. China Market Size and Forecast, By End User, 2018 - 2030 (US$ Million)
- 10.4.9. Japan
- 10.4.9.1. Overview
- 10.4.9.2. Market Analysis, Forecast, and Y-O-Y Growth Rate, 2018 - 2030, (US$ Million)
- 10.4.9.3. Japan Market Size and Forecast, By Drug Type, 2018 - 2030 (US$ Million)
- 10.4.9.4. Japan Market Size and Forecast, By Indication, 2018 - 2030 (US$ Million)
- 10.4.9.5. Japan Market Size and Forecast, By End User, 2018 - 2030 (US$ Million)
- 10.4.10. South Korea
- 10.4.10.1. Overview
- 10.4.10.2. Market Analysis, Forecast, and Y-O-Y Growth Rate, 2018 - 2030, (US$ Million)
- 10.4.10.3. South Korea Market Size and Forecast, By Drug Type, 2018 - 2030 (US$ Million)
- 10.4.10.4. South Korea Market Size and Forecast, By Indication, 2018 - 2030 (US$ Million)
- 10.4.10.5. South Korea Market Size and Forecast, By End User, 2018 - 2030 (US$ Million)
- 10.4.11. Australia
- 10.4.11.1. Overview
- 10.4.11.2. Market Analysis, Forecast, and Y-O-Y Growth Rate, 2018 - 2030, (US$ Million)
- 10.4.11.3. Australia Market Size and Forecast, By Drug Type, 2018 - 2030 (US$ Million)
- 10.4.11.4. Australia Market Size and Forecast, By Indication, 2018 - 2030 (US$ Million)
- 10.4.11.5. Australia Market Size and Forecast, By End User, 2018 - 2030 (US$ Million)
- 10.4.12. Thailand
- 10.4.12.1. Overview
- 10.4.12.2. Market Analysis, Forecast, and Y-O-Y Growth Rate, 2018 - 2030, (US$ Million)
- 10.4.12.3. Thailand Market Size and Forecast, By Drug Type, 2018 - 2030 (US$ Million)
- 10.4.12.4. Thailand Market Size and Forecast, By Indication, 2018 - 2030 (US$ Million)
- 10.4.12.5. Thailand Market Size and Forecast, By End User, 2018 - 2030 (US$ Million)
- 10.4.13. Indonesia
- 10.4.13.1. Overview
- 10.4.13.2. Market Analysis, Forecast, and Y-O-Y Growth Rate, 2018 - 2030, (US$ Million)
- 10.4.13.3. Indonesia Market Size and Forecast, By Drug Type, 2018 - 2030 (US$ Million)
- 10.4.13.4. Indonesia Market Size and Forecast, By Indication, 2018 - 2030 (US$ Million)
- 10.4.13.5. Indonesia Market Size and Forecast, By End User, 2018 - 2030 (US$ Million)
- 10.4.14. Philippines
- 10.4.14.1. Overview
- 10.4.14.2. Market Analysis, Forecast, and Y-O-Y Growth Rate, 2018 - 2030, (US$ Million)
- 10.4.14.3. Philippines Market Size and Forecast, By Drug Type, 2018 - 2030 (US$ Million)
- 10.4.14.4. Philippines Market Size and Forecast, By Indication, 2018 - 2030 (US$ Million)
- 10.4.14.5. Philippines Market Size and Forecast, By End User, 2018 - 2030 (US$ Million)
- 10.4.15. Rest of APAC
- 10.4.15.1. Overview
- 10.4.15.2. Market Analysis, Forecast, and Y-O-Y Growth Rate, 2018 - 2030, (US$ Million)
- 10.4.15.3. Rest of APAC Market Size and Forecast, By Drug Type, 2018 - 2030 (US$ Million)
- 10.4.15.4. Rest of APAC Market Size and Forecast, By Indication, 2018 - 2030 (US$ Million)
- 10.4.15.5. Rest of APAC Market Size and Forecast, By End User, 2018 - 2030 (US$ Million)
- 10.5. Latin America
- 10.5.1. Overview
- 10.5.2. CAR T-Cell Therapy Key Manufacturers in Latin America
- 10.5.3. Latin America Market Size and Forecast, By Country, 2018 - 2030 (US$ Million)
- 10.5.4. Latin America Market Size and Forecast, By Drug Type, 2018 - 2030 (US$ Million)
- 10.5.5. Latin America Market Size and Forecast, By Indication, 2018 - 2030 (US$ Million)
- 10.5.6. Latin America Market Size and Forecast, By End User, 2018 - 2030 (US$ Million)
- 10.5.7. Brazil
- 10.5.7.1. Overview
- 10.5.7.2. Market Analysis, Forecast, and Y-O-Y Growth Rate, 2018 - 2030, (US$ Million)
- 10.5.7.3. Brazil Market Size and Forecast, By Drug Type, 2018 - 2030 (US$ Million)
- 10.5.7.4. Brazil Market Size and Forecast, By Indication, 2018 - 2030 (US$ Million)
- 10.5.7.5. Brazil Market Size and Forecast, By End User, 2018 - 2030 (US$ Million)
- 10.5.8. Mexico
- 10.5.8.1. Overview
- 10.5.8.2. Market Analysis, Forecast, and Y-O-Y Growth Rate, 2018 - 2030, (US$ Million)
- 10.5.8.3. Mexico Market Size and Forecast, By Drug Type, 2018 - 2030 (US$ Million)
- 10.5.8.4. Mexico Market Size and Forecast, By Indication, 2018 - 2030 (US$ Million)
- 10.5.8.5. Mexico Market Size and Forecast, By End User, 2018 - 2030 (US$ Million)
- 10.5.9. Argentina
- 10.5.9.1. Overview
- 10.5.9.2. Market Analysis, Forecast, and Y-O-Y Growth Rate, 2018 - 2030, (US$ Million)
- 10.5.9.3. Argentina Market Size and Forecast, By Drug Type, 2018 - 2030 (US$ Million)
- 10.5.9.4. Argentina Market Size and Forecast, By Indication, 2018 - 2030 (US$ Million)
- 10.5.9.5. Argentina Market Size and Forecast, By End User, 2018 - 2030 (US$ Million)
- 10.5.10. Colombia
- 10.5.10.1. Overview
- 10.5.10.2. Market Analysis, Forecast, and Y-O-Y Growth Rate, 2018 - 2030, (US$ Million)
- 10.5.10.3. Colombia Market Size and Forecast, By Drug Type, 2018 - 2030 (US$ Million)
- 10.5.10.4. Colombia Market Size and Forecast, By Indication, 2018 - 2030 (US$ Million)
- 10.5.10.5. Colombia Market Size and Forecast, By End User, 2018 - 2030 (US$ Million)
- 10.5.11. Rest of LATAM
- 10.5.11.1. Overview
- 10.5.11.2. Market Analysis, Forecast, and Y-O-Y Growth Rate, 2018 - 2030, (US$ Million)
- 10.5.11.3. Rest of LATAM Market Size and Forecast, By Drug Type, 2018 - 2030 (US$ Million)
- 10.5.11.4. Rest of LATAM Market Size and Forecast, By Indication, 2018 - 2030 (US$ Million)
- 10.5.11.5. Rest of LATAM Market Size and Forecast, By End User, 2018 - 2030 (US$ Million)
- 10.6. Middle East and Africa
- 10.6.1. Overview
- 10.6.2. CAR T-Cell Therapy Key Manufacturers in Middle East and Africa
- 10.6.3. Middle East and Africa Market Size and Forecast, By Country, 2018 - 2030 (US$ Million)
- 10.6.4. Middle East and Africa Market Size and Forecast, By Drug Type, 2018 - 2030 (US$ Million)
- 10.6.5. Middle East and Africa Market Size and Forecast, By Indication, 2018 - 2030 (US$ Million)
- 10.6.6. Middle East and Africa Market Size and Forecast, By End User, 2018 - 2030 (US$ Million)
- 10.6.7. Saudi Arabia
- 10.6.7.1. Overview
- 10.6.7.2. Market Analysis, Forecast, and Y-O-Y Growth Rate, 2018 - 2030, (US$ Million)
- 10.6.7.3. Saudi Arabia Market Size and Forecast, By Drug Type, 2018 - 2030 (US$ Million)
- 10.6.7.4. Saudi Arabia Market Size and Forecast, By Indication, 2018 - 2030 (US$ Million)
- 10.6.7.5. Saudi Arabia Market Size and Forecast, By End User, 2018 - 2030 (US$ Million)
- 10.6.8. United Arab Emirates
- 10.6.8.1. Overview
- 10.6.8.2. Market Analysis, Forecast, and Y-O-Y Growth Rate, 2018 - 2030, (US$ Million)
- 10.6.8.3. United Arab Emirates Market Size and Forecast, By Drug Type, 2018 - 2030 (US$ Million)
- 10.6.8.4. United Arab Emirates Market Size and Forecast, By Indication, 2018 - 2030 (US$ Million)
- 10.6.8.5. United Arab Emirates Market Size and Forecast, By End User, 2018 - 2030 (US$ Million)
- 10.6.9. Israel
- 10.6.9.1. Overview
- 10.6.9.2. Market Analysis, Forecast, and Y-O-Y Growth Rate, 2018 - 2030, (US$ Million)
- 10.6.9.3. Israel Market Size and Forecast, By Drug Type, 2018 - 2030 (US$ Million)
- 10.6.9.4. Israel Market Size and Forecast, By Indication, 2018 - 2030 (US$ Million)
- 10.6.9.5. Israel Market Size and Forecast, By End User, 2018 - 2030 (US$ Million)
- 10.6.10. Turkey
- 10.6.10.1. Overview
- 10.6.10.2. Market Analysis, Forecast, and Y-O-Y Growth Rate, 2018 - 2030, (US$ Million)
- 10.6.10.3. Turkey Market Size and Forecast, By Drug Type, 2018 - 2030 (US$ Million)
- 10.6.10.4. Turkey Market Size and Forecast, By Indication, 2018 - 2030 (US$ Million)
- 10.6.10.5. Turkey Market Size and Forecast, By End User, 2018 - 2030 (US$ Million)
- 10.6.11. Algeria
- 10.6.11.1. Overview
- 10.6.11.2. Market Analysis, Forecast, and Y-O-Y Growth Rate, 2018 - 2030, (US$ Million)
- 10.6.11.3. Algeria Market Size and Forecast, By Drug Type, 2018 - 2030 (US$ Million)
- 10.6.11.4. Algeria Market Size and Forecast, By Indication, 2018 - 2030 (US$ Million)
- 10.6.11.5. Algeria Market Size and Forecast, By End User, 2018 - 2030 (US$ Million)
- 10.6.12. Egypt
- 10.6.12.1. Overview
- 10.6.12.2. Market Analysis, Forecast, and Y-O-Y Growth Rate, 2018 - 2030, (US$ Million)
- 10.6.12.3. Egypt Market Size and Forecast, By Drug Type, 2018 - 2030 (US$ Million)
- 10.6.12.4. Egypt Market Size and Forecast, By Indication, 2018 - 2030 (US$ Million)
- 10.6.12.5. Egypt Market Size and Forecast, By End User, 2018 - 2030 (US$ Million)
- 10.6.13. Rest of MEA
- 10.6.13.1. Overview
- 10.6.13.2. Market Analysis, Forecast, and Y-O-Y Growth Rate, 2018 - 2030, (US$ Million)
- 10.6.13.3. Rest of MEA Market Size and Forecast, By Drug Type, 2018 - 2030 (US$ Million)
- 10.6.13.4. Rest of MEA Market Size and Forecast, By Indication, 2018 - 2030 (US$ Million)
- 10.6.13.5. Rest of MEA Market Size and Forecast, By End User, 2018 - 2030 (US$ Million)
11. Key Vendor Analysis- CAR T-Cell Therapy Industry
- 11.1. Competitive Dashboard
- 11.2. Company Profiles
- 11.2.1. Johnson & Johnson Services, Inc.
- 11.2.2. ALLOGENE THERAPEUTICS
- 11.2.3. Lonza
- 11.2.4. Aurora Biopharma
- 11.2.5. Cartesian Therapeutics, Inc.
- 11.2.6. Novartis
- 11.2.7. Bristol-Myers Squibb company
- 11.2.8. Gilead Sciences
- 11.2.9. Curocell Inc
- 11.2.10. JW Therapeutics
12. 360 Degree Analyst View
13. Appendix
- 13.1. Research Methodology
- 13.2. References
- 13.3. Abbreviations
- 13.4. Disclaimer
- 13.5. Contact Us