|
|
市場調査レポート
商品コード
1299732
サプライチェーンセキュリティ市場:部品別、用途別、業界別、国別、地域別- 産業分析、市場規模、市場シェア、2023年~2030年予測Supply Chain Security Market with COVID-19 Impact Analysis, By Component, By Application, By Vertical, By Country, and By Region - Industry Analysis, Market Size, Market Share & Forecast from 2023-2030 |
||||||
|
|
|||||||
カスタマイズ可能
|
|||||||


| サプライチェーンセキュリティ市場:部品別、用途別、業界別、国別、地域別- 産業分析、市場規模、市場シェア、2023年~2030年予測 |
|
出版日: 2023年06月01日
発行: AnalystView Market Insights
ページ情報: 英文 308 Pages
納期: 2~3営業日
|

- 全表示
- 概要
- 図表
- 目次
レポートハイライト
サプライチェーンセキュリティ市場規模は2022年に21億9,030万米ドルと評価され、2023年から2030年にかけてCAGR 11.6%で拡大
サプライチェーンセキュリティ市場-市場力学:
サプライチェーンセキュリティ市場の主な原動力は、セキュリティ脅威に対するニーズの高まりです。世界の貿易の拡大に伴い、サプライチェーンは複雑化し、盗難、海賊行為、サイバー攻撃、テロなど、さまざまなセキュリティ上の脅威にさらされやすくなっています。このため、こうしたリスクを軽減するためのサプライチェーンセキュリティ・ソリューションに対する需要が高まっています。さらに、政府や規制機関は、サプライチェーンのセキュリティを確保するため、厳格な規制や基準を実施しています。例えば、国際標準化機構(ISO)はサプライチェーンセキュリティ管理のためのISO 28000規格を策定し、サプライチェーンにおけるセキュリティリスク管理のベストプラクティスを概説しています。
さらに、eコマースやオンライン取引の増加に伴い、サプライチェーンはより複雑化し、サイバー脅威に対して脆弱になっています。このため、オンライン取引を保護し、サイバー攻撃を防ぐためのサプライチェーンセキュリティ・ソリューションに対する需要が高まっています。さらに、消費者は購入する製品の安全性や原産地に対する関心を高めています。その結果、サプライチェーンにおける透明性とトレーサビリティを提供し、消費者が購入した製品の原産地と安全性を追跡できるようにするサプライチェーンセキュリティ・ソリューションに対する需要が高まっています。
サプライチェーンセキュリティ市場-セグメンテーション分析:
世界のサプライチェーンセキュリティ市場は、部品別、用途別、業界別、地域別に区分されます。
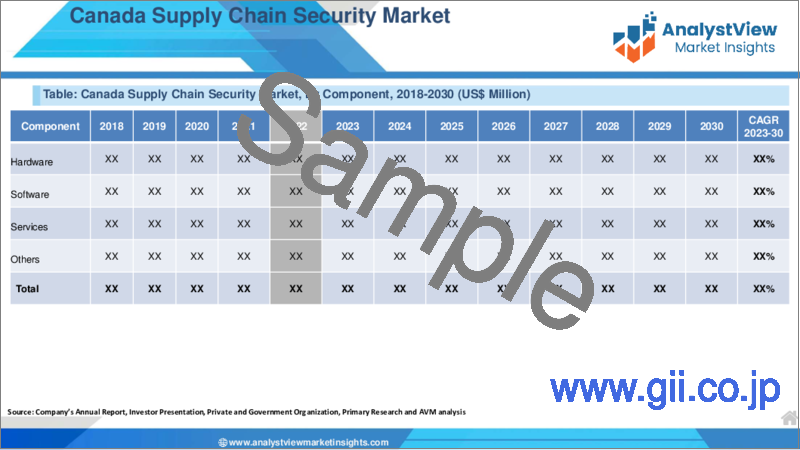
市場は、コンポーネントに基づいてハードウェア、ソフトウェア、サービスの3つに分類されます。ハードウェア分野が市場を独占しています。サプライチェーンセキュリティ・ソリューションに対する需要の高まりが、同分野の成長に寄与しています。
アプリケーション:データ保護、データ可視化、その他。データ保護分野が市場を独占しており、予測期間中もその優位性を維持するとみられます。この背景には、サイバー脅威の増加によるデータ保護需要の増加があります。
市場は業界別にヘルスケア、小売、自動車、製造、食品、その他の6つに分類されます。小売分野は市場を独占しており、予測期間中もその優位性を維持するとみられます。これは、eコマースと小売セクターが増加していることも一因です。
サプライチェーンセキュリティ市場-地理的洞察:
地理的には、この市場は北米、ラテンアメリカ、欧州、アジア太平洋、中東アフリカの各地域に広がっています。これらの地域は、ビジネスをもたらす国によってさらに分けられます。
北米は2021年に最大の市場シェアを占め、予測期間中もその優位性が続くと予測されています。米国における小売セクターからの需要拡大が主に市場成長に寄与しています。
サプライチェーンセキュリティ市場-競合情勢:
今後のサプライチェーンセキュリティに対する高い需要のため、サプライチェーンセキュリティの世界市場は海外メーカーと現地メーカーの両方で構成されており、世界で最も競争の激しい分野の一つとなっています。企業は、企業ウェブサイトを含む様々なチャネルを通じてコンポーネントを販売しています。コンポーネントメーカーは、ゲーム性能を含む様々な面で競争しています。リーチを強化し市場シェアを拡大するために企業が用いる主な手法には、新しいコンポーネントの発売、ウェブネットワークの開発、M&Aなどがあります。例えば、2021年、IBMは、企業がサプライチェーンを追跡・管理するのに役立つエンドツーエンドの可視性と透明性を提供するブロックチェーンベースのサプライチェーンソリューションを開発しました。
この調査の主な特徴
サプライチェーンセキュリティ市場に関するこの調査レポートは、2022年を基準年として、市場規模、CAGR 、推定・予測(2023-2030年)を提供します。
調査レポートは、異なるセグメント/国にわたる潜在的な成長機会を解明し、サプライチェーンセキュリティ市場の魅力的な投資提案マトリクスを説明します。
全体レポートでは、サプライチェーンセキュリティ市場における新たな投資機会、既存企業が直面する課題、持続的な成長要因を特定しています。
サプライチェーンセキュリティ市場の市場規模、予測、CAGR、市場力学に対するCOVID-19の影響について調査範囲で詳細に論じています。COVID後のサプライチェーンセキュリティ市場に関する詳細な洞察もカバーします。
本レポートの利用者にサプライチェーンセキュリティ市場の包括的な見解を提供するために、サプライチェーンセキュリティ市場の競合情勢と主要イノベーター分析も含めています。
本調査では、市場規模、成長率、魅力度に基づいてすべての業界セグメントをベンチマークする成長見通しマッピング分析を網羅しています。
当レポートでは、サプライチェーンセキュリティ市場で事業を展開する企業の財務情報や戦略的イニシアチブを理解するのに役立つ、主要市場参入企業を特集した詳細な企業プロファイルを提供しています。
さらに、本レポートは、世界レベルおよび地域レベルでの市場に関与する主要参加者の重要な買収と合併、コラボレーションと合弁事業、新規立ち上げ、研究開発、地域展開も明らかにしています。
サプライチェーンセキュリティの世界市場レポートは主に、サプライヤー、投資家、新規参入者、流通業者、金融アナリストなど、この業界の様々な利害関係者を対象としています。
目次
第1章 サプライチェーンセキュリティ市場概要
- 調査範囲
第2章 エグゼクティブサマリー
- 市場内訳
- 競合考察
第3章 サプライチェーンセキュリティの主要な市場動向
- サプライチェーンセキュリティ市場促進要因
- サプライチェーンセキュリティ市場抑制要因
- サプライチェーンセキュリティ市場機会
- サプライチェーンセキュリティ市場の今後の動向
第4章 サプライチェーンセキュリティ業界の調査
- PEST分析
- ポーターのファイブフォース分析
- 成長見通しのマッピング
- 規制枠組みの分析
第5章 サプライチェーンセキュリティ市場:COVID-19の影響分析
- COVID-19以前の影響分析
- COVID-19後の影響分析
第6章 サプライチェーンセキュリティ市場情勢
- サプライチェーンセキュリティ市場シェア分析、2022年
- 主要メーカー別の内訳データ
- 既存企業の分析
- 新興企業の分析
第7章 サプライチェーンセキュリティ市場- 部品別
- 概要
- 部品別のセグメントシェア分析
- ハードウェア
- ソフトウェア
- サービス
第8章 サプライチェーンセキュリティ市場- 用途別
- 概要
- 用途別のセグメントシェア分析
- データ保護
- データの可視性
- その他
第9章 サプライチェーンセキュリティ市場-業界別
- 概要
- 業界別のセグメントシェア分析
- ヘルスケア
- 小売り
- 自動車
- 製造業
- 食品
- その他
第10章 サプライチェーンセキュリティ市場-地域別
- イントロダクション
- 北米
- 概要
- 北米のサプライチェーンセキュリティキーメーカー
- 米国
- カナダ
- 欧州
- 概要
- 欧州のサプライチェーンセキュリティ主要メーカー
- ドイツ
- イタリア
- 英国
- フランス
- ロシア
- オランダ
- スウェーデン
- ポーランド
- その他
- アジア太平洋(APAC)
- 概要
- アジア太平洋地域のサプライチェーンセキュリティ主要メーカー
- インド
- 中国
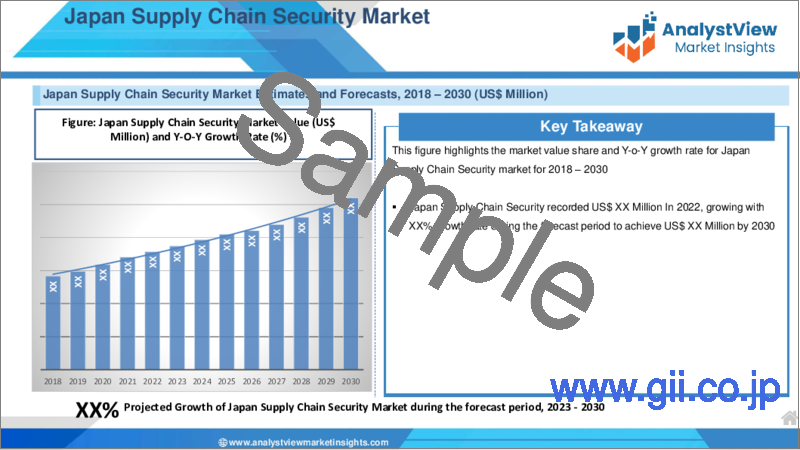
- 日本
- 韓国
- オーストラリア
- タイ
- インドネシア
- フィリピン
- その他
- ラテンアメリカ
- 概要
- ラテンアメリカのサプライチェーンセキュリティ主要メーカー
- ブラジル
- メキシコ
- アルゼンチン
- コロンビア
- その他
- 中東とアフリカ
- 概要
- 中東およびアフリカのサプライチェーンセキュリティ主要メーカー
- サウジアラビア
- アラブ首長国連邦
- イスラエル
- トルコ
- アルジェリア
- エジプト
- その他
第11章 主要ベンダー分析- サプライチェーンセキュリティ業界
- 競合ダッシュボード
- 企業プロファイル
- IBM
- Microsoft
- Oracle
- SAP
- Cisco
- DHL
- FedEx
- UPS
- Honeywell
- Siemens
- Symantec
- Fortinet
- Check Point Software Technologies
- McAfee
- Accenture
- Deloitte
第12章 アナリストの全方位展望
List of Tables
- TABLE List of data sources
- TABLE Market drivers; Impact Analysis
- TABLE Market restraints; Impact Analysis
- TABLE Selector Lever Market: Component Snapshot (2022)
- TABLE Segment Dashboard; Definition and Scope, by Component
- TABLE Global Selector Lever Market, by Component 2018-2030 (USD Million)
- TABLE Selector Lever Market: Application Snapshot (2022)
- TABLE Segment Dashboard; Definition and Scope, by Application
- TABLE Global Selector Lever Market, by Application 2018-2030 (USD Million)
- TABLE Selector Lever Market: Regional snapshot (2022)
- TABLE Selector Lever Market: Vertical Snapshot (2022)
- TABLE Segment Dashboard; Definition and Scope, by Vertical
- TABLE Global Selector Lever Market, by Vertical 2018-2030 (USD Million)
- TABLE Segment Dashboard; Definition and Scope, by Region
- TABLE Global Selector Lever Market, by Region 2018-2030 (USD Million)
- TABLE North America Selector Lever Market, by Country, 2018-2030 (USD Million)
- TABLE North America Selector Lever Market, by Component, 2018-2030 (USD Million)
- TABLE North America Selector Lever Market, by Application, 2018-2030 (USD Million)
- TABLE North America Selector Lever Market, by Vertical, 2018-2030 (USD Million)
- TABLE Europe Selector Lever Market, by Country, 2018-2030 (USD Million)
- TABLE Europe Selector Lever Market, by Component, 2018-2030 (USD Million)
- TABLE Europe Selector Lever Market, by Application, 2018-2030 (USD Million)
- TABLE Europe Selector Lever Market, by Vertical, 2018-2030 (USD Million)
- TABLE Asia Pacific Selector Lever Market, by Country, 2018-2030 (USD Million)
- TABLE Asia Pacific Selector Lever Market, by Component, 2018-2030 (USD Million)
- TABLE Asia Pacific Selector Lever Market, by Application, 2018-2030 (USD Million)
- TABLE Asia Pacific Selector Lever Market, by Vertical, 2018-2030 (USD Million)
- TABLE Latin America Selector Lever Market, by Country, 2018-2030 (USD Million)
- TABLE Latin America Selector Lever Market, by Component, 2018-2030 (USD Million)
- TABLE Latin America Selector Lever Market, by Application, 2018-2030 (USD Million)
- TABLE Latin America Selector Lever Market, by Vertical, 2018-2030 (USD Million)
- TABLE Middle East and Africa Selector Lever Market, by Country, 2018-2030 (USD Million)
- TABLE Middle East and Africa Selector Lever Market, by Component, 2018-2030 (USD Million)
- TABLE Middle East and Africa Selector Lever Market, by Application, 2018-2030 (USD Million)
- TABLE Middle East and Africa Selector Lever Market, by Vertical, 2018-2030 (USD Million)
REPORT HIGHLIGHT
Supply Chain Security Market size was valued at USD 2,190.3 Million in 2022, expanding at a CAGR of 11.6% from 2023 to 2030.
Supply chain security refers to the efforts and measures taken to protect the products, goods, and services as they move from the manufacturer to the end consumer. The supply chain consists of all the stages of production, transportation, storage, and distribution of a product or service, and security must be ensured at every stage to prevent unauthorized access, tampering, theft, or loss.
Supply Chain Security Market- Market Dynamics:
The supply chain security market is primarily driven by the growing need for security threats. As global trade grows, supply chains become more complex, making them vulnerable to various security threats, including theft, piracy, cyberattacks, and terrorism. This has led to an increased demand for supply chain security solutions to mitigate these risks. Further, governments and regulatory bodies are enforcing strict regulations and standards to ensure supply chain security. For example, the International Organization for Standardization (ISO) has developed the ISO 28000 standard for supply chain security management, which outlines the best practices for managing security risks in supply chains.
Furthermore, with the growth of e-commerce and online transactions, the supply chain has become more complex and vulnerable to cyber threats. This has led to an increased demand for supply chain security solutions to protect online transactions and prevent cyber-attacks. In addition, consumers are becoming more concerned about the safety and origin of the products they purchase. As a result, there is an increasing demand for supply chain security solutions that provide transparency and traceability in the supply chain, allowing consumers to track the origin and safety of the products they purchase.
Supply Chain Security Market- Segmentation Analysis:
- The global Supply Chain Security Market is segmented on the basis of Component, Application, Vertical, and Region.
- The market is divided into three categories based on Component: hardware, software and services. Hardware segment dominates the market. The increasing demand for supply chain security solutions is contributing to segment growth.
- The market is divided into three categories based on Application: data protection, data visibility, and others. The data protection segment dominates the market and is likely to maintain its dominance during the forecast period. This is partly due to an increase in the demand for data protection due to rising number of cyber threats.
- The market is divided into six categories based on Vertical: healthcare, retail, automotive, manufacturing, food, and others. The retail segment dominates the market and is likely to maintain its dominance during the forecast period. This is partly due to an increasing e-commerce & retail sector.
Supply Chain Security Market- Geographical Insights:
Geographically, this market is widespread into the regions of North America, Latin America, Europe, Asia Pacific, and the Middle East and Africa. These regions are further divided as per the nations bringing business.
North America held the largest market share in 2021 and is projected to continue its dominance during the forecast period. The growing demand from retail sector in the U.S. is mainly contributing to market growth.
Supply Chain Security Market- Competitive Landscape:
Due to the high demand for supply chain security in the coming years, the worldwide market for Supply Chain Security is made of both international and local producers, making it one of the most competitive sectors in the world. Companies sell their Components through a variety of channels, including corporate websites. Components makers compete on a variety of aspects, including Gaming performance. Some of the primary techniques used by corporations to strengthen their reach and expand their market share include new Component launches, web network development, and mergers and acquisitions. For instance, in 2021, IBM has developed a blockchain-based supply chain solution that provides end-to-end visibility and transparency to help businesses track and manage their supply chain.
Key features of the study:
- This proposed research study on Supply Chain Security market provides market size (US$ million), compound annual growth rate (CAGR %) and forecast estimation (2023-2030), considering 2022 as the base year
- The research report elucidates potential growth opportunities across different segments/countries and explains attractive investment proposition matrix for Supply Chain Security market
- The overall report identifies new investment opportunities, challenges faced by established players, and growth factors to sustain in the Supply Chain Security market
- Impact of COVID-19 on Supply Chain Security market size, forecast, CAGR, and market dynamics are discussed in detail under the research scope. Detailed insight on Supply Chain Security market post-COVID will also be covered.
- In order to give the users of this report a comprehensive view on the Supply Chain Security market, we have also included competitive landscape and key innovator analysis for the Supply Chain Security market.
- The study encompasses a growth prospect mapping analysis, wherein all the industry segments are benchmarked based on their market size, growth rate and attractiveness.
- The report offers detailed company profiling featuring major market participants which will help users to understand their financial information and strategic initiatives of players operating in the Supply Chain Security market.
- In addition, the report also unveil the important acquisitions & mergers, collaborations & joint ventures, new launch, research & development, regional expansion of major participants involved in the market on global as well as regional level.
- The global Supply Chain Security market report primarily caters to various stakeholders in this industry including suppliers, investors, new entrants, distributors, and financial analysts
SCOPE OF THE REPORT
The scope of this report covers the market by its major segments, which include as follows:
GLOBAL SUPPLY CHAIN SECURITY MARKET KEY PLAYERS
- IBM
- Microsoft
- Oracle
- SAP
- Cisco
- DHL
- FedEx
- UPS
- Honeywell
- Siemens
- Symantec
- Fortinet
- Check Point Software Technologies
- McAfee
- Accenture
- Deloitte
GLOBAL SUPPLY CHAIN SECURITY MARKET, BY COMPONENT
- Hardware
- Software
- Services
GLOBAL SUPPLY CHAIN SECURITY MARKET, BY APPLICATION
- Data protection
- Data visibility
- Others
GLOBAL SUPPLY CHAIN SECURITY MARKET, BY VERTICAL
- Healthcare
- Retail
- Automotive
- Manufacturing
- Food
- Others
GLOBAL SUPPLY CHAIN SECURITY MARKET, BY REGION
- North America
- The U.S.
- Canada
- Europe
- Germany
- France
- Italy
- Spain
- United Kingdom
- Russia
- Netherlands
- Sweden
- Poland
- Rest of Europe
- Asia Pacific
- India
- China
- South Korea
- Japan
- Australia
- Thailand
- Indonesia
- Philippines
- Rest of APAC
- Latin America
- Brazil
- Mexico
- Argentina
- Colombia
- Rest of LATAM
- The Middle East and Africa
- Saudi Arabia
- United Arab Emirates
- Israel
- Turkey
- Algeria
- Egypt
- Rest of MEA
Table of Contents
1. Supply Chain Security Market Overview
- 1.1. Study Scope
2. Executive Summary
- 2.1. Market Snippet
- 2.1.1. Supply Chain Security Market Snippet by Component
- 2.1.2. Supply Chain Security Market Snippet by Application
- 2.1.3. Supply Chain Security Market Snippet by Vertical
- 2.1.4. Supply Chain Security Market Snippet by Country
- 2.1.5. Supply Chain Security Market Snippet by Region
- 2.2. Competitive Insights
3. Supply Chain Security Key Market Trends
- 3.1. Supply Chain Security Market Drivers
- 3.1.1. Impact Analysis of Market Drivers
- 3.2. Supply Chain Security Market Restraints
- 3.2.1. Impact Analysis of Market Restraints
- 3.3. Supply Chain Security Market Opportunities
- 3.4. Supply Chain Security Market Future Trends
4. Supply Chain Security Industry Study
- 4.1. PEST Analysis
- 4.2. Porter's Five Forces Analysis
- 4.3. Growth Prospect Mapping
- 4.4. Regulatory Framework Analysis
5. Supply Chain Security Market: COVID-19 Impact Analysis
- 5.1. Pre-COVID-19 Impact Analysis
- 5.2. Post-COVID-19 Impact Analysis
- 5.2.1. Top Performing Segments
- 5.2.2. Marginal Growth Segments
- 5.2.3. Top Looser Segments
- 5.2.4. Marginal Loss Segments
6. Supply Chain Security Market Landscape
- 6.1. Supply Chain Security Market Share Analysis, 2022
- 6.2. Breakdown Data, by Key Manufacturer
- 6.2.1. Established Players' Analysis
- 6.2.2. Emerging Players' Analysis
7. Supply Chain Security Market - By Component
- 7.1. Overview
- 7.1.1. Segment Share Analysis, By Component, 2022 & 2030 (%)
- 7.1.2. Hardware
- 7.1.3. Software
- 7.1.4. Services
8. Supply Chain Security Market - By Application
- 8.1. Overview
- 8.1.1. Segment Share Analysis, By Application, 2022 & 2030 (%)
- 8.1.2. Data protection
- 8.1.3. Data visibility
- 8.1.4. Others
9. Supply Chain Security Market - By Vertical
- 9.1. Overview
- 9.1.1. Segment Share Analysis, By Application, 2022 & 2030 (%)
- 9.1.2. Healthcare
- 9.1.3. Retail
- 9.1.4. Automotive
- 9.1.5. Manufacturing
- 9.1.6. Food
- 9.1.7. Others
10. Supply Chain Security Market- By Geography
- 10.1. Introduction
- 10.1.1. Segment Share Analysis, By Geography, 2022 & 2030 (%)
- 10.2. North America
- 10.2.1. Overview
- 10.2.2. Supply Chain Security Key Manufacturers in North America
- 10.2.3. North America Market Size and Forecast, By Country, 2018 - 2030 (US$ Million)
- 10.2.4. North America Market Size and Forecast, By Component, 2018 - 2030 (US$ Million)
- 10.2.5. North America Market Size and Forecast, By Application, 2018 - 2030 (US$ Million)
- 10.2.6. North America Market Size and Forecast, By Vertical, 2018 - 2030 (US$ Million)
- 10.2.7. U.S.
- 10.2.7.1. Overview
- 10.2.7.2. Market Analysis, Forecast, and Y-O-Y Growth Rate, 2018 - 2030, (US$ Million)
- 10.2.7.3. U.S. Market Size and Forecast, By Component, 2018 - 2030 (US$ Million)
- 10.2.7.4. U.S. Market Size and Forecast, By Application, 2018 - 2030 (US$ Million)
- 10.2.7.5. U.S. Market Size and Forecast, By Vertical, 2018 - 2030 (US$ Million)
- 10.2.8. Canada
- 10.2.8.1. Overview
- 10.2.8.2. Market Analysis, Forecast, and Y-O-Y Growth Rate, 2018 - 2030, (US$ Million)
- 10.2.8.3. Canada Market Size and Forecast, By Component, 2018 - 2030 (US$ Million)
- 10.2.8.4. Canada Market Size and Forecast, By Application, 2018 - 2030 (US$ Million)
- 10.2.8.5. Canada Market Size and Forecast, By Vertical, 2018 - 2030 (US$ Million)
- 10.3. Europe
- 10.3.1. Overview
- 10.3.2. Supply Chain Security Key Manufacturers in Europe
- 10.3.3. Europe Market Size and Forecast, By Country, 2018 - 2030 (US$ Million)
- 10.3.4. Europe Market Size and Forecast, By Component, 2018 - 2030 (US$ Million)
- 10.3.5. Europe Market Size and Forecast, By Application, 2018 - 2030 (US$ Million)
- 10.3.6. Europe Market Size and Forecast, By Vertical, 2018 - 2030 (US$ Million)
- 10.3.7. Germany
- 10.3.7.1. Overview
- 10.3.7.2. Market Analysis, Forecast, and Y-O-Y Growth Rate, 2018 - 2030, (US$ Million)
- 10.3.7.3. Germany Market Size and Forecast, By Component, 2018 - 2030 (US$ Million)
- 10.3.7.4. Germany Market Size and Forecast, By Application, 2018 - 2030 (US$ Million)
- 10.3.7.5. Germany Market Size and Forecast, By Vertical, 2018 - 2030 (US$ Million)
- 10.3.8. Italy
- 10.3.8.1. Overview
- 10.3.8.2. Market Analysis, Forecast, and Y-O-Y Growth Rate, 2018 - 2030, (US$ Million)
- 10.3.8.3. Italy Market Size and Forecast, By Component, 2018 - 2030 (US$ Million)
- 10.3.8.4. Italy Market Size and Forecast, By Application, 2018 - 2030 (US$ Million)
- 10.3.8.5. Italy Market Size and Forecast, By Vertical, 2018 - 2030 (US$ Million)
- 10.3.9. United Kingdom
- 10.3.9.1. Overview
- 10.3.9.2. Market Analysis, Forecast, and Y-O-Y Growth Rate, 2018 - 2030, (US$ Million)
- 10.3.9.3. United Kingdom Market Size and Forecast, By Component, 2018 - 2030 (US$ Million)
- 10.3.9.4. United Kingdom Market Size and Forecast, By Application, 2018 - 2030 (US$ Million)
- 10.3.9.5. United Kingdom Market Size and Forecast, By Vertical, 2018 - 2030 (US$ Million)
- 10.3.10. France
- 10.3.10.1. Overview
- 10.3.10.2. Market Analysis, Forecast, and Y-O-Y Growth Rate, 2018 - 2030, (US$ Million)
- 10.3.10.3. France Market Size and Forecast, By Component, 2018 - 2030 (US$ Million)
- 10.3.10.4. France Market Size and Forecast, By Application, 2018 - 2030 (US$ Million)
- 10.3.10.5. France Market Size and Forecast, By Vertical, 2018 - 2030 (US$ Million)
- 10.3.11. Russia
- 10.3.11.1. Market Analysis, Forecast, and Y-O-Y Growth Rate, 2018 - 2030, (US$ Million)
- 10.3.11.2. Russia Market Size and Forecast, By Component, 2018 - 2030 (US$ Million)
- 10.3.11.3. Russia Market Size and Forecast, By Application, 2018 - 2030 (US$ Million)
- 10.3.11.4. Russia Market Size and Forecast, By Vertical, 2018 - 2030 (US$ Million)
- 10.3.12. Netherlands
- 10.3.12.1. Market Analysis, Forecast, and Y-O-Y Growth Rate, 2018 - 2030, (US$ Million)
- 10.3.12.2. Netherlands Market Size and Forecast, By Component, 2018 - 2030 (US$ Million)
- 10.3.12.3. Netherlands Market Size and Forecast, By Application, 2018 - 2030 (US$ Million)
- 10.3.12.4. Netherlands Market Size and Forecast, By Vertical, 2018 - 2030 (US$ Million)
- 10.3.13. Sweden
- 10.3.13.1. Market Analysis, Forecast, and Y-O-Y Growth Rate, 2018 - 2030, (US$ Million)
- 10.3.13.2. Sweden Market Size and Forecast, By Component, 2018 - 2030 (US$ Million)
- 10.3.13.3. Sweden Market Size and Forecast, By Application, 2018 - 2030 (US$ Million)
- 10.3.13.4. Sweden Market Size and Forecast, By Vertical, 2018 - 2030 (US$ Million)
- 10.3.14. Poland
- 10.3.14.1. Market Analysis, Forecast, and Y-O-Y Growth Rate, 2018 - 2030, (US$ Million)
- 10.3.14.2. Poland Market Size and Forecast, By Component, 2018 - 2030 (US$ Million)
- 10.3.14.3. Poland Market Size and Forecast, By Application, 2018 - 2030 (US$ Million)
- 10.3.14.4. Poland Market Size and Forecast, By Vertical, 2018 - 2030 (US$ Million)
- 10.3.15. Rest of Europe
- 10.3.15.1. Overview
- 10.3.15.2. Market Analysis, Forecast, and Y-O-Y Growth Rate, 2018 - 2030, (US$ Million)
- 10.3.15.3. Rest of the Europe Market Size and Forecast, By Component, 2018 - 2030 (US$ Million)
- 10.3.15.4. Rest of the Europe Market Size and Forecast, By Application, 2018 - 2030 (US$ Million)
- 10.3.15.5. Rest of the Europe Market Size and Forecast, By Vertical, 2018 - 2030 (US$ Million)
- 10.4. Asia Pacific (APAC)
- 10.4.1. Overview
- 10.4.2. Supply Chain Security Key Manufacturers in Asia Pacific
- 10.4.3. Asia Pacific Market Size and Forecast, By Country, 2018 - 2030 (US$ Million)
- 10.4.4. Asia Pacific Market Size and Forecast, By Component, 2018 - 2030 (US$ Million)
- 10.4.5. Asia Pacific Market Size and Forecast, By Application, 2018 - 2030 (US$ Million)
- 10.4.6. Asia Pacific Market Size and Forecast, By Vertical, 2018 - 2030 (US$ Million)
- 10.4.7. India
- 10.4.7.1. Overview
- 10.4.7.2. Market Analysis, Forecast, and Y-O-Y Growth Rate, 2018 - 2030, (US$ Million)
- 10.4.7.3. India Market Size and Forecast, By Component, 2018 - 2030 (US$ Million)
- 10.4.7.4. India Market Size and Forecast, By Application, 2018 - 2030 (US$ Million)
- 10.4.7.5. India Market Size and Forecast, By Vertical, 2018 - 2030 (US$ Million)
- 10.4.8. China
- 10.4.8.1. Overview
- 10.4.8.2. Market Analysis, Forecast, and Y-O-Y Growth Rate, 2018 - 2030, (US$ Million)
- 10.4.8.3. China Market Size and Forecast, By Component, 2018 - 2030 (US$ Million)
- 10.4.8.4. China Market Size and Forecast, By Application, 2018 - 2030 (US$ Million)
- 10.4.8.5. China Market Size and Forecast, By Vertical, 2018 - 2030 (US$ Million)
- 10.4.9. Japan
- 10.4.9.1. Overview
- 10.4.9.2. Market Analysis, Forecast, and Y-O-Y Growth Rate, 2018 - 2030, (US$ Million)
- 10.4.9.3. Japan Market Size and Forecast, By Component, 2018 - 2030 (US$ Million)
- 10.4.9.4. Japan Market Size and Forecast, By Application, 2018 - 2030 (US$ Million)
- 10.4.9.5. Japan Market Size and Forecast, By Vertical, 2018 - 2030 (US$ Million)
- 10.4.10. South Korea
- 10.4.10.1. Overview
- 10.4.10.2. Market Analysis, Forecast, and Y-O-Y Growth Rate, 2018 - 2030, (US$ Million)
- 10.4.10.3. South Korea Market Size and Forecast, By Component, 2018 - 2030 (US$ Million)
- 10.4.10.4. South Korea Market Size and Forecast, By Application, 2018 - 2030 (US$ Million)
- 10.4.10.5. South Korea Market Size and Forecast, By Vertical, 2018 - 2030 (US$ Million)
- 10.4.11. Australia
- 10.4.11.1. Overview
- 10.4.11.2. Market Analysis, Forecast, and Y-O-Y Growth Rate, 2018 - 2030, (US$ Million)
- 10.4.11.3. Australia Market Size and Forecast, By Component, 2018 - 2030 (US$ Million)
- 10.4.11.4. Australia Market Size and Forecast, By Application, 2018 - 2030 (US$ Million)
- 10.4.11.5. Australia Market Size and Forecast, By Vertical, 2018 - 2030 (US$ Million)
- 10.4.12. Thailand
- 10.4.12.1. Overview
- 10.4.12.2. Market Analysis, Forecast, and Y-O-Y Growth Rate, 2018 - 2030, (US$ Million)
- 10.4.12.3. Thailand Market Size and Forecast, By Component, 2018 - 2030 (US$ Million)
- 10.4.12.4. Thailand Market Size and Forecast, By Application, 2018 - 2030 (US$ Million)
- 10.4.12.5. Thailand Market Size and Forecast, By Vertical, 2018 - 2030 (US$ Million)
- 10.4.13. Indonesia
- 10.4.13.1. Overview
- 10.4.13.2. Market Analysis, Forecast, and Y-O-Y Growth Rate, 2018 - 2030, (US$ Million)
- 10.4.13.3. Indonesia Market Size and Forecast, By Component, 2018 - 2030 (US$ Million)
- 10.4.13.4. Indonesia Market Size and Forecast, By Application, 2018 - 2030 (US$ Million)
- 10.4.13.5. Indonesia Market Size and Forecast, By Vertical, 2018 - 2030 (US$ Million)
- 10.4.14. Philippines
- 10.4.14.1. Overview
- 10.4.14.2. Market Analysis, Forecast, and Y-O-Y Growth Rate, 2018 - 2030, (US$ Million)
- 10.4.14.3. Philippines Market Size and Forecast, By Component, 2018 - 2030 (US$ Million)
- 10.4.14.4. Philippines Market Size and Forecast, By Application, 2018 - 2030 (US$ Million)
- 10.4.14.5. Philippines Market Size and Forecast, By Vertical, 2018 - 2030 (US$ Million)
- 10.4.15. Rest of APAC
- 10.4.15.1. Overview
- 10.4.15.2. Market Analysis, Forecast, and Y-O-Y Growth Rate, 2018 - 2030, (US$ Million)
- 10.4.15.3. Rest of APAC Market Size and Forecast, By Component, 2018 - 2030 (US$ Million)
- 10.4.15.4. Rest of APAC Market Size and Forecast, By Application, 2018 - 2030 (US$ Million)
- 10.4.15.5. Rest of APAC Market Size and Forecast, By Vertical, 2018 - 2030 (US$ Million)
- 10.5. Latin America
- 10.5.1. Overview
- 10.5.2. Supply Chain Security Key Manufacturers in Latin America
- 10.5.3. Latin America Market Size and Forecast, By Country, 2018 - 2030 (US$ Million)
- 10.5.4. Latin America Market Size and Forecast, By Component, 2018 - 2030 (US$ Million)
- 10.5.5. Latin America Market Size and Forecast, By Application, 2018 - 2030 (US$ Million)
- 10.5.6. Latin America Market Size and Forecast, By Vertical, 2018 - 2030 (US$ Million)
- 10.5.7. Brazil
- 10.5.7.1. Overview
- 10.5.7.2. Market Analysis, Forecast, and Y-O-Y Growth Rate, 2018 - 2030, (US$ Million)
- 10.5.7.3. Brazil Market Size and Forecast, By Component, 2018 - 2030 (US$ Million)
- 10.5.7.4. Brazil Market Size and Forecast, By Application, 2018 - 2030 (US$ Million)
- 10.5.7.5. Brazil Market Size and Forecast, By Vertical, 2018 - 2030 (US$ Million)
- 10.5.8. Mexico
- 10.5.8.1. Overview
- 10.5.8.2. Market Analysis, Forecast, and Y-O-Y Growth Rate, 2018 - 2030, (US$ Million)
- 10.5.8.3. Mexico Market Size and Forecast, By Component, 2018 - 2030 (US$ Million)
- 10.5.8.4. Mexico Market Size and Forecast, By Application, 2018 - 2030 (US$ Million)
- 10.5.8.5. Mexico Market Size and Forecast, By Vertical, 2018 - 2030 (US$ Million)
- 10.5.9. Argentina
- 10.5.9.1. Overview
- 10.5.9.2. Market Analysis, Forecast, and Y-O-Y Growth Rate, 2018 - 2030, (US$ Million)
- 10.5.9.3. Argentina Market Size and Forecast, By Component, 2018 - 2030 (US$ Million)
- 10.5.9.4. Argentina Market Size and Forecast, By Application, 2018 - 2030 (US$ Million)
- 10.5.9.5. Argentina Market Size and Forecast, By Vertical, 2018 - 2030 (US$ Million)
- 10.5.10. Colombia
- 10.5.10.1. Overview
- 10.5.10.2. Market Analysis, Forecast, and Y-O-Y Growth Rate, 2018 - 2030, (US$ Million)
- 10.5.10.3. Colombia Market Size and Forecast, By Component, 2018 - 2030 (US$ Million)
- 10.5.10.4. Colombia Market Size and Forecast, By Application, 2018 - 2030 (US$ Million)
- 10.5.10.5. Colombia Market Size and Forecast, By Vertical, 2018 - 2030 (US$ Million)
- 10.5.11. Rest of LATAM
- 10.5.11.1. Overview
- 10.5.11.2. Market Analysis, Forecast, and Y-O-Y Growth Rate, 2018 - 2030, (US$ Million)
- 10.5.11.3. Rest of LATAM Market Size and Forecast, By Component, 2018 - 2030 (US$ Million)
- 10.5.11.4. Rest of LATAM Market Size and Forecast, By Application, 2018 - 2030 (US$ Million)
- 10.5.11.5. Rest of LATAM Market Size and Forecast, By Vertical, 2018 - 2030 (US$ Million)
- 10.6. Middle East and Africa
- 10.6.1. Overview
- 10.6.2. Supply Chain Security Key Manufacturers in Middle East and Africa
- 10.6.3. Middle East and Africa Market Size and Forecast, By Country, 2018 - 2030 (US$ Million)
- 10.6.4. Middle East and Africa Market Size and Forecast, By Component, 2018 - 2030 (US$ Million)
- 10.6.5. Middle East and Africa Market Size and Forecast, By Application, 2018 - 2030 (US$ Million)
- 10.6.6. Middle East and Africa Market Size and Forecast, By Vertical, 2018 - 2030 (US$ Million)
- 10.6.7. Saudi Arabia
- 10.6.7.1. Overview
- 10.6.7.2. Market Analysis, Forecast, and Y-O-Y Growth Rate, 2018 - 2030, (US$ Million)
- 10.6.7.3. Saudi Arabia Market Size and Forecast, By Component, 2018 - 2030 (US$ Million)
- 10.6.7.4. Saudi Arabia Market Size and Forecast, By Application, 2018 - 2030 (US$ Million)
- 10.6.7.5. Saudi Arabia Market Size and Forecast, By Vertical, 2018 - 2030 (US$ Million)
- 10.6.8. United Arab Emirates
- 10.6.8.1. Overview
- 10.6.8.2. Market Analysis, Forecast, and Y-O-Y Growth Rate, 2018 - 2030, (US$ Million)
- 10.6.8.3. United Arab Emirates Market Size and Forecast, By Component, 2018 - 2030 (US$ Million)
- 10.6.8.4. United Arab Emirates Market Size and Forecast, By Application, 2018 - 2030 (US$ Million)
- 10.6.8.5. United Arab Emirates Market Size and Forecast, By Vertical, 2018 - 2030 (US$ Million)
- 10.6.9. Israel
- 10.6.9.1. Overview
- 10.6.9.2. Market Analysis, Forecast, and Y-O-Y Growth Rate, 2018 - 2030, (US$ Million)
- 10.6.9.3. Israel Market Size and Forecast, By Component, 2018 - 2030 (US$ Million)
- 10.6.9.4. Israel Market Size and Forecast, By Application, 2018 - 2030 (US$ Million)
- 10.6.9.5. Israel Market Size and Forecast, By Vertical, 2018 - 2030 (US$ Million)
- 10.6.10. Turkey
- 10.6.10.1. Overview
- 10.6.10.2. Market Analysis, Forecast, and Y-O-Y Growth Rate, 2018 - 2030, (US$ Million)
- 10.6.10.3. Turkey Market Size and Forecast, By Component, 2018 - 2030 (US$ Million)
- 10.6.10.4. Turkey Market Size and Forecast, By Application, 2018 - 2030 (US$ Million)
- 10.6.10.5. Turkey Market Size and Forecast, By Vertical, 2018 - 2030 (US$ Million)
- 10.6.11. Algeria
- 10.6.11.1. Overview
- 10.6.11.2. Market Analysis, Forecast, and Y-O-Y Growth Rate, 2018 - 2030, (US$ Million)
- 10.6.11.3. Algeria Market Size and Forecast, By Component, 2018 - 2030 (US$ Million)
- 10.6.11.4. Algeria Market Size and Forecast, By Application, 2018 - 2030 (US$ Million)
- 10.6.11.5. Algeria Market Size and Forecast, By Vertical, 2018 - 2030 (US$ Million)
- 10.6.12. Egypt
- 10.6.12.1. Overview
- 10.6.12.2. Market Analysis, Forecast, and Y-O-Y Growth Rate, 2018 - 2030, (US$ Million)
- 10.6.12.3. Egypt Market Size and Forecast, By Component, 2018 - 2030 (US$ Million)
- 10.6.12.4. Egypt Market Size and Forecast, By Application, 2018 - 2030 (US$ Million)
- 10.6.12.5. Egypt Market Size and Forecast, By Vertical, 2018 - 2030 (US$ Million)
- 10.6.13. Rest of MEA
- 10.6.13.1. Overview
- 10.6.13.2. Market Analysis, Forecast, and Y-O-Y Growth Rate, 2018 - 2030, (US$ Million)
- 10.6.13.3. Rest of MEA Market Size and Forecast, By Component, 2018 - 2030 (US$ Million)
- 10.6.13.4. Rest of MEA Market Size and Forecast, By Application, 2018 - 2030 (US$ Million)
- 10.6.13.5. Rest of MEA Market Size and Forecast, By Vertical, 2018 - 2030 (US$ Million)
11. Key Vendor Analysis- Supply Chain Security Industry
- 11.1. Competitive Dashboard
- 11.2. Company Profiles
- 11.2.1. IBM
- 11.2.2. Microsoft
- 11.2.3. Oracle
- 11.2.4. SAP
- 11.2.5. Cisco
- 11.2.6. DHL
- 11.2.7. FedEx
- 11.2.8. UPS
- 11.2.9. Honeywell
- 11.2.10. Siemens
- 11.2.11. Symantec
- 11.2.12. Fortinet
- 11.2.13. Check Point Software Technologies
- 11.2.14. McAfee
- 11.2.15. Accenture
- 11.2.16. Deloitte
12. 360 Degree Analyst View
13. Appendix
- 13.1. Research Methodology
- 13.2. References
- 13.3. Abbreviations
- 13.4. Disclaimer
- 13.5. Contact Us