|
|
市場調査レポート
商品コード
1174534
アデノ随伴ウイルスベクターの世界市場(2022年~2028年):COVID-19の影響分析、治療法別、遺伝子導入方法別、用途別、地域別 - 業界分析、市場規模、市場シェア、予測Adeno-Associated Viral Vector Market with COVID-19 Impact Analysis, By Therapy, By Gene Delivery Method, Application, and By Region - Industry Analysis, Market Size, Market Share & Forecast from 2022-2028 |
||||||
|
|
|||||||
|
● お客様のご希望に応じて、既存データの加工や未掲載情報(例:国別セグメント)の追加などの対応が可能です。 詳細はお問い合わせください。 |
|||||||


| アデノ随伴ウイルスベクターの世界市場(2022年~2028年):COVID-19の影響分析、治療法別、遺伝子導入方法別、用途別、地域別 - 業界分析、市場規模、市場シェア、予測 |
|
出版日: 2022年12月01日
発行: AnalystView Market Insights
ページ情報: 英文 305 Pages
納期: 2~3営業日
|
- 全表示
- 概要
- 図表
- 目次
世界のアデノ随伴ウイルスベクターの市場規模は、2021年に3億2,070万米ドルとなり、2022年~2028年の予測期間中に15.2%のCAGRで拡大すると予想されています。
当レポートでは、世界のアデノ随伴ウイルスベクター市場を調査し、市場の概要、市場の促進要因・抑制要因の分析、市場機会、COVID-19の影響、セグメント別の市場分析、競合情勢、主要企業のプロファイルなど、体系的な情報を提供しています。
目次
第1章 アデノ随伴ウイルスベクター市場:概要
第2章 エグゼクティブサマリー
- 市場内訳
- 治療法別
- 遺伝子導入方法別
- 用途別
- 国別
- 地域別
- 競合洞察
第3章 アデノ随伴ウイルスベクター市場:主要な動向
- 市場促進要因
- 市場促進要因の影響分析
- 市場抑制要因
- 市場抑制要因の影響分析
- 市場機会
- 市場の将来の動向
第4章 アデノ随伴ウイルスベクター:業界調査
- PEST分析
- ポーターのファイブフォース分析
- 成長見通しのマッピング
- 規制の枠組みの分析
第5章 アデノ随伴ウイルスベクター市場:COVID-19の影響分析
- COVID-19以前の影響分析
- COVID-19以後の影響分析
第6章 アデノ随伴ウイルスベクター市場:情勢
- 市場シェア分析(2021年)
- 主要メーカー別の内訳データ
- 確立された企業の分析
- 新興企業の分析
第7章 アデノ随伴ウイルスベクター市場:治療法別
- 概要
第8章 アデノ随伴ウイルスベクター市場:遺伝子導入方法別
- 概要
第9章 アデノ随伴ウイルスベクター市場:用途別
- 概要
第10章 アデノ随伴ウイルスベクター市場:地域別
- イントロダクション
- 北米
- 欧州
- アジア太平洋地域
- ラテンアメリカ
- 中東・アフリカ
第11章 ベンダー分析
- 競合ダッシュボード
- 企業プロファイル
- Thermo Fisher Scientific, Inc.
- Abeona Therapeutics
- Aldevron
- Oxford BioMedica
- Sanofi
- WuXi AppTec
- Yposkesi
- E Cognate BioServices Inc.
- Finvector
- Fujifilm Holdings
- Kaneka Corporation
- Merck KGaA
- Uniqure NV
- Oxford BioMedica PLC
- Johnson &Johnson
第12章 アナリストの包括的展望
第13章 付録
List of Tables
- TABLE List of data sources
- TABLE Market drivers; Impact Analysis
- TABLE Market restraints; Impact Analysis
- TABLE Adeno-Associated Viral Vector Market: Therapy Snapshot (2021)
- TABLE Segment Dashboard; Definition and Scope, by Therapy
- TABLE Global Adeno-Associated Viral Vector Market, by Therapy 2017-2028 (USD Million)
- TABLE Adeno-Associated Viral Vector Market: Gene Delivery Method Snapshot (2021)
- TABLE Segment Dashboard; Definition and Scope, by Gene Delivery Method
- TABLE Global Adeno-Associated Viral Vector Market, by Gene Delivery Method 2017-2028 (USD Million)
- TABLE Adeno-Associated Viral Vector Market: Regional snapshot (2021)
- TABLE Adeno-Associated Viral Vector Market: Application Snapshot (2021)
- TABLE Segment Dashboard; Definition and Scope, by Application
- TABLE Global Adeno-Associated Viral Vector Market, by Application 2017-2028 (USD Million)
- TABLE Segment Dashboard; Definition and Scope, by Region
- TABLE Global Adeno-Associated Viral Vector Market, by Region 2017-2028 (USD Million)
- TABLE North America Adeno-Associated Viral Vector Market, by Country, 2017-2028 (USD Million)
- TABLE North America Adeno-Associated Viral Vector Market, by Therapy, 2017-2028 (USD Million)
- TABLE North America Adeno-Associated Viral Vector Market, by Gene Delivery Method, 2017-2028 (USD Million)
- TABLE North America Adeno-Associated Viral Vector Market, by Application, 2017-2028 (USD Million)
- TABLE Europe Adeno-Associated Viral Vector Market, by Country, 2017-2028 (USD Million)
- TABLE Europe Adeno-Associated Viral Vector Market, by Therapy, 2017-2028 (USD Million)
- TABLE Europe Adeno-Associated Viral Vector Market, by Gene Delivery Method, 2017-2028 (USD Million)
- TABLE Europe Adeno-Associated Viral Vector Market, by Application, 2017-2028 (USD Million)
- TABLE Asia Pacific Adeno-Associated Viral Vector Market, by Country, 2017-2028 (USD Million)
- TABLE Asia Pacific Adeno-Associated Viral Vector Market, by Therapy, 2017-2028 (USD Million)
- TABLE Asia Pacific Adeno-Associated Viral Vector Market, by Gene Delivery Method, 2017-2028 (USD Million)
- TABLE Asia Pacific Adeno-Associated Viral Vector Market, by Application, 2017-2028 (USD Million)
- TABLE Latin America Adeno-Associated Viral Vector Market, by Country, 2017-2028 (USD Million)
- TABLE Latin America Adeno-Associated Viral Vector Market, by Therapy, 2017-2028 (USD Million)
- TABLE Latin America Adeno-Associated Viral Vector Market, by Gene Delivery Method, 2017-2028 (USD Million)
- TABLE Latin America Adeno-Associated Viral Vector Market, by Application, 2017-2028 (USD Million)
- TABLE Middle East and Africa Adeno-Associated Viral Vector Market, by Country, 2017-2028 (USD Million)
- TABLE Middle East and Africa Adeno-Associated Viral Vector Market, by Therapy, 2017-2028 (USD Million)
- TABLE Middle East and Africa Adeno-Associated Viral Vector Market, by Gene Delivery Method, 2017-2028 (USD Million)
- TABLE Middle East and Africa Adeno-Associated Viral Vector Market, by Application, 2017-2028 (USD Million)
List of Figures
- FIGURE Adeno-Associated Viral Vector Market Segmentation
- FIGURE Market research methodology
- FIGURE Value chain analysis
- FIGURE Porter's Five Forces Analysis
- FIGURE Market Attractiveness Analysis
- FIGURE COVID-19 Impact Analysis
- FIGURE Pre & Post COVID-19 Impact Comparision Study
- FIGURE Competitive Landscape; Key company market share analysis, 2021
- FIGURE Therapy segment market share analysis, 2021 & 2028
- FIGURE Therapy segment market size forecast and trend analysis, 2017 to 2028 (USD Million)
- FIGURE Gene Delivery Method segment market share analysis, 2021 & 2028
- FIGURE Gene Delivery Method segment market size forecast and trend analysis, 2017 to 2028 (USD Million)
- FIGURE Application segment market share analysis, 2021 & 2028
- FIGURE Application segment market size forecast and trend analysis, 2017 to 2028 (USD Million)
- FIGURE Regional segment market share analysis, 2021 & 2028
- FIGURE Regional segment market size forecast and trend analysis, 2017 to 2028 (USD Million)
- FIGURE North America Adeno-Associated Viral Vector Market share and leading players, 2021
- FIGURE Europe Adeno-Associated Viral Vector Market share and leading players, 2021
- FIGURE Asia Pacific Adeno-Associated Viral Vector Market share and leading players, 2021
- FIGURE Latin America Adeno-Associated Viral Vector Market share and leading players, 2021
- FIGURE Middle East and Africa Adeno-Associated Viral Vector Market share and leading players, 2021
- FIGURE North America market share analysis by country, 2021
- FIGURE U.S. Adeno-Associated Viral Vector Market size, forecast and trend analysis, 2017 to 2028 (USD Million)
- FIGURE Canada Adeno-Associated Viral Vector Market size, forecast and trend analysis, 2017 to 2028 (USD Million)
- FIGURE Europe Adeno-Associated Viral Vector Market share analysis by country, 2021
- FIGURE Germany Adeno-Associated Viral Vector Market size, forecast and trend analysis, 2017 to 2028 (USD Million)
- FIGURE Spain Adeno-Associated Viral Vector Market size, forecast and trend analysis, 2017 to 2028 (USD Million)
- FIGURE Italy Adeno-Associated Viral Vector Market size, forecast and trend analysis, 2017 to 2028 (USD Million)
- FIGURE France Adeno-Associated Viral Vector Market size, forecast and trend analysis, 2017 to 2028 (USD Million)
- FIGURE UK Adeno-Associated Viral Vector Market size, forecast and trend analysis, 2017 to 2028 (USD Million)
- FIGURE Russia Adeno-Associated Viral Vector Market size, forecast and trend analysis, 2017 to 2028 (USD Million)
- FIGURE Netherlands Adeno-Associated Viral Vector Market size, forecast and trend analysis, 2017 to 2028 (USD Million)
- FIGURE Sweden Adeno-Associated Viral Vector Market size, forecast and trend analysis, 2017 to 2028 (USD Million)
- FIGURE Poland Adeno-Associated Viral Vector Market size, forecast and trend analysis, 2017 to 2028 (USD Million)
- FIGURE Rest of the Europe Adeno-Associated Viral Vector Market size, forecast and trend analysis, 2017 to 2028 (USD Million)
- FIGURE Asia Pacific Adeno-Associated Viral Vector Market share analysis by country, 2021
- FIGURE India Adeno-Associated Viral Vector Market size, forecast and trend analysis, 2017 to 2028 (USD Million)
- FIGURE China Adeno-Associated Viral Vector Market size, forecast and trend analysis, 2017 to 2028 (USD Million)
- FIGURE Japan Adeno-Associated Viral Vector Market size, forecast and trend analysis, 2017 to 2028 (USD Million)
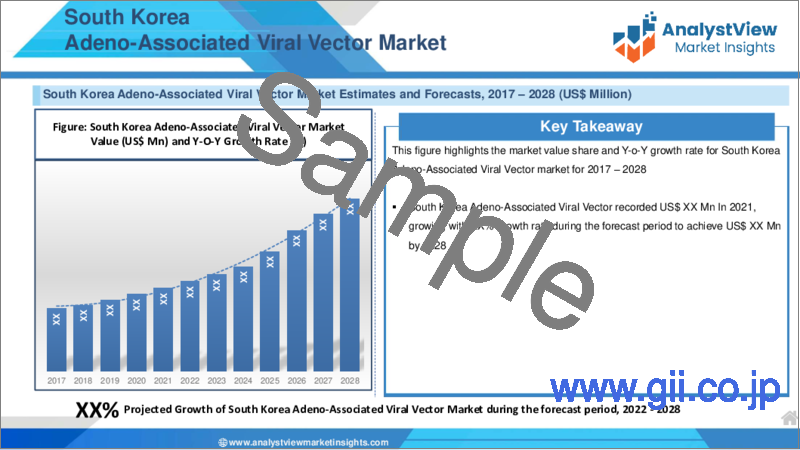
- FIGURE South Korea Adeno-Associated Viral Vector Market size, forecast and trend analysis, 2017 to 2028 (USD Million)
- FIGURE Australia Adeno-Associated Viral Vector Market size, forecast and trend analysis, 2017 to 2028 (USD Million)
- FIGURE Thailand Adeno-Associated Viral Vector Market size, forecast and trend analysis, 2017 to 2028 (USD Million)
- FIGURE Indonesia Adeno-Associated Viral Vector Market size, forecast and trend analysis, 2017 to 2028 (USD Million)
- FIGURE Phillipines Adeno-Associated Viral Vector Market size, forecast and trend analysis, 2017 to 2028 (USD Million)
- FIGURE Rest of APAC Adeno-Associated Viral Vector Market size, forecast and trend analysis, 2017 to 2028 (USD Million)
- FIGURE Latin America Adeno-Associated Viral Vector Market size, forecast and trend analysis, 2017 to 2028 (USD Million)
- FIGURE Latin America Adeno-Associated Viral Vector Market share analysis by country, 2021
- FIGURE Brazil Adeno-Associated Viral Vector Market size, forecast and trend analysis, 2017 to 2028 (USD Million)
- FIGURE Mexico Adeno-Associated Viral Vector Market size, forecast and trend analysis, 2017 to 2028 (USD Million)
- FIGURE Argentina Adeno-Associated Viral Vector Market size, forecast and trend analysis, 2017 to 2028 (USD Million)
- FIGURE Colombia Adeno-Associated Viral Vector Market size, forecast and trend analysis, 2017 to 2028 (USD Million)
- FIGURE Rest of LATAM Adeno-Associated Viral Vector Market size, forecast and trend analysis, 2017 to 2028 (USD Million)
- FIGURE Middle East and Africa Adeno-Associated Viral Vector Market size, forecast and trend analysis, 2017 to 2028 (USD Million)
- FIGURE Middle East and Africa Adeno-Associated Viral Vector Market share analysis by country, 2021
- FIGURE Saudi Arabia Adeno-Associated Viral Vector Market size, forecast and trend analysis, 2017 to 2028 (USD Million)
- FIGURE United Arab Emirates Adeno-Associated Viral Vector Market size, forecast and trend analysis, 2017 to 2028 (USD Million)
- FIGURE Israel Adeno-Associated Viral Vector Market size, forecast and trend analysis, 2017 to 2028 (USD Million)
- FIGURE Turkey Adeno-Associated Viral Vector Market size, forecast and trend analysis, 2017 to 2028 (USD Million)
- FIGURE Algeria Adeno-Associated Viral Vector Market size, forecast and trend analysis, 2017 to 2028 (USD Million)
- FIGURE Egypt Adeno-Associated Viral Vector Market size, forecast and trend analysis, 2017 to 2028 (USD Million)
- FIGURE Rest of MEA Adeno-Associated Viral Vector Market size, forecast and trend analysis, 2017 to 2028 (USD Million)
Reprt Highlight:
Adeno-Associated Viral Vector Market size was valued at USD 320.7 Million in 2021, expanding at a CAGR of 15.2% from 2022 to 2028.
The most effective method for delivering genes to cure a range of human disorders is through adeno-associated virus (AAV) vectors. Single-stranded DNA parvoviruses called adeno-associated viral (AAV) vectors are replication-defective and need a helper ad to replicate.
Market Dynamics
The adeno-associated viral vectors have witnessed high demand for medical treatment in the past few years which, in turn, is expected to boost the market growth. The adeno-associated viral vectors have attracted a lot of interest in the medical world because of their distinctive biology, straightforward structure, and lack of disease connection. In reality, a number of adeno-associated viral vector-based medicines have been created for the treatment of numerous diseases, such as Duchenne muscular dystrophy, cystic fibrosis, and retinitis pigmentosa. As a result, the market has benefited financially from the significant increase in demand for these vectors. The increase in the incidence of cancer and modern healthcare facilities across the globe are acting as key drivers for the growth of the market.
Furthermore, the potential for new product discoveries is growing due to the rising research and development efforts for the creation of viral vector vaccines or treatments. For instance, in September 2021, researchers from the University of Oxford and the Ludwig Institute for Cancer Research will develop a vaccine to cure cancer, building on the success of the Oxford-AstraZeneca vaccine against SARS-CoV-2. When used in conjunction with immunotherapy, a viral vector cancer vaccine decreases tumor size and raises survival rates in mice models by effectively inducing anti-tumor immune responses. Numerous viral vectors have been developed for use in cancer treatment and prevention. Suicide gene therapy, oncolytic virotherapy, anti-angiogenesis, and therapeutic gene vaccines are just a few of the gene therapy treatments that have been developed to treat a variety of tumors. Additionally, a lot of industry participants have developed fresh medical tools and tests for COVID-19 testing amidst the COVID-19 pandemic.
Segmentation Analysis:
The Global Adeno-Associated Viral Vector Market is segmented on the basis of Therapy, Gene Delivery Method, Application, and Region.
The market is split into three categories based on Therapy: gene augmentation, immunotherapy, and others. The gene augmentation segment dominates the market. Growing demand for gene detection of disease is mainly contributing to segment growth.
The market is segmented into two categories based on Gene Delivery Method: Ex vivo, and In vivo. The Ex vivo segment dominates the market and is likely to maintain its dominance during the forecast period. This is partly due to an increase in the demand for clinical and diagnostics needs.
The market is segmented into three categories based on Application: gene therapy, cell therapy, and vaccines. The gene therapy segment dominates the market and is likely to maintain its dominance during the forecast period. This is partly due to an increase in the need for genetic disorders.
Competitive Landscape:
The worldwide market for adeno-associated viral vectors is moderately fragmented and comprised of large and small-sized market players with a few large ones dominating the global market share. The companies in the market emphasize adopting aggressive strategies to reach out large consumer base. Some of the primary techniques used by corporations to strengthen their reach and expand their market share include new Therapy launches, partnerships, distribution network development, R&D spending, and mergers and acquisitions.
For instance, in May 2022, Ultragenyx acquires global rights to AAV Gene Therapy ABO-102 for Sanfilippo syndrome Type A (MPS IIIA) from Abeona Therapeutics.
Key features of the study:
- This proposed research study on Adeno-Associated Viral Vector market provides market size (US$ million), compound annual growth rate (CAGR %) and forecast estimation (2022-2028), considering 2021 as the base year
- The research report elucidates potential growth opportunities across different segments/countries and explains attractive investment proposition matrix for Adeno-Associated Viral Vector market
- The overall report identifies new investment opportunities, challenges faced by established players, and growth factors to sustain in the Adeno-Associated Viral Vector market
- Impact of COVID-19 on Adeno-Associated Viral Vector market size, forecast, CAGR, and market dynamics are discussed in detail under the research scope. Detailed insight on Adeno-Associated Viral Vector market post-COVID will also be covered.
- In order to give the users of this report a comprehensive view on the Adeno-Associated Viral Vector market, we have also included competitive landscape and key innovator analysis for the Adeno-Associated Viral Vector market.
- The study encompasses a growth prospect mapping analysis, wherein all the industry segments are benchmarked based on their market size, growth rate and attractiveness.
- The report offers detailed company profiling featuring major market participants which will help users to understand their financial information and strategic initiatives of players operating in the Adeno-Associated Viral Vector market.
- In addition, the report also unveil the important acquisitions & mergers, collaborations & joint ventures, new launch, research & development, regional expansion of major participants involved in the market on global as well as regional level.
- The global Adeno-Associated Viral Vector market report primarily caters to various stakeholders in this industry including suppliers, investors, new entrants, distributors, and financial analysts
SCOPE OF THE REPORT
The scope of this report covers the market by its major segments, which include as follows:
GLOBAL ADENO-ASSOCIATED VIRAL VECTOR MARKET KEY PLAYERS
- Thermo Fisher Scientific, Inc.
- Abeona Therapeutics
- Aldevron
- Oxford BioMedica
- Sanofi
- WuXi AppTec
- Yposkesi
- E Cognate BioServices Inc.
- Finvector
- Fujifilm Holdings
- Kaneka Corporation
- Merck KGaA
- Uniqure NV
- Oxford BioMedica PLC
- Johnson & Johnson
GLOBAL ADENO-ASSOCIATED VIRAL VECTOR MARKET, BY THERAPY
- Gene augmentation
- Immunotherapy
- Others
GLOBAL ADENO-ASSOCIATED VIRAL VECTOR MARKET, BY GENE DELIVERY METHOD
- Ex Vivo
- In vivo
GLOBAL ADENO-ASSOCIATED VIRAL VECTOR MARKET, BY APPLICATION
- Gene therapy
- Cell therapy
- Vaccines
GLOBAL ADENO-ASSOCIATED VIRAL VECTOR MARKET, BY REGION
- North America
- The U.S.
- Canada
- Europe
- Germany
- France
- Italy
- Spain
- United Kingdom
- Russia
- Netherlands
- Sweden
- Poland
- Rest of Europe
- Asia Pacific
- India
- China
- South Korea
- Japan
- Australia
- Thailand
- Indonesia
- Philippines
- Rest of APAC
- Latin America
- Brazil
- Mexico
- Argentina
- Colombia
- Rest of LATAM
- The Middle East and Africa
- Saudi Arabia
- United Arab Emirates
- Israel
- Turkey
- Algeria
- Egypt
- Rest of MEA
Table of Contents
1. Adeno-Associated Viral Vector Market Overview
- 1.1. Study Scope
2. Executive Summary
- 2.1. Market Snippet
- 2.1.1. Market Snippet by Therapy
- 2.1.2. Market Snippet by Gene Delivery Method
- 2.1.3. Market Snippet by Application
- 2.1.4. Market Snippet by Country
- 2.1.5. Market Snippet by Region
- 2.2. Competitive Insights
3. Adeno-Associated Viral Vector Key Market Trends
- 3.1. Market Drivers
- 3.1.1. Impact Analysis of Market Drivers
- 3.2. Market Restraints
- 3.2.1. Impact Analysis of Market Restraints
- 3.3. Market Opportunities
- 3.4. Market Future Trends
4. Adeno-Associated Viral Vector Industry Study
- 4.1. PEST Analysis
- 4.2. Porter's Five Forces Analysis
- 4.3. Growth Prospect Mapping
- 4.4. Regulatory Framework Analysis
5. Adeno-Associated Viral Vector Market: COVID-19 Impact Analysis
- 5.1. Pre-COVID-19 Impact Analysis
- 5.2. Post-COVID-19 Impact Analysis
- 5.2.1. Top Performing Segments
- 5.2.2. Marginal Growth Segments
- 5.2.3. Top Looser Segments
- 5.2.4. Marginal Loss Segments
6. Adeno-Associated Viral Vector Market Landscape
- 6.1. Market Share Analysis, 2021
- 6.2. Breakdown Data, by Key Manufacturer
- 6.2.1. Established Players' Analysis
- 6.2.2. Emerging Players' Analysis
7. Adeno-Associated Viral Vector Market - By Therapy
- 7.1. Overview
- 7.1.1. Segment Share Analysis, By Therapy, 2021 & 2028 (%)
- 7.1.2. Gene augmentation
- 7.1.3. Immunotherapy
- 7.1.4. Others
8. Adeno-Associated Viral Vector Market - By Gene Delivery Method
- 8.1. Overview
- 8.1.1. Segment Share Analysis, By Gene Delivery Method, 2021 & 2028 (%)
- 8.1.2. Ex Vivo
- 8.1.3. In vivo
9. Adeno-Associated Viral Vector Market - By Application
- 9.1. Overview
- 9.1.1. Segment Share Analysis, By Gene Delivery Method, 2021 & 2028 (%)
- 9.1.2. Gene therapy
- 9.1.3. Cell therapy
- 9.1.4. Vaccines
10. Adeno-Associated Viral Vector Market- By Geography
- 10.1. Introduction
- 10.1.1. Segment Share Analysis, By Geography, 2021 & 2028 (%)
- 10.2. North America
- 10.2.1. Overview
- 10.2.2. Key Manufacturers in North America
- 10.2.3. North America Market Size and Forecast, By Country, 2017 - 2028 (US$ Million)
- 10.2.4. North America Market Size and Forecast, By Therapy, 2017 - 2028 (US$ Million)
- 10.2.5. North America Market Size and Forecast, By Gene Delivery Method, 2017 - 2028 (US$ Million)
- 10.2.6. North America Market Size and Forecast, By Application, 2017 - 2028 (US$ Million)
- 10.2.7. U.S.
- 10.2.7.1. Overview
- 10.2.7.2. Market Analysis, Forecast, and Y-O-Y Growth Rate, 2017 - 2028, (US$ Million)
- 10.2.7.3. U.S. Market Size and Forecast, By Therapy, 2017 - 2028 (US$ Million)
- 10.2.7.4. U.S. Market Size and Forecast, By Gene Delivery Method, 2017 - 2028 (US$ Million)
- 10.2.7.5. U.S. Market Size and Forecast, By Application, 2017 - 2028 (US$ Million)
- 10.2.8. Canada
- 10.2.8.1. Overview
- 10.2.8.2. Market Analysis, Forecast, and Y-O-Y Growth Rate, 2017 - 2028, (US$ Million)
- 10.2.8.3. Canada Market Size and Forecast, By Therapy, 2017 - 2028 (US$ Million)
- 10.2.8.4. Canada Market Size and Forecast, By Gene Delivery Method, 2017 - 2028 (US$ Million)
- 10.2.8.5. Canada Market Size and Forecast, By Application, 2017 - 2028 (US$ Million)
- 10.3. Europe
- 10.3.1. Overview
- 10.3.2. Key Manufacturers in Europe
- 10.3.3. Europe Market Size and Forecast, By Country, 2017 - 2028 (US$ Million)
- 10.3.4. Europe Market Size and Forecast, By Therapy, 2017 - 2028 (US$ Million)
- 10.3.5. Europe Market Size and Forecast, By Gene Delivery Method, 2017 - 2028 (US$ Million)
- 10.3.6. Europe Market Size and Forecast, By Application, 2017 - 2028 (US$ Million)
- 10.3.7. Germany
- 10.3.7.1. Overview
- 10.3.7.2. Market Analysis, Forecast, and Y-O-Y Growth Rate, 2017 - 2028, (US$ Million)
- 10.3.7.3. Germany Market Size and Forecast, By Therapy, 2017 - 2028 (US$ Million)
- 10.3.7.4. Germany Market Size and Forecast, By Gene Delivery Method, 2017 - 2028 (US$ Million)
- 10.3.7.5. Germany Market Size and Forecast, By Application, 2017 - 2028 (US$ Million)
- 10.3.8. Italy
- 10.3.8.1. Overview
- 10.3.8.2. Market Analysis, Forecast, and Y-O-Y Growth Rate, 2017 - 2028, (US$ Million)
- 10.3.8.3. Italy Market Size and Forecast, By Therapy, 2017 - 2028 (US$ Million)
- 10.3.8.4. Italy Market Size and Forecast, By Gene Delivery Method, 2017 - 2028 (US$ Million)
- 10.3.8.5. Italy Market Size and Forecast, By Application, 2017 - 2028 (US$ Million)
- 10.3.9. United Kingdom
- 10.3.9.1. Overview
- 10.3.9.2. Market Analysis, Forecast, and Y-O-Y Growth Rate, 2017 - 2028, (US$ Million)
- 10.3.9.3. United Kingdom Market Size and Forecast, By Therapy, 2017 - 2028 (US$ Million)
- 10.3.9.4. United Kingdom Market Size and Forecast, By Gene Delivery Method, 2017 - 2028 (US$ Million)
- 10.3.9.5. United Kingdom Market Size and Forecast, By Application, 2017 - 2028 (US$ Million)
- 10.3.10. France
- 10.3.10.1. Overview
- 10.3.10.2. Market Analysis, Forecast, and Y-O-Y Growth Rate, 2017 - 2028, (US$ Million)
- 10.3.10.3. France Market Size and Forecast, By Therapy, 2017 - 2028 (US$ Million)
- 10.3.10.4. France Market Size and Forecast, By Gene Delivery Method, 2017 - 2028 (US$ Million)
- 10.3.10.5. France Market Size and Forecast, By Application, 2017 - 2028 (US$ Million)
- 10.3.11. Russia
- 10.3.11.1. Market Analysis, Forecast, and Y-O-Y Growth Rate, 2017 - 2028, (US$ Million)
- 10.3.11.2. Russia Market Size and Forecast, By Therapy, 2017 - 2028 (US$ Million)
- 10.3.11.3. Russia Market Size and Forecast, By Gene Delivery Method, 2017 - 2028 (US$ Million)
- 10.3.11.4. Russia Market Size and Forecast, By Application, 2017 - 2028 (US$ Million)
- 10.3.12. Netherlands
- 10.3.12.1. Market Analysis, Forecast, and Y-O-Y Growth Rate, 2017 - 2028, (US$ Million)
- 10.3.12.2. Netherlands Market Size and Forecast, By Therapy, 2017 - 2028 (US$ Million)
- 10.3.12.3. Netherlands Market Size and Forecast, By Gene Delivery Method, 2017 - 2028 (US$ Million)
- 10.3.12.4. Netherlands Market Size and Forecast, By Application, 2017 - 2028 (US$ Million)
- 10.3.13. Sweden
- 10.3.13.1. Market Analysis, Forecast, and Y-O-Y Growth Rate, 2017 - 2028, (US$ Million)
- 10.3.13.2. Sweden Market Size and Forecast, By Therapy, 2017 - 2028 (US$ Million)
- 10.3.13.3. Sweden Market Size and Forecast, By Gene Delivery Method, 2017 - 2028 (US$ Million)
- 10.3.13.4. Sweden Market Size and Forecast, By Application, 2017 - 2028 (US$ Million)
- 10.3.14. Poland
- 10.3.14.1. Market Analysis, Forecast, and Y-O-Y Growth Rate, 2017 - 2028, (US$ Million)
- 10.3.14.2. Poland Market Size and Forecast, By Therapy, 2017 - 2028 (US$ Million)
- 10.3.14.3. Poland Market Size and Forecast, By Gene Delivery Method, 2017 - 2028 (US$ Million)
- 10.3.14.4. Poland Market Size and Forecast, By Application, 2017 - 2028 (US$ Million)
- 10.3.15. Rest of Europe
- 10.3.15.1. Overview
- 10.3.15.2. Market Analysis, Forecast, and Y-O-Y Growth Rate, 2017 - 2028, (US$ Million)
- 10.3.15.3. Rest of the Europe Market Size and Forecast, By Therapy, 2017 - 2028 (US$ Million)
- 10.3.15.4. Rest of the Europe Market Size and Forecast, By Gene Delivery Method, 2017 - 2028 (US$ Million)
- 10.3.15.5. Rest of the Europe Market Size and Forecast, By Application, 2017 - 2028 (US$ Million)
- 10.4. Asia Pacific (APAC)
- 10.4.1. Overview
- 10.4.2. Key Manufacturers in Asia Pacific
- 10.4.3. Asia Pacific Market Size and Forecast, By Country, 2017 - 2028 (US$ Million)
- 10.4.4. Asia Pacific Market Size and Forecast, By Therapy, 2017 - 2028 (US$ Million)
- 10.4.5. Asia Pacific Market Size and Forecast, By Gene Delivery Method, 2017 - 2028 (US$ Million)
- 10.4.6. Asia Pacific Market Size and Forecast, By Application, 2017 - 2028 (US$ Million)
- 10.4.7. India
- 10.4.7.1. Overview
- 10.4.7.2. Market Analysis, Forecast, and Y-O-Y Growth Rate, 2017 - 2028, (US$ Million)
- 10.4.7.3. India Market Size and Forecast, By Therapy, 2017 - 2028 (US$ Million)
- 10.4.7.4. India Market Size and Forecast, By Gene Delivery Method, 2017 - 2028 (US$ Million)
- 10.4.7.5. India Market Size and Forecast, By Application, 2017 - 2028 (US$ Million)
- 10.4.8. China
- 10.4.8.1. Overview
- 10.4.8.2. Market Analysis, Forecast, and Y-O-Y Growth Rate, 2017 - 2028, (US$ Million)
- 10.4.8.3. China Market Size and Forecast, By Therapy, 2017 - 2028 (US$ Million)
- 10.4.8.4. China Market Size and Forecast, By Gene Delivery Method, 2017 - 2028 (US$ Million)
- 10.4.8.5. China Market Size and Forecast, By Application, 2017 - 2028 (US$ Million)
- 10.4.9. Japan
- 10.4.9.1. Overview
- 10.4.9.2. Market Analysis, Forecast, and Y-O-Y Growth Rate, 2017 - 2028, (US$ Million)
- 10.4.9.3. Japan Market Size and Forecast, By Therapy, 2017 - 2028 (US$ Million)
- 10.4.9.4. Japan Market Size and Forecast, By Gene Delivery Method, 2017 - 2028 (US$ Million)
- 10.4.9.5. Japan Market Size and Forecast, By Application, 2017 - 2028 (US$ Million)
- 10.4.10. South Korea
- 10.4.10.1. Overview
- 10.4.10.2. Market Analysis, Forecast, and Y-O-Y Growth Rate, 2017 - 2028, (US$ Million)
- 10.4.10.3. South Korea Market Size and Forecast, By Therapy, 2017 - 2028 (US$ Million)
- 10.4.10.4. South Korea Market Size and Forecast, By Gene Delivery Method, 2017 - 2028 (US$ Million)
- 10.4.10.5. South Korea Market Size and Forecast, By Application, 2017 - 2028 (US$ Million)
- 10.4.11. Australia
- 10.4.11.1. Overview
- 10.4.11.2. Market Analysis, Forecast, and Y-O-Y Growth Rate, 2017 - 2028, (US$ Million)
- 10.4.11.3. Australia Market Size and Forecast, By Therapy, 2017 - 2028 (US$ Million)
- 10.4.11.4. Australia Market Size and Forecast, By Gene Delivery Method, 2017 - 2028 (US$ Million)
- 10.4.11.5. Australia Market Size and Forecast, By Application, 2017 - 2028 (US$ Million)
- 10.4.12. Thailand
- 10.4.12.1. Overview
- 10.4.12.2. Market Analysis, Forecast, and Y-O-Y Growth Rate, 2017 - 2028, (US$ Million)
- 10.4.12.3. Thailand Market Size and Forecast, By Therapy, 2017 - 2028 (US$ Million)
- 10.4.12.4. Thailand Market Size and Forecast, By Gene Delivery Method, 2017 - 2028 (US$ Million)
- 10.4.12.5. Thailand Market Size and Forecast, By Application, 2017 - 2028 (US$ Million)
- 10.4.13. Indonesia
- 10.4.13.1. Overview
- 10.4.13.2. Market Analysis, Forecast, and Y-O-Y Growth Rate, 2017 - 2028, (US$ Million)
- 10.4.13.3. Indonesia Market Size and Forecast, By Therapy, 2017 - 2028 (US$ Million)
- 10.4.13.4. Indonesia Market Size and Forecast, By Gene Delivery Method, 2017 - 2028 (US$ Million)
- 10.4.13.5. Indonesia Market Size and Forecast, By Application, 2017 - 2028 (US$ Million)
- 10.4.14. Philippines
- 10.4.14.1. Overview
- 10.4.14.2. Market Analysis, Forecast, and Y-O-Y Growth Rate, 2017 - 2028, (US$ Million)
- 10.4.14.3. Philippines Market Size and Forecast, By Therapy, 2017 - 2028 (US$ Million)
- 10.4.14.4. Philippines Market Size and Forecast, By Gene Delivery Method, 2017 - 2028 (US$ Million)
- 10.4.14.5. Philippines Market Size and Forecast, By Application, 2017 - 2028 (US$ Million)
- 10.4.15. Rest of APAC
- 10.4.15.1. Overview
- 10.4.15.2. Market Analysis, Forecast, and Y-O-Y Growth Rate, 2017 - 2028, (US$ Million)
- 10.4.15.3. Rest of APAC Market Size and Forecast, By Therapy, 2017 - 2028 (US$ Million)
- 10.4.15.4. Rest of APAC Market Size and Forecast, By Gene Delivery Method, 2017 - 2028 (US$ Million)
- 10.4.15.5. Rest of APAC Market Size and Forecast, By Application, 2017 - 2028 (US$ Million)
- 10.5. Latin America
- 10.5.1. Overview
- 10.5.2. Key Manufacturers in Latin America
- 10.5.3. Latin America Market Size and Forecast, By Country, 2017 - 2028 (US$ Million)
- 10.5.4. Latin America Market Size and Forecast, By Therapy, 2017 - 2028 (US$ Million)
- 10.5.5. Latin America Market Size and Forecast, By Gene Delivery Method, 2017 - 2028 (US$ Million)
- 10.5.6. Latin America Market Size and Forecast, By Application, 2017 - 2028 (US$ Million)
- 10.5.7. Brazil
- 10.5.7.1. Overview
- 10.5.7.2. Market Analysis, Forecast, and Y-O-Y Growth Rate, 2017 - 2028, (US$ Million)
- 10.5.7.3. Brazil Market Size and Forecast, By Therapy, 2017 - 2028 (US$ Million)
- 10.5.7.4. Brazil Market Size and Forecast, By Gene Delivery Method, 2017 - 2028 (US$ Million)
- 10.5.7.5. Brazil Market Size and Forecast, By Application, 2017 - 2028 (US$ Million)
- 10.5.8. Mexico
- 10.5.8.1. Overview
- 10.5.8.2. Market Analysis, Forecast, and Y-O-Y Growth Rate, 2017 - 2028, (US$ Million)
- 10.5.8.3. Mexico Market Size and Forecast, By Therapy, 2017 - 2028 (US$ Million)
- 10.5.8.4. Mexico Market Size and Forecast, By Gene Delivery Method, 2017 - 2028 (US$ Million)
- 10.5.8.5. Mexico Market Size and Forecast, By Application, 2017 - 2028 (US$ Million)
- 10.5.9. Argentina
- 10.5.9.1. Overview
- 10.5.9.2. Market Analysis, Forecast, and Y-O-Y Growth Rate, 2017 - 2028, (US$ Million)
- 10.5.9.3. Argentina Market Size and Forecast, By Therapy, 2017 - 2028 (US$ Million)
- 10.5.9.4. Argentina Market Size and Forecast, By Gene Delivery Method, 2017 - 2028 (US$ Million)
- 10.5.9.5. Argentina Market Size and Forecast, By Application, 2017 - 2028 (US$ Million)
- 10.5.10. Colombia
- 10.5.10.1. Overview
- 10.5.10.2. Market Analysis, Forecast, and Y-O-Y Growth Rate, 2017 - 2028, (US$ Million)
- 10.5.10.3. Colombia Market Size and Forecast, By Therapy, 2017 - 2028 (US$ Million)
- 10.5.10.4. Colombia Market Size and Forecast, By Gene Delivery Method, 2017 - 2028 (US$ Million)
- 10.5.10.5. Colombia Market Size and Forecast, By Application, 2017 - 2028 (US$ Million)
- 10.5.11. Rest of LATAM
- 10.5.11.1. Overview
- 10.5.11.2. Market Analysis, Forecast, and Y-O-Y Growth Rate, 2017 - 2028, (US$ Million)
- 10.5.11.3. Rest of LATAM Market Size and Forecast, By Therapy, 2017 - 2028 (US$ Million)
- 10.5.11.4. Rest of LATAM Market Size and Forecast, By Gene Delivery Method, 2017 - 2028 (US$ Million)
- 10.5.11.5. Rest of LATAM Market Size and Forecast, By Application, 2017 - 2028 (US$ Million)
- 10.6. Middle East and Africa
- 10.6.1. Overview
- 10.6.2. Key Manufacturers in Middle East and Africa
- 10.6.3. Middle East and Africa Market Size and Forecast, By Country, 2017 - 2028 (US$ Million)
- 10.6.4. Middle East and Africa Market Size and Forecast, By Therapy, 2017 - 2028 (US$ Million)
- 10.6.5. Middle East and Africa Market Size and Forecast, By Gene Delivery Method, 2017 - 2028 (US$ Million)
- 10.6.6. Middle East and Africa Market Size and Forecast, By Application, 2017 - 2028 (US$ Million)
- 10.6.7. Saudi Arabia
- 10.6.7.1. Overview
- 10.6.7.2. Market Analysis, Forecast, and Y-O-Y Growth Rate, 2017 - 2028, (US$ Million)
- 10.6.7.3. Saudi Arabia Market Size and Forecast, By Therapy, 2017 - 2028 (US$ Million)
- 10.6.7.4. Saudi Arabia Market Size and Forecast, By Gene Delivery Method, 2017 - 2028 (US$ Million)
- 10.6.7.5. Saudi Arabia Market Size and Forecast, By Application, 2017 - 2028 (US$ Million)
- 10.6.8. United Arab Emirates
- 10.6.8.1. Overview
- 10.6.8.2. Market Analysis, Forecast, and Y-O-Y Growth Rate, 2017 - 2028, (US$ Million)
- 10.6.8.3. United Arab Emirates Market Size and Forecast, By Therapy, 2017 - 2028 (US$ Million)
- 10.6.8.4. United Arab Emirates Market Size and Forecast, By Gene Delivery Method, 2017 - 2028 (US$ Million)
- 10.6.8.5. United Arab Emirates Market Size and Forecast, By Application, 2017 - 2028 (US$ Million)
- 10.6.9. Israel
- 10.6.9.1. Overview
- 10.6.9.2. Market Analysis, Forecast, and Y-O-Y Growth Rate, 2017 - 2028, (US$ Million)
- 10.6.9.3. Israel Market Size and Forecast, By Therapy, 2017 - 2028 (US$ Million)
- 10.6.9.4. Israel Market Size and Forecast, By Gene Delivery Method, 2017 - 2028 (US$ Million)
- 10.6.9.5. Israel Market Size and Forecast, By Application, 2017 - 2028 (US$ Million)
- 10.6.10. Turkey
- 10.6.10.1. Overview
- 10.6.10.2. Market Analysis, Forecast, and Y-O-Y Growth Rate, 2017 - 2028, (US$ Million)
- 10.6.10.3. Turkey Market Size and Forecast, By Therapy, 2017 - 2028 (US$ Million)
- 10.6.10.4. Turkey Market Size and Forecast, By Gene Delivery Method, 2017 - 2028 (US$ Million)
- 10.6.10.5. Turkey Market Size and Forecast, By Application, 2017 - 2028 (US$ Million)
- 10.6.11. Algeria
- 10.6.11.1. Overview
- 10.6.11.2. Market Analysis, Forecast, and Y-O-Y Growth Rate, 2017 - 2028, (US$ Million)
- 10.6.11.3. Algeria Market Size and Forecast, By Therapy, 2017 - 2028 (US$ Million)
- 10.6.11.4. Algeria Market Size and Forecast, By Gene Delivery Method, 2017 - 2028 (US$ Million)
- 10.6.11.5. Algeria Market Size and Forecast, By Application, 2017 - 2028 (US$ Million)
- 10.6.12. Egypt
- 10.6.12.1. Overview
- 10.6.12.2. Market Analysis, Forecast, and Y-O-Y Growth Rate, 2017 - 2028, (US$ Million)
- 10.6.12.3. Egypt Market Size and Forecast, By Therapy, 2017 - 2028 (US$ Million)
- 10.6.12.4. Egypt Market Size and Forecast, By Gene Delivery Method, 2017 - 2028 (US$ Million)
- 10.6.12.5. Egypt Market Size and Forecast, By Application, 2017 - 2028 (US$ Million)
- 10.6.13. Rest of MEA
- 10.6.13.1. Overview
- 10.6.13.2. Market Analysis, Forecast, and Y-O-Y Growth Rate, 2017 - 2028, (US$ Million)
- 10.6.13.3. Rest of MEA Market Size and Forecast, By Therapy, 2017 - 2028 (US$ Million)
- 10.6.13.4. Rest of MEA Market Size and Forecast, By Gene Delivery Method, 2017 - 2028 (US$ Million)
- 10.6.13.5. Rest of MEA Market Size and Forecast, By Application, 2017 - 2028 (US$ Million)
11. Key Vendor Analysis
- 11.1. Competitive Dashboard
- 11.2. Company Profiles
- 11.2.1. Thermo Fisher Scientific, Inc.
- 11.2.2. Abeona Therapeutics
- 11.2.3. Aldevron
- 11.2.4. Oxford BioMedica
- 11.2.5. Sanofi
- 11.2.6. WuXi AppTec
- 11.2.7. Yposkesi
- 11.2.8. E Cognate BioServices Inc.
- 11.2.9. Finvector
- 11.2.10. Fujifilm Holdings
- 11.2.11. Kaneka Corporation
- 11.2.12. Merck KGaA
- 11.2.13. Uniqure NV
- 11.2.14. Oxford BioMedica PLC
- 11.2.15. Johnson & Johnson
12. 360 Degree Analyst View
13. Appendix
- 13.1. Research Methodology
- 13.2. References
- 13.3. Abbreviations
- 13.4. Disclaimer
- 13.5. Contact Us