|
|
市場調査レポート
商品コード
1472356
レボドパ市場:形態別、投与経路別、流通チャネル別:世界の機会分析と産業予測、2023年~2032年Levodopa Market By Form, By Route of Administration, By Distribution Channels : Global Opportunity Analysis and Industry Forecast, 2023-2032 |
||||||
|
|
|||||||
|
|||||||


| レボドパ市場:形態別、投与経路別、流通チャネル別:世界の機会分析と産業予測、2023年~2032年 |
|
出版日: 2024年03月01日
発行: Allied Market Research
ページ情報: 英文 300 Pages
納期: 2~3営業日
|

- 全表示
- 概要
- 図表
- 目次
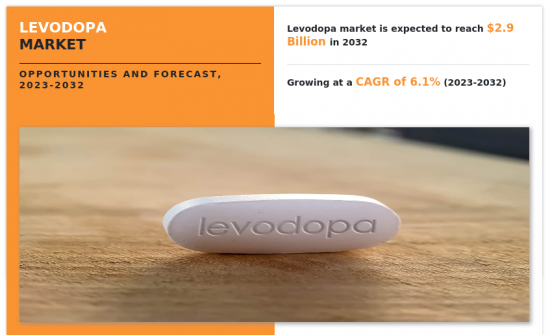
世界のレボドパ市場は、2023年から2032年までCAGR 6.1%で2022年の16億5,540万米ドルから成長し、2032年までに29億3,460万米ドルに達すると予測されます。
レボドパは一般にL-ドパと呼ばれ、体内でドパミンに変換される化学的構成要素です。ドーパミンは脳内で分泌される化学伝達物質です。ドーパミンは快楽、脳機能、記憶プロセスを促進します。ほぼすべての患者は、パーキンソン病(PD)の症状を初期段階で効果的にコントロールするドパミン前駆体であるレボドパを投与されています。カルビドパはレボドパ含有薬と併用されることが多く、ドパミンの代謝を低下させることでその効果を高める。
レボドパ市場は、ヘルスケア・インフラへの投資の増加、可処分所得の増加、新興市場における医療アクセスの急増により、著しい成長を遂げています。さらに、新興国がヘルスケアシステムを強化するにつれて、パーキンソン病管理のためのレボドパのような薬剤の入手可能性と価格が上昇しています。ヘルスケアサービスへのアクセスが改善されれば、診断率や治療開始率も高まり、レボドパの需要を牽引することになります。さらに、可処分所得の増加は個人に必要不可欠な医薬品を購入する余裕を与え、市場の成長を促進します。さらに、これらの要因が組み合わさることで、患者層が拡大するだけでなく、レボドパ市場で事業を展開する製薬企業、特にヘルスケアインフラが発展している地域に新たな成長機会も生まれます。しかし、レボドパに関連する高コストは、レボドパ市場の成長を抑制する主な要因の1つです。さらに、特にヘルスケア資源が限られている地域や低所得者層では、このパーキンソン病管理のための重要な薬物への患者のアクセスを制限しています。さらに、レボドパの経済的な問題は、患者が一貫した治療を求めたり、処方されたレジメンを遵守したりすることを妨げ、疾患管理の結果が最適でないことにつながります。加えて、高コストがヘルスケアの予算を圧迫し、償還の選択肢を制限し、市場の成長を抑制する可能性があります。さらに、レボドパへの公平なアクセスを確保し、市場成長と患者ケアへの影響を緩和するためには、手頃な価格の障壁に対処することが不可欠です。
逆に、ドラッグデリバリーシステムの技術的進歩の増加は、革新的な製剤と代替投与経路を通じてレボドパの有効性と患者のアドヒアランスを高めることを約束し、市場の成長を促進すると予想されます。さらに、特に新興国地域でのヘルスケア支出の増加は、レボドパへのアクセス性を高め、市場成長を促進します。さらに、新興市場は老年人口の増加と相まって、市場浸透の未開拓の可能性を提供しています。さらに、新規製剤や併用療法を模索する継続的な研究イニシアティブやチャネル開発が、レボドパの市場展望を強化しています。さらに、支持的なヘルスケア政策と償還の枠組みは、広範なアクセシビリティを確保し、疾患認識と診断率の増加は市場成長に寄与します。
利害関係者にとっての主なメリット
- 当レポートでは、2022年から2032年までのレボドパ市場分析の市場セグメント、現在の動向、推定・動向、ダイナミクスを定量的に分析し、レボドパ市場の有力な機会を特定します。
- 市場促進要因、市場抑制要因、市場機会に関連する情報とともに市場調査を提供します。
- ポーターのファイブフォース分析では、利害関係者が利益重視のビジネス決定を下し、サプライヤーとバイヤーのネットワークを強化できるように、バイヤーとサプライヤーの力を強調します。
- レボドパの市場セグメンテーションの詳細な分析は、市場機会を決定するのに役立ちます。
- 各地域の主要国は世界市場への収益貢献度に応じてマッピングされています。
- 市場プレイヤーのポジショニングはベンチマーキングを容易にし、市場プレイヤーの現在のポジションの明確な理解を提供します。
- 本レポートには、地域および世界のレボドパ市場動向、主要企業、市場セグメント、応用分野、市場成長戦略の分析が含まれています。
本レポートで可能なカスタマイズ(追加費用とスケジュールがあります。)
- 製品に含まれる原材料の分析(%別)
- 投資機会
- 技術動向分析
- 製品/セグメント別プレーヤーの市場セグメンテーション分析
- 主なプレイヤーの新製品開発/製品マトリックス
- 規制ガイドライン
- 顧客の関心に応じた追加企業プロファイル
- 国別または地域別追加分析-市場規模と予測
- クリスクロス・セグメント分析-市場規模と予測
- 企業プロファイルの拡張リスト
- 過去の市場データ
- 主要プレーヤーの詳細(所在地、連絡先、サプライヤー/ベンダーネットワークなどを含む、エクセル形式)
- 顧客/消費者/原料サプライヤーのリスト-バリューチェーン分析
- 世界/地域/国別レベルでのプレーヤーの市場シェア分析
目次
第1章 イントロダクション
第2章 エグゼクティブサマリー
第3章 市場概要
- 市場の定義と範囲
- 主な調査結果
- 影響要因
- 主な投資機会
- ポーターのファイブフォース分析
- 市場力学
- 促進要因
- 抑制要因
- 機会
- 平均販売価格
- 市場シェア分析
- ブランドシェア分析
- 貿易データ分析
- 製品消費
- バリューチェーン分析
- 規制ガイドライン
- 主要規制分析
- 償還シナリオ
- 特許状況
第4章 レボドパ市場:形態別
- 概要
- 錠剤
- カプセル
- 粉末
- 液体
第5章 レボドパ市場:投与経路別
- 概要
- 経口
- 非経口
第6章 レボドパ市場:流通チャネル別
- 概要
- 病院薬局
- 小売薬局
- オンライン薬局
- その他
第7章 レボドパ市場:地域別
- 概要
- 北米
- 米国
- カナダ
- メキシコ
- 欧州
- ドイツ
- 英国
- フランス
- スペイン
- イタリア
- その他
- アジア太平洋
- 中国
- 日本
- インド
- 韓国
- オーストラリア
- その他
- ラテンアメリカ・中東・アフリカ
- ブラジル
- サウジアラビア
- アラブ首長国連邦
- 南アフリカ
- その他
第8章 競争情勢
- イントロダクション
- 主要成功戦略
- 主要10社の製品マッピング
- 競合ダッシュボード
- 競合ヒートマップ
- 主要企業のポジショニング、2022年
第9章 企業プロファイル
- Novartis AG
- Merck and Co. Inc.
- Eli Lilly and Company
- Bristol-Myers Squibb Co.
- Teva Pharmaceutical Industries Ltd.
- Impax Laboratories Inc.
- Pfizer Inc.
- UCB SA
- Sun Pharmaceutical Industries Ltd.
- Mylan Nv
LIST OF TABLES
- TABLE 01. GLOBAL LEVODOPA MARKET, BY FORM, 2022-2032 ($MILLION)
- TABLE 02. LEVODOPA MARKET FOR TABLETS, BY REGION, 2022-2032 ($MILLION)
- TABLE 03. LEVODOPA MARKET FOR CAPSULES, BY REGION, 2022-2032 ($MILLION)
- TABLE 04. LEVODOPA MARKET FOR POWDER, BY REGION, 2022-2032 ($MILLION)
- TABLE 05. LEVODOPA MARKET FOR LIQUID, BY REGION, 2022-2032 ($MILLION)
- TABLE 06. GLOBAL LEVODOPA MARKET, BY ROUTE OF ADMINISTRATION, 2022-2032 ($MILLION)
- TABLE 07. LEVODOPA MARKET FOR ORAL, BY REGION, 2022-2032 ($MILLION)
- TABLE 08. LEVODOPA MARKET FOR PARENTERAL, BY REGION, 2022-2032 ($MILLION)
- TABLE 09. GLOBAL LEVODOPA MARKET, BY DISTRIBUTION CHANNELS, 2022-2032 ($MILLION)
- TABLE 10. LEVODOPA MARKET FOR HOSPITAL PHARMACIES, BY REGION, 2022-2032 ($MILLION)
- TABLE 11. LEVODOPA MARKET FOR RETAIL PHARMACIES, BY REGION, 2022-2032 ($MILLION)
- TABLE 12. LEVODOPA MARKET FOR ONLINE PHARMACIES, BY REGION, 2022-2032 ($MILLION)
- TABLE 13. LEVODOPA MARKET FOR OTHER , BY REGION, 2022-2032 ($MILLION)
- TABLE 14. LEVODOPA MARKET, BY REGION, 2022-2032 ($MILLION)
- TABLE 15. NORTH AMERICA LEVODOPA MARKET, BY FORM, 2022-2032 ($MILLION)
- TABLE 16. NORTH AMERICA LEVODOPA MARKET, BY ROUTE OF ADMINISTRATION, 2022-2032 ($MILLION)
- TABLE 17. NORTH AMERICA LEVODOPA MARKET, BY DISTRIBUTION CHANNELS, 2022-2032 ($MILLION)
- TABLE 18. NORTH AMERICA LEVODOPA MARKET, BY COUNTRY, 2022-2032 ($MILLION)
- TABLE 19. U.S. LEVODOPA MARKET, BY FORM, 2022-2032 ($MILLION)
- TABLE 20. U.S. LEVODOPA MARKET, BY ROUTE OF ADMINISTRATION, 2022-2032 ($MILLION)
- TABLE 21. U.S. LEVODOPA MARKET, BY DISTRIBUTION CHANNELS, 2022-2032 ($MILLION)
- TABLE 22. CANADA LEVODOPA MARKET, BY FORM, 2022-2032 ($MILLION)
- TABLE 23. CANADA LEVODOPA MARKET, BY ROUTE OF ADMINISTRATION, 2022-2032 ($MILLION)
- TABLE 24. CANADA LEVODOPA MARKET, BY DISTRIBUTION CHANNELS, 2022-2032 ($MILLION)
- TABLE 25. MEXICO LEVODOPA MARKET, BY FORM, 2022-2032 ($MILLION)
- TABLE 26. MEXICO LEVODOPA MARKET, BY ROUTE OF ADMINISTRATION, 2022-2032 ($MILLION)
- TABLE 27. MEXICO LEVODOPA MARKET, BY DISTRIBUTION CHANNELS, 2022-2032 ($MILLION)
- TABLE 28. EUROPE LEVODOPA MARKET, BY FORM, 2022-2032 ($MILLION)
- TABLE 29. EUROPE LEVODOPA MARKET, BY ROUTE OF ADMINISTRATION, 2022-2032 ($MILLION)
- TABLE 30. EUROPE LEVODOPA MARKET, BY DISTRIBUTION CHANNELS, 2022-2032 ($MILLION)
- TABLE 31. EUROPE LEVODOPA MARKET, BY COUNTRY, 2022-2032 ($MILLION)
- TABLE 32. GERMANY LEVODOPA MARKET, BY FORM, 2022-2032 ($MILLION)
- TABLE 33. GERMANY LEVODOPA MARKET, BY ROUTE OF ADMINISTRATION, 2022-2032 ($MILLION)
- TABLE 34. GERMANY LEVODOPA MARKET, BY DISTRIBUTION CHANNELS, 2022-2032 ($MILLION)
- TABLE 35. UK LEVODOPA MARKET, BY FORM, 2022-2032 ($MILLION)
- TABLE 36. UK LEVODOPA MARKET, BY ROUTE OF ADMINISTRATION, 2022-2032 ($MILLION)
- TABLE 37. UK LEVODOPA MARKET, BY DISTRIBUTION CHANNELS, 2022-2032 ($MILLION)
- TABLE 38. FRANCE LEVODOPA MARKET, BY FORM, 2022-2032 ($MILLION)
- TABLE 39. FRANCE LEVODOPA MARKET, BY ROUTE OF ADMINISTRATION, 2022-2032 ($MILLION)
- TABLE 40. FRANCE LEVODOPA MARKET, BY DISTRIBUTION CHANNELS, 2022-2032 ($MILLION)
- TABLE 41. SPAIN LEVODOPA MARKET, BY FORM, 2022-2032 ($MILLION)
- TABLE 42. SPAIN LEVODOPA MARKET, BY ROUTE OF ADMINISTRATION, 2022-2032 ($MILLION)
- TABLE 43. SPAIN LEVODOPA MARKET, BY DISTRIBUTION CHANNELS, 2022-2032 ($MILLION)
- TABLE 44. ITALY LEVODOPA MARKET, BY FORM, 2022-2032 ($MILLION)
- TABLE 45. ITALY LEVODOPA MARKET, BY ROUTE OF ADMINISTRATION, 2022-2032 ($MILLION)
- TABLE 46. ITALY LEVODOPA MARKET, BY DISTRIBUTION CHANNELS, 2022-2032 ($MILLION)
- TABLE 47. REST OF EUROPE LEVODOPA MARKET, BY FORM, 2022-2032 ($MILLION)
- TABLE 48. REST OF EUROPE LEVODOPA MARKET, BY ROUTE OF ADMINISTRATION, 2022-2032 ($MILLION)
- TABLE 49. REST OF EUROPE LEVODOPA MARKET, BY DISTRIBUTION CHANNELS, 2022-2032 ($MILLION)
- TABLE 50. ASIA-PACIFIC LEVODOPA MARKET, BY FORM, 2022-2032 ($MILLION)
- TABLE 51. ASIA-PACIFIC LEVODOPA MARKET, BY ROUTE OF ADMINISTRATION, 2022-2032 ($MILLION)
- TABLE 52. ASIA-PACIFIC LEVODOPA MARKET, BY DISTRIBUTION CHANNELS, 2022-2032 ($MILLION)
- TABLE 53. ASIA-PACIFIC LEVODOPA MARKET, BY COUNTRY, 2022-2032 ($MILLION)
- TABLE 54. CHINA LEVODOPA MARKET, BY FORM, 2022-2032 ($MILLION)
- TABLE 55. CHINA LEVODOPA MARKET, BY ROUTE OF ADMINISTRATION, 2022-2032 ($MILLION)
- TABLE 56. CHINA LEVODOPA MARKET, BY DISTRIBUTION CHANNELS, 2022-2032 ($MILLION)
- TABLE 57. JAPAN LEVODOPA MARKET, BY FORM, 2022-2032 ($MILLION)
- TABLE 58. JAPAN LEVODOPA MARKET, BY ROUTE OF ADMINISTRATION, 2022-2032 ($MILLION)
- TABLE 59. JAPAN LEVODOPA MARKET, BY DISTRIBUTION CHANNELS, 2022-2032 ($MILLION)
- TABLE 60. INDIA LEVODOPA MARKET, BY FORM, 2022-2032 ($MILLION)
- TABLE 61. INDIA LEVODOPA MARKET, BY ROUTE OF ADMINISTRATION, 2022-2032 ($MILLION)
- TABLE 62. INDIA LEVODOPA MARKET, BY DISTRIBUTION CHANNELS, 2022-2032 ($MILLION)
- TABLE 63. SOUTH KOREA LEVODOPA MARKET, BY FORM, 2022-2032 ($MILLION)
- TABLE 64. SOUTH KOREA LEVODOPA MARKET, BY ROUTE OF ADMINISTRATION, 2022-2032 ($MILLION)
- TABLE 65. SOUTH KOREA LEVODOPA MARKET, BY DISTRIBUTION CHANNELS, 2022-2032 ($MILLION)
- TABLE 66. AUSTRALIA LEVODOPA MARKET, BY FORM, 2022-2032 ($MILLION)
- TABLE 67. AUSTRALIA LEVODOPA MARKET, BY ROUTE OF ADMINISTRATION, 2022-2032 ($MILLION)
- TABLE 68. AUSTRALIA LEVODOPA MARKET, BY DISTRIBUTION CHANNELS, 2022-2032 ($MILLION)
- TABLE 69. REST OF ASIA-PACIFIC LEVODOPA MARKET, BY FORM, 2022-2032 ($MILLION)
- TABLE 70. REST OF ASIA-PACIFIC LEVODOPA MARKET, BY ROUTE OF ADMINISTRATION, 2022-2032 ($MILLION)
- TABLE 71. REST OF ASIA-PACIFIC LEVODOPA MARKET, BY DISTRIBUTION CHANNELS, 2022-2032 ($MILLION)
- TABLE 72. LAMEA LEVODOPA MARKET, BY FORM, 2022-2032 ($MILLION)
- TABLE 73. LAMEA LEVODOPA MARKET, BY ROUTE OF ADMINISTRATION, 2022-2032 ($MILLION)
- TABLE 74. LAMEA LEVODOPA MARKET, BY DISTRIBUTION CHANNELS, 2022-2032 ($MILLION)
- TABLE 75. LAMEA LEVODOPA MARKET, BY COUNTRY, 2022-2032 ($MILLION)
- TABLE 76. BRAZIL LEVODOPA MARKET, BY FORM, 2022-2032 ($MILLION)
- TABLE 77. BRAZIL LEVODOPA MARKET, BY ROUTE OF ADMINISTRATION, 2022-2032 ($MILLION)
- TABLE 78. BRAZIL LEVODOPA MARKET, BY DISTRIBUTION CHANNELS, 2022-2032 ($MILLION)
- TABLE 79. SAUDI ARABIA LEVODOPA MARKET, BY FORM, 2022-2032 ($MILLION)
- TABLE 80. SAUDI ARABIA LEVODOPA MARKET, BY ROUTE OF ADMINISTRATION, 2022-2032 ($MILLION)
- TABLE 81. SAUDI ARABIA LEVODOPA MARKET, BY DISTRIBUTION CHANNELS, 2022-2032 ($MILLION)
- TABLE 82. UNITED ARAB EMIRATES LEVODOPA MARKET, BY FORM, 2022-2032 ($MILLION)
- TABLE 83. UNITED ARAB EMIRATES LEVODOPA MARKET, BY ROUTE OF ADMINISTRATION, 2022-2032 ($MILLION)
- TABLE 84. UNITED ARAB EMIRATES LEVODOPA MARKET, BY DISTRIBUTION CHANNELS, 2022-2032 ($MILLION)
- TABLE 85. SOUTH AFRICA LEVODOPA MARKET, BY FORM, 2022-2032 ($MILLION)
- TABLE 86. SOUTH AFRICA LEVODOPA MARKET, BY ROUTE OF ADMINISTRATION, 2022-2032 ($MILLION)
- TABLE 87. SOUTH AFRICA LEVODOPA MARKET, BY DISTRIBUTION CHANNELS, 2022-2032 ($MILLION)
- TABLE 88. REST OF LAMEA LEVODOPA MARKET, BY FORM, 2022-2032 ($MILLION)
- TABLE 89. REST OF LAMEA LEVODOPA MARKET, BY ROUTE OF ADMINISTRATION, 2022-2032 ($MILLION)
- TABLE 90. REST OF LAMEA LEVODOPA MARKET, BY DISTRIBUTION CHANNELS, 2022-2032 ($MILLION)
- TABLE 91. NOVARTIS AG: KEY EXECUTIVES
- TABLE 92. NOVARTIS AG: COMPANY SNAPSHOT
- TABLE 93. MERCK AND CO. INC.: KEY EXECUTIVES
- TABLE 94. MERCK AND CO. INC.: COMPANY SNAPSHOT
- TABLE 95. ELI LILLY AND COMPANY: KEY EXECUTIVES
- TABLE 96. ELI LILLY AND COMPANY: COMPANY SNAPSHOT
- TABLE 97. BRISTOL-MYERS SQUIBB CO.: KEY EXECUTIVES
- TABLE 98. BRISTOL-MYERS SQUIBB CO.: COMPANY SNAPSHOT
- TABLE 99. TEVA PHARMACEUTICAL INDUSTRIES LTD.: KEY EXECUTIVES
- TABLE 100. TEVA PHARMACEUTICAL INDUSTRIES LTD.: COMPANY SNAPSHOT
- TABLE 101. IMPAX LABORATORIES INC.: KEY EXECUTIVES
- TABLE 102. IMPAX LABORATORIES INC.: COMPANY SNAPSHOT
- TABLE 103. PFIZER INC.: KEY EXECUTIVES
- TABLE 104. PFIZER INC.: COMPANY SNAPSHOT
- TABLE 105. UCB SA: KEY EXECUTIVES
- TABLE 106. UCB SA: COMPANY SNAPSHOT
- TABLE 107. SUN PHARMACEUTICAL INDUSTRIES LTD.: KEY EXECUTIVES
- TABLE 108. SUN PHARMACEUTICAL INDUSTRIES LTD.: COMPANY SNAPSHOT
- TABLE 109. MYLAN NV: KEY EXECUTIVES
- TABLE 110. MYLAN NV: COMPANY SNAPSHOT
LIST OF FIGURES
- FIGURE 01. LEVODOPA MARKET, 2022-2032
- FIGURE 02. SEGMENTATION OF LEVODOPA MARKET,2022-2032
- FIGURE 03. TOP IMPACTING FACTORS IN LEVODOPA MARKET
- FIGURE 04. TOP INVESTMENT POCKETS IN LEVODOPA MARKET (2023-2032)
- FIGURE 05. BARGAINING POWER OF SUPPLIERS
- FIGURE 06. BARGAINING POWER OF BUYERS
- FIGURE 07. THREAT OF SUBSTITUTION
- FIGURE 08. THREAT OF SUBSTITUTION
- FIGURE 09. COMPETITIVE RIVALRY
- FIGURE 10. GLOBAL LEVODOPA MARKET:DRIVERS, RESTRAINTS AND OPPORTUNITIES
- FIGURE 11. IMPACT OF KEY REGULATION: LEVODOPA MARKET
- FIGURE 12. PATENT ANALYSIS BY COMPANY
- FIGURE 13. PATENT ANALYSIS BY COUNTRY
- FIGURE 14. LEVODOPA MARKET, BY FORM, 2022 AND 2032(%)
- FIGURE 15. COMPARATIVE SHARE ANALYSIS OF LEVODOPA MARKET FOR TABLETS, BY COUNTRY 2022 AND 2032(%)
- FIGURE 16. COMPARATIVE SHARE ANALYSIS OF LEVODOPA MARKET FOR CAPSULES, BY COUNTRY 2022 AND 2032(%)
- FIGURE 17. COMPARATIVE SHARE ANALYSIS OF LEVODOPA MARKET FOR POWDER, BY COUNTRY 2022 AND 2032(%)
- FIGURE 18. COMPARATIVE SHARE ANALYSIS OF LEVODOPA MARKET FOR LIQUID, BY COUNTRY 2022 AND 2032(%)
- FIGURE 19. LEVODOPA MARKET, BY ROUTE OF ADMINISTRATION, 2022 AND 2032(%)
- FIGURE 20. COMPARATIVE SHARE ANALYSIS OF LEVODOPA MARKET FOR ORAL, BY COUNTRY 2022 AND 2032(%)
- FIGURE 21. COMPARATIVE SHARE ANALYSIS OF LEVODOPA MARKET FOR PARENTERAL, BY COUNTRY 2022 AND 2032(%)
- FIGURE 22. LEVODOPA MARKET, BY DISTRIBUTION CHANNELS, 2022 AND 2032(%)
- FIGURE 23. COMPARATIVE SHARE ANALYSIS OF LEVODOPA MARKET FOR HOSPITAL PHARMACIES, BY COUNTRY 2022 AND 2032(%)
- FIGURE 24. COMPARATIVE SHARE ANALYSIS OF LEVODOPA MARKET FOR RETAIL PHARMACIES, BY COUNTRY 2022 AND 2032(%)
- FIGURE 25. COMPARATIVE SHARE ANALYSIS OF LEVODOPA MARKET FOR ONLINE PHARMACIES, BY COUNTRY 2022 AND 2032(%)
- FIGURE 26. COMPARATIVE SHARE ANALYSIS OF LEVODOPA MARKET FOR OTHER , BY COUNTRY 2022 AND 2032(%)
- FIGURE 27. LEVODOPA MARKET BY REGION, 2022 AND 2032(%)
- FIGURE 28. U.S. LEVODOPA MARKET, 2022-2032 ($MILLION)
- FIGURE 29. CANADA LEVODOPA MARKET, 2022-2032 ($MILLION)
- FIGURE 30. MEXICO LEVODOPA MARKET, 2022-2032 ($MILLION)
- FIGURE 31. GERMANY LEVODOPA MARKET, 2022-2032 ($MILLION)
- FIGURE 32. UK LEVODOPA MARKET, 2022-2032 ($MILLION)
- FIGURE 33. FRANCE LEVODOPA MARKET, 2022-2032 ($MILLION)
- FIGURE 34. SPAIN LEVODOPA MARKET, 2022-2032 ($MILLION)
- FIGURE 35. ITALY LEVODOPA MARKET, 2022-2032 ($MILLION)
- FIGURE 36. REST OF EUROPE LEVODOPA MARKET, 2022-2032 ($MILLION)
- FIGURE 37. CHINA LEVODOPA MARKET, 2022-2032 ($MILLION)
- FIGURE 38. JAPAN LEVODOPA MARKET, 2022-2032 ($MILLION)
- FIGURE 39. INDIA LEVODOPA MARKET, 2022-2032 ($MILLION)
- FIGURE 40. SOUTH KOREA LEVODOPA MARKET, 2022-2032 ($MILLION)
- FIGURE 41. AUSTRALIA LEVODOPA MARKET, 2022-2032 ($MILLION)
- FIGURE 42. REST OF ASIA-PACIFIC LEVODOPA MARKET, 2022-2032 ($MILLION)
- FIGURE 43. BRAZIL LEVODOPA MARKET, 2022-2032 ($MILLION)
- FIGURE 44. SAUDI ARABIA LEVODOPA MARKET, 2022-2032 ($MILLION)
- FIGURE 45. UNITED ARAB EMIRATES LEVODOPA MARKET, 2022-2032 ($MILLION)
- FIGURE 46. SOUTH AFRICA LEVODOPA MARKET, 2022-2032 ($MILLION)
- FIGURE 47. REST OF LAMEA LEVODOPA MARKET, 2022-2032 ($MILLION)
- FIGURE 48. PRODUCT MAPPING OF TOP 10 PLAYERS
- FIGURE 49. COMPETITIVE DASHBOARD
- FIGURE 50. COMPETITIVE HEATMAP: LEVODOPA MARKET
- FIGURE 51. TOP PLAYER POSITIONING, 2022
The global levodopa market is anticipated to reach $2,934.6 million by 2032, growing from $1,655.4 million in 2022 at a CAGR of 6.1% from 2023 to 2032.
Levodopa, commonly called L-Dopa, is a chemical building block converted into dopamine in the body. Dopamine is a chemical messenger secreted in the brain. It facilitates pleasure, brain function, and memory processes. Almost all patients get levodopa, a dopamine precursor that effectively controls Parkinson's disease (PD) symptoms in its early stages. Carbidopa is frequently used in combination with levodopa-containing medications to increase their efficacy by decreasing dopamine metabolism.
The levodopa market has been witnessing significant growth, owing to rise in investments in healthcare infrastructure, increase in disposable income, and surge in healthcare access in emerging markets. Moreover, as emerging economies bolster their healthcare systems, increase in availability and affordability of medications such as levodopa for Parkinson's disease management. Improved access to healthcare services translates into greater diagnosis rates and treatment initiation, consequently driving the demand for levodopa. Furthermore, increase in disposable income empowers individuals to afford essential medications, driving the market growth. In addition, the combination of these factors not only expands the patient pool but also creates new growth opportunities for pharmaceutical companies operating in the levodopa market, particularly in regions with evolving healthcare infrastructures. However, high cost associated with levodopa is one of the key factors restraining the growth of the levodopa market. Moreover, affordability issues limit patient access to this crucial medication for Parkinson's disease management, particularly in regions with limited healthcare resources and low-income populations. Furthermore, the financial problem of levodopa prevents patients from seeking consistent treatment or adhering to prescribed regimens, leading to suboptimal disease management outcomes. In addition, the high cost may strain healthcare budgets and limit reimbursement options, restraining market growth. Moreover, addressing the affordability barrier is imperative to ensure equitable access to levodopa and mitigate its impact on market growth and patient care.
On the contrary, increase in technological advancements in drug delivery systems promise to enhance levodopa's efficacy and patient adherence through innovative formulations and alternative administration routes are expected to drive the market growth. Furthermore, rise in healthcare expenditure, especially in developing regions, facilitates greater accessibility to levodopa, driving the market growth. In addition, emerging markets, coupled with increase in geriatric population, offer untapped potential for market penetration. Moreover, ongoing research initiatives and channel developments exploring novel formulations and combination therapies bolster levodopa's market prospects. Furthermore, supportive healthcare policies and reimbursement frameworks ensure widespread accessibility, while increase in disease awareness and diagnosis rates contribute to the market growth.
The key players operating in the levodopa market include Novartis AG, Merck & Co. Inc., Eli Lilly & Company, Bristol-Myers Squibb Co., Teva Pharmaceutical Industries Ltd., Impax Laboratories Inc., Pfizer Inc., UCB SA, Sun Pharmaceutical Industries Ltd., and Mylan NV. In addition, the market players are increasingly focusing on adopting strategies such as collaborations and acquisitions to gain a competitive edge in the market.
Key Benefits For Stakeholders
- This report provides a quantitative analysis of the market segments, current trends, estimations, and dynamics of the levodopa market analysis from 2022 to 2032 to identify the prevailing levodopa market opportunities.
- The market research is offered along with information related to key drivers, restraints, and opportunities.
- Porter's five forces analysis highlights the potency of buyers and suppliers to enable stakeholders make profit-oriented business decisions and strengthen their supplier-buyer network.
- In-depth analysis of the levodopa market segmentation assists to determine the prevailing market opportunities.
- Major countries in each region are mapped according to their revenue contribution to the global market.
- Market player positioning facilitates benchmarking and provides a clear understanding of the present position of the market players.
- The report includes the analysis of the regional as well as global levodopa market trends, key players, market segments, application areas, and market growth strategies.
Additional benefits you will get with this purchase are:
- Quarterly Update and* (only available with a corporate license, on listed price)
- 5 additional Company Profile of client Choice pre- or Post-purchase, as a free update.
- Free Upcoming Version on the Purchase of Five and Enterprise User License.
- 16 analyst hours of support* (post-purchase, if you find additional data requirements upon review of the report, you may receive support amounting to 16 analyst hours to solve questions, and post-sale queries)
- 15% Free Customization* (in case the scope or segment of the report does not match your requirements, 15% is equivalent to 3 working days of free work, applicable once)
- Free data Pack on the Five and Enterprise User License. (Excel version of the report)
- Free Updated report if the report is 6-12 months old or older.
- 24-hour priority response*
- Free Industry updates and white papers.
Possible Customization with this report (with additional cost and timeline, please talk to the sales executive to know more)
- Analysis of raw material in a product (by %)
- Investment Opportunities
- Technology Trend Analysis
- Market share analysis of players by products/segments
- New Product Development/ Product Matrix of Key Players
- Regulatory Guidelines
- Additional company profiles with specific to client's interest
- Additional country or region analysis- market size and forecast
- Criss-cross segment analysis- market size and forecast
- Expanded list for Company Profiles
- Historic market data
- Key player details (including location, contact details, supplier/vendor network etc. in excel format)
- List of customers/consumers/raw material suppliers- value chain analysis
- Market share analysis of players at global/region/country level
Key Market Segments
By Form
- Tablets
- Capsules
- Powder
- Liquid
By Route of Administration
- Oral
- Parenteral
By Distribution Channels
- Hospital Pharmacies
- Retail Pharmacies
- Online Pharmacies
- Other
By Region
- North America
- U.S.
- Canada
- Mexico
- Europe
- Germany
- UK
- France
- Spain
- Italy
- Rest of Europe
- Asia-Pacific
- China
- Japan
- India
- South Korea
- Australia
- Rest of Asia-Pacific
- LAMEA
- Brazil
- Saudi Arabia
- United Arab Emirates
- South Africa
- Rest of LAMEA
Key Market Players:
- Novartis AG
- Merck and Co. Inc.
- Eli Lilly and Company
- Bristol-Myers Squibb Co.
- Teva Pharmaceutical Industries Ltd.
- Impax Laboratories Inc.
- Pfizer Inc.
- UCB SA
- Sun Pharmaceutical Industries Ltd.
- Mylan Nv
TABLE OF CONTENTS
CHAPTER 1: INTRODUCTION
- 1.1. Report description
- 1.2. Key market segments
- 1.3. Key benefits to the stakeholders
- 1.4. Research methodology
- 1.4.1. Primary research
- 1.4.2. Secondary research
- 1.4.3. Analyst tools and models
CHAPTER 2: EXECUTIVE SUMMARY
- 2.1. CXO perspective
CHAPTER 3: MARKET OVERVIEW
- 3.1. Market definition and scope
- 3.2. Key findings
- 3.2.1. Top impacting factors
- 3.2.2. Top investment pockets
- 3.3. Porter's five forces analysis
- 3.4. Market dynamics
- 3.4.1. Drivers
- 3.4.2. Restraints
- 3.4.3. Opportunities
- 3.5. Average Selling Price
- 3.6. Market Share Analysis
- 3.7. Brand Share Analysis
- 3.8. Trade Data Analysis
- 3.9. Product Consumption
- 3.10. Value Chain Analysis
- 3.11. Regulatory Guidelines
- 3.12. Key Regulation Analysis
- 3.13. Reimbursement Scenario
- 3.14. Patent Landscape
CHAPTER 4: LEVODOPA MARKET, BY FORM
- 4.1. Overview
- 4.1.1. Market size and forecast
- 4.2. Tablets
- 4.2.1. Key market trends, growth factors and opportunities
- 4.2.2. Market size and forecast, by region
- 4.2.3. Market share analysis by country
- 4.3. Capsules
- 4.3.1. Key market trends, growth factors and opportunities
- 4.3.2. Market size and forecast, by region
- 4.3.3. Market share analysis by country
- 4.4. Powder
- 4.4.1. Key market trends, growth factors and opportunities
- 4.4.2. Market size and forecast, by region
- 4.4.3. Market share analysis by country
- 4.5. Liquid
- 4.5.1. Key market trends, growth factors and opportunities
- 4.5.2. Market size and forecast, by region
- 4.5.3. Market share analysis by country
CHAPTER 5: LEVODOPA MARKET, BY ROUTE OF ADMINISTRATION
- 5.1. Overview
- 5.1.1. Market size and forecast
- 5.2. Oral
- 5.2.1. Key market trends, growth factors and opportunities
- 5.2.2. Market size and forecast, by region
- 5.2.3. Market share analysis by country
- 5.3. Parenteral
- 5.3.1. Key market trends, growth factors and opportunities
- 5.3.2. Market size and forecast, by region
- 5.3.3. Market share analysis by country
CHAPTER 6: LEVODOPA MARKET, BY DISTRIBUTION CHANNELS
- 6.1. Overview
- 6.1.1. Market size and forecast
- 6.2. Hospital Pharmacies
- 6.2.1. Key market trends, growth factors and opportunities
- 6.2.2. Market size and forecast, by region
- 6.2.3. Market share analysis by country
- 6.3. Retail Pharmacies
- 6.3.1. Key market trends, growth factors and opportunities
- 6.3.2. Market size and forecast, by region
- 6.3.3. Market share analysis by country
- 6.4. Online Pharmacies
- 6.4.1. Key market trends, growth factors and opportunities
- 6.4.2. Market size and forecast, by region
- 6.4.3. Market share analysis by country
- 6.5. Other
- 6.5.1. Key market trends, growth factors and opportunities
- 6.5.2. Market size and forecast, by region
- 6.5.3. Market share analysis by country
CHAPTER 7: LEVODOPA MARKET, BY REGION
- 7.1. Overview
- 7.1.1. Market size and forecast By Region
- 7.2. North America
- 7.2.1. Key market trends, growth factors and opportunities
- 7.2.2. Market size and forecast, by Form
- 7.2.3. Market size and forecast, by Route of Administration
- 7.2.4. Market size and forecast, by Distribution Channels
- 7.2.5. Market size and forecast, by country
- 7.2.5.1. U.S.
- 7.2.5.1.1. Market size and forecast, by Form
- 7.2.5.1.2. Market size and forecast, by Route of Administration
- 7.2.5.1.3. Market size and forecast, by Distribution Channels
- 7.2.5.2. Canada
- 7.2.5.2.1. Market size and forecast, by Form
- 7.2.5.2.2. Market size and forecast, by Route of Administration
- 7.2.5.2.3. Market size and forecast, by Distribution Channels
- 7.2.5.3. Mexico
- 7.2.5.3.1. Market size and forecast, by Form
- 7.2.5.3.2. Market size and forecast, by Route of Administration
- 7.2.5.3.3. Market size and forecast, by Distribution Channels
- 7.3. Europe
- 7.3.1. Key market trends, growth factors and opportunities
- 7.3.2. Market size and forecast, by Form
- 7.3.3. Market size and forecast, by Route of Administration
- 7.3.4. Market size and forecast, by Distribution Channels
- 7.3.5. Market size and forecast, by country
- 7.3.5.1. Germany
- 7.3.5.1.1. Market size and forecast, by Form
- 7.3.5.1.2. Market size and forecast, by Route of Administration
- 7.3.5.1.3. Market size and forecast, by Distribution Channels
- 7.3.5.2. UK
- 7.3.5.2.1. Market size and forecast, by Form
- 7.3.5.2.2. Market size and forecast, by Route of Administration
- 7.3.5.2.3. Market size and forecast, by Distribution Channels
- 7.3.5.3. France
- 7.3.5.3.1. Market size and forecast, by Form
- 7.3.5.3.2. Market size and forecast, by Route of Administration
- 7.3.5.3.3. Market size and forecast, by Distribution Channels
- 7.3.5.4. Spain
- 7.3.5.4.1. Market size and forecast, by Form
- 7.3.5.4.2. Market size and forecast, by Route of Administration
- 7.3.5.4.3. Market size and forecast, by Distribution Channels
- 7.3.5.5. Italy
- 7.3.5.5.1. Market size and forecast, by Form
- 7.3.5.5.2. Market size and forecast, by Route of Administration
- 7.3.5.5.3. Market size and forecast, by Distribution Channels
- 7.3.5.6. Rest of Europe
- 7.3.5.6.1. Market size and forecast, by Form
- 7.3.5.6.2. Market size and forecast, by Route of Administration
- 7.3.5.6.3. Market size and forecast, by Distribution Channels
- 7.4. Asia-Pacific
- 7.4.1. Key market trends, growth factors and opportunities
- 7.4.2. Market size and forecast, by Form
- 7.4.3. Market size and forecast, by Route of Administration
- 7.4.4. Market size and forecast, by Distribution Channels
- 7.4.5. Market size and forecast, by country
- 7.4.5.1. China
- 7.4.5.1.1. Market size and forecast, by Form
- 7.4.5.1.2. Market size and forecast, by Route of Administration
- 7.4.5.1.3. Market size and forecast, by Distribution Channels
- 7.4.5.2. Japan
- 7.4.5.2.1. Market size and forecast, by Form
- 7.4.5.2.2. Market size and forecast, by Route of Administration
- 7.4.5.2.3. Market size and forecast, by Distribution Channels
- 7.4.5.3. India
- 7.4.5.3.1. Market size and forecast, by Form
- 7.4.5.3.2. Market size and forecast, by Route of Administration
- 7.4.5.3.3. Market size and forecast, by Distribution Channels
- 7.4.5.4. South Korea
- 7.4.5.4.1. Market size and forecast, by Form
- 7.4.5.4.2. Market size and forecast, by Route of Administration
- 7.4.5.4.3. Market size and forecast, by Distribution Channels
- 7.4.5.5. Australia
- 7.4.5.5.1. Market size and forecast, by Form
- 7.4.5.5.2. Market size and forecast, by Route of Administration
- 7.4.5.5.3. Market size and forecast, by Distribution Channels
- 7.4.5.6. Rest of Asia-Pacific
- 7.4.5.6.1. Market size and forecast, by Form
- 7.4.5.6.2. Market size and forecast, by Route of Administration
- 7.4.5.6.3. Market size and forecast, by Distribution Channels
- 7.5. LAMEA
- 7.5.1. Key market trends, growth factors and opportunities
- 7.5.2. Market size and forecast, by Form
- 7.5.3. Market size and forecast, by Route of Administration
- 7.5.4. Market size and forecast, by Distribution Channels
- 7.5.5. Market size and forecast, by country
- 7.5.5.1. Brazil
- 7.5.5.1.1. Market size and forecast, by Form
- 7.5.5.1.2. Market size and forecast, by Route of Administration
- 7.5.5.1.3. Market size and forecast, by Distribution Channels
- 7.5.5.2. Saudi Arabia
- 7.5.5.2.1. Market size and forecast, by Form
- 7.5.5.2.2. Market size and forecast, by Route of Administration
- 7.5.5.2.3. Market size and forecast, by Distribution Channels
- 7.5.5.3. United Arab Emirates
- 7.5.5.3.1. Market size and forecast, by Form
- 7.5.5.3.2. Market size and forecast, by Route of Administration
- 7.5.5.3.3. Market size and forecast, by Distribution Channels
- 7.5.5.4. South Africa
- 7.5.5.4.1. Market size and forecast, by Form
- 7.5.5.4.2. Market size and forecast, by Route of Administration
- 7.5.5.4.3. Market size and forecast, by Distribution Channels
- 7.5.5.5. Rest of LAMEA
- 7.5.5.5.1. Market size and forecast, by Form
- 7.5.5.5.2. Market size and forecast, by Route of Administration
- 7.5.5.5.3. Market size and forecast, by Distribution Channels
CHAPTER 8: COMPETITIVE LANDSCAPE
- 8.1. Introduction
- 8.2. Top winning strategies
- 8.3. Product mapping of top 10 player
- 8.4. Competitive dashboard
- 8.5. Competitive heatmap
- 8.6. Top player positioning, 2022
CHAPTER 9: COMPANY PROFILES
- 9.1. Novartis AG
- 9.1.1. Company overview
- 9.1.2. Key executives
- 9.1.3. Company snapshot
- 9.2. Merck and Co. Inc.
- 9.2.1. Company overview
- 9.2.2. Key executives
- 9.2.3. Company snapshot
- 9.3. Eli Lilly and Company
- 9.3.1. Company overview
- 9.3.2. Key executives
- 9.3.3. Company snapshot
- 9.4. Bristol-Myers Squibb Co.
- 9.4.1. Company overview
- 9.4.2. Key executives
- 9.4.3. Company snapshot
- 9.5. Teva Pharmaceutical Industries Ltd.
- 9.5.1. Company overview
- 9.5.2. Key executives
- 9.5.3. Company snapshot
- 9.6. Impax Laboratories Inc.
- 9.6.1. Company overview
- 9.6.2. Key executives
- 9.6.3. Company snapshot
- 9.7. Pfizer Inc.
- 9.7.1. Company overview
- 9.7.2. Key executives
- 9.7.3. Company snapshot
- 9.8. UCB SA
- 9.8.1. Company overview
- 9.8.2. Key executives
- 9.8.3. Company snapshot
- 9.9. Sun Pharmaceutical Industries Ltd.
- 9.9.1. Company overview
- 9.9.2. Key executives
- 9.9.3. Company snapshot
- 9.10. Mylan Nv
- 9.10.1. Company overview
- 9.10.2. Key executives
- 9.10.3. Company snapshot
