|
|
市場調査レポート
商品コード
1609615
パーキンソン病における脳深部刺激の市場規模、シェア、動向分析レポート:製品別、最終用途別、地域別、セグメント予測、2025年~2030年Deep Brain Stimulation In Parkinson's Disease Market Size, Share & Trends Analysis Report By Product (Single-channel, Dual-channel), By End-use (Hospitals, ASCs), By Region, And Segment Forecasts, 2025 - 2030 |
||||||
|
|||||||
カスタマイズ可能
|
|||||||

| パーキンソン病における脳深部刺激の市場規模、シェア、動向分析レポート:製品別、最終用途別、地域別、セグメント予測、2025年~2030年 |
|
出版日: 2024年11月05日
発行: Grand View Research
ページ情報: 英文 100 Pages
納期: 2~10営業日
|

全表示
- 概要
- 図表
- 目次
パーキンソン病における脳深部刺激市場の成長と動向:
Grand View Research, Inc.の最新レポートによると、パーキンソン病における脳深部刺激の世界市場規模は2030年までに16億1,000万米ドルに達し、2025年から2030年までのCAGRは10.1%で拡大すると予測されています。
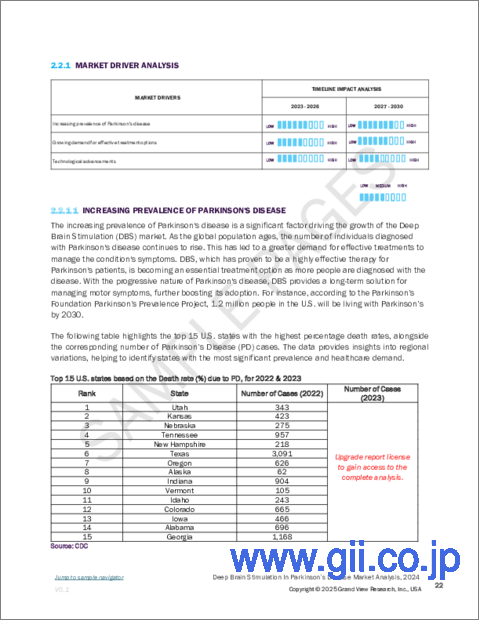
パーキンソン病(PD)の罹患率の急増とPDにおける脳深部刺激に関する認知度の高まりが市場を牽引しています。
パーキンソン病の有病率の上昇が、代替療法としての脳深部刺激療法への需要を高めています。脳深部刺激は、パーキンソン病の症状に対する治療的解決策を提供する上で重要な役割を果たすことが証明されており、予測期間中の市場成長を促進すると期待されています。
さらに、患者の予後改善による低侵襲治療への需要の高まりは、この市場にとってインパクトの大きいレンダリング要因です。これは、高いコスト効率、最小限の痛み、安全性、短い入院期間、迅速な回復、術後の問題のケースの少なさによるものです。これらの主な要因は、予測期間中に脳深部刺激装置の需要を高めると予測されています。
さらに、術後成績の改善やPD症状の治療における副作用の軽減を目的とした主要企業による技術的進歩も、脳深部刺激療法の需要を高めると予想されます。例えば、2020年1月、アボット社のInfinity脳深部刺激システムは、FDAからPD治療の適応拡大承認を獲得しました。このシステムにより、パーキンソン病症状と関連する内淡蒼球(GPi)と呼ばれる脳の特定部位を患者の標的とすることが可能になります。
パーキンソン病における脳深部刺激市場レポート・ハイライト
- デュアルチャネルは、患者の震えを抑えるのに非常に効果的であるため、脳神経外科医による採用が増加しており、2024年には56.9%のシェアで市場を独占しました。
- 最終用途別では、脳深部刺激療法は最も複雑で重要な手術であり、高品質で耐久性のある機器が利用可能なため病院で実施されるため、2024年には病院が市場を独占しました。
- 北米は、精神障害の有病率や同地域に確立されたヘルスケア施設が存在することから、2024年に市場を席巻しました。
目次
第1章 調査手法と範囲
第2章 エグゼクティブサマリー
第3章 パーキンソン病における脳深部刺激市場の変数、動向、範囲
- 市場系統の見通し
- 市場力学
- 市場促進要因分析
- 市場抑制要因分析
- ビジネス環境分析
- 業界分析- ポーターのファイブフォース分析
- PESTLE分析
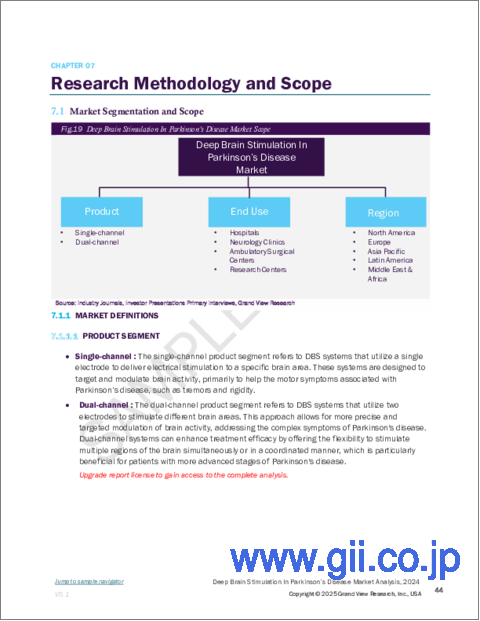
第4章 パーキンソン病における脳深部刺激市場:製品の展望、推定と予測
- パーキンソン病における脳深部刺激市場:製品変動分析、2024年および2030年
- シングルチャンネル
- デュアルチャネル
第5章 パーキンソン病における脳深部刺激市場:最終用途の展望、推定と予測
- パーキンソン病における脳深部刺激市場:最終用途変動分析、2024年および2030年
- 病院
- 神経科クリニック
- 外来手術センター
- 研究センター
第6章 パーキンソン病における脳深部刺激市場:地域の展望、推定および予測
- 地域別市場シェア分析、2024年および2030年
- 地域市場ダッシュボード
- 市場規模、予測動向分析、2018年から2030年:
- 北米
- 北米市場推計・予測、2018年-2030年
- 米国
- カナダ
- メキシコ
- 欧州
- 欧州市場推計・予測、2018年-2030年
- ドイツ
- 英国
- イタリア
- フランス
- イタリア
- スペイン
- デンマーク
- スウェーデン
- ノルウェー
- アジア太平洋
- アジア太平洋市場推計・予測、2018年-2030年
- 中国
- 日本
- インド
- インドネシア
- 韓国
- タイ
- オーストラリア
- フィリピン
- マレーシア
- シンガポール
- ラテンアメリカ
- ラテンアメリカ市場推計・予測、2018年-2030年
- ブラジル
- アルゼンチン
- コロンビア
- チリ
- ベネズエラ
- 中東・アフリカ
- 中東・アフリカ市場推計・予測、2018-2030
- 南アフリカ
- サウジアラビア
- アラブ首長国連邦
- トルコ
- イラン
- クウェート
第7章 競合情勢
- 主要市場参入企業による最近の動向と影響分析
- ベンダー情勢
- 企業分類
- 主要販売代理店およびチャネルパートナーのリスト
- 潜在顧客/エンドユーザーのリスト
- 競争のダイナミクス
- 競合ベンチマーキング
- 戦略マッピング
- ヒートマップ分析
- 企業プロファイル/リスト
- ABBOTT
- Medtronic
- Boston Scientific Corporation
List of Tables
- Table 1. List of abbreviations
- Table 2. Deep brain stimulation in Parkinson's disease market estimates and forecasts, by Product, 2018 - 2030 (USD Million)
- Table 3. Deep brain stimulation in Parkinson's disease market estimates and forecasts, by end-use, 2018 - 2030 (USD Million)
- Table 4. Deep brain stimulation in Parkinson's disease market estimates and forecasts, by region, 2018 - 2030 (USD Million)
- Table 5. North America deep brain stimulation in Parkinson's disease market estimates and forecasts, by country, 2018 - 2030 (USD Million)
- Table 6. North America deep brain stimulation in Parkinson's disease market estimates and forecasts, by product, 2018 - 2030 (USD Million)
- Table 7. North America deep brain stimulation in Parkinson's disease market estimates and forecasts, by end-use, 2018 - 2030 (USD Million)
- Table 8. U.S. deep brain stimulation in Parkinson's disease market estimates and forecasts, by product, 2018 - 2030 (USD Million)
- Table 9. U.S. deep brain stimulation in Parkinson's disease market estimates and forecasts, by end-use, 2018 - 2030 (USD Million)
- Table 10. Canada deep brain stimulation in Parkinson's disease market estimates and forecasts, by product, 2018 - 2030 (USD Million)
- Table 11. Canada deep brain stimulation in Parkinson's disease market estimates and forecasts, by end-use, 2018 - 2030 (USD Million)
- Table 12. Mexico deep brain stimulation in Parkinson's disease market estimates and forecasts, by product, 2018 - 2030 (USD Million)
- Table 13. Mexico deep brain stimulation in Parkinson's disease market estimates and forecasts, by end-use, 2018 - 2030 (USD Million)
- Table 14. Europe deep brain stimulation in Parkinson's disease market estimates and forecasts, by country, 2018 - 2030 (USD Million)
- Table 15. Europe deep brain stimulation in Parkinson's disease market estimates and forecasts, by product, 2018 - 2030 (USD Million)
- Table 16. Europe deep brain stimulation in Parkinson's disease market estimates and forecasts, by end-use, 2018 - 2030 (USD Million)
- Table 17. UK deep brain stimulation in Parkinson's disease market estimates and forecasts, by product, 2018 - 2030 (USD Million)
- Table 18. UK deep brain stimulation in Parkinson's disease market estimates and forecasts, by end-use, 2018 - 2030 (USD Million)
- Table 19. Germany deep brain stimulation in Parkinson's disease market estimates and forecasts, by product, 2018 - 2030 (USD Million)
- Table 20. Germany deep brain stimulation in Parkinson's disease market estimates and forecasts, by end-use, 2018 - 2030 (USD Million)
- Table 21. France deep brain stimulation in Parkinson's disease market estimates and forecasts, by product, 2018 - 2030 (USD Million)
- Table 22. France deep brain stimulation in Parkinson's disease market estimates and forecasts, by end-use, 2018 - 2030 (USD Million)
- Table 23. Italy deep brain stimulation in Parkinson's disease market estimates and forecasts, by product, 2018 - 2030 (USD Million)
- Table 24. Italy deep brain stimulation in Parkinson's disease market estimates and forecasts, by end-use, 2018 - 2030 (USD Million)
- Table 25. Spain deep brain stimulation in Parkinson's disease market estimates and forecasts, by product, 2018 - 2030 (USD Million)
- Table 26. Spain deep brain stimulation in Parkinson's disease market estimates and forecasts, by end-use, 2018 - 2030 (USD Million)
- Table 27. Denmark deep brain stimulation in Parkinson's disease market estimates and forecasts, by product, 2018 - 2030 (USD Million)
- Table 28. Denmark deep brain stimulation in Parkinson's disease market estimates and forecasts, by end-use, 2018 - 2030 (USD Million)
- Table 29. Sweden deep brain stimulation in Parkinson's disease market estimates and forecasts, by product, 2018 - 2030 (USD Million)
- Table 30. Sweden deep brain stimulation in Parkinson's disease market estimates and forecasts, by end-use, 2018 - 2030 (USD Million)
- Table 31. Norway deep brain stimulation in Parkinson's disease market estimates and forecasts, by product, 2018 - 2030 (USD Million)
- Table 32. Norway deep brain stimulation in Parkinson's disease market estimates and forecasts, by end-use, 2018 - 2030 (USD Million)
- Table 33. Asia Pacific deep brain stimulation in Parkinson's disease market estimates and forecasts, by country, 2018 - 2030 (USD Million)
- Table 34. Asia Pacific deep brain stimulation in Parkinson's disease market estimates and forecasts, by product, 2018 - 2030 (USD Million)
- Table 35. Asia Pacific deep brain stimulation in Parkinson's disease market estimates and forecasts, by end-use, 2018 - 2030 (USD Million)
- Table 36. Japan deep brain stimulation in Parkinson's disease market estimates and forecasts, by product, 2018 - 2030 (USD Million)
- Table 37. Japan deep brain stimulation in Parkinson's disease market estimates and forecasts, by end-use, 2018 - 2030 (USD Million)
- Table 38. China deep brain stimulation in Parkinson's disease market estimates and forecasts, by product, 2018 - 2030 (USD Million)
- Table 39. China deep brain stimulation in Parkinson's disease market estimates and forecasts, by end-use, 2018 - 2030 (USD Million)
- Table 40. India deep brain stimulation in Parkinson's disease market estimates and forecasts, by product, 2018 - 2030 (USD Million)
- Table 41. India deep brain stimulation in Parkinson's disease market estimates and forecasts, by end-use, 2018 - 2030 (USD Million)
- Table 42. Indonesia deep brain stimulation in Parkinson's disease market estimates and forecasts, by product, 2018 - 2030 (USD Million)
- Table 43. Indonesia deep brain stimulation in Parkinson's disease market estimates and forecasts, by end-use, 2018 - 2030 (USD Million)
- Table 44. South Korea deep brain stimulation in Parkinson's disease market estimates and forecasts, by product, 2018 - 2030 (USD Million)
- Table 45. South Korea deep brain stimulation in Parkinson's disease market estimates and forecasts, by end-use, 2018 - 2030 (USD Million)
- Table 46. Thailand deep brain stimulation in Parkinson's disease market estimates and forecasts, by product, 2018 - 2030 (USD Million)
- Table 47. Thailand deep brain stimulation in Parkinson's disease market estimates and forecasts, by end-use, 2018 - 2030 (USD Million)
- Table 48. Australia deep brain stimulation in Parkinson's disease market estimates and forecasts, by product, 2018 - 2030 (USD Million)
- Table 49. Australia deep brain stimulation in Parkinson's disease market estimates and forecasts, by end-use, 2018 - 2030 (USD Million)
- Table 50. Philippines deep brain stimulation in Parkinson's disease market estimates and forecasts, by product, 2018 - 2030 (USD Million)
- Table 51. Philippines deep brain stimulation in Parkinson's disease market estimates and forecasts, by end-use, 2018 - 2030 (USD Million)
- Table 52. Malaysia deep brain stimulation in Parkinson's disease market estimates and forecasts, by product, 2018 - 2030 (USD Million)
- Table 53. Malaysia deep brain stimulation in Parkinson's disease market estimates and forecasts, by end-use, 2018 - 2030 (USD Million)
- Table 54. Singapore deep brain stimulation in Parkinson's disease market estimates and forecasts, by product, 2018 - 2030 (USD Million)
- Table 55. Singapore deep brain stimulation in Parkinson's disease market estimates and forecasts, by end-use, 2018 - 2030 (USD Million)
- Table 56. Latin America deep brain stimulation in Parkinson's disease market estimates and forecasts, by country, 2018 - 2030 (USD Million)
- Table 57. Latin America deep brain stimulation in Parkinson's disease market estimates and forecasts, by product, 2018 - 2030 (USD Million)
- Table 58. Latin America deep brain stimulation in Parkinson's disease market estimates and forecasts, by end-use, 2018 - 2030 (USD Million)
- Table 59. Brazil deep brain stimulation in Parkinson's disease market estimates and forecasts, by product, 2018 - 2030 (USD Million)
- Table 60. Brazil deep brain stimulation in Parkinson's disease market estimates and forecasts, by end-use, 2018 - 2030 (USD Million)
- Table 61. Argentina deep brain stimulation in Parkinson's disease market estimates and forecasts, by product, 2018 - 2030 (USD Million)
- Table 62. Argentina deep brain stimulation in Parkinson's disease market estimates and forecasts, by end-use, 2018 - 2030 (USD Million)
- Table 63. Colombia deep brain stimulation in Parkinson's disease market estimates and forecasts, by product, 2018 - 2030 (USD Million)
- Table 64. Colombia deep brain stimulation in Parkinson's disease market estimates and forecasts, by end-use, 2018 - 2030 (USD Million)
- Table 65. Chile deep brain stimulation in Parkinson's disease market estimates and forecasts, by product, 2018 - 2030 (USD Million)
- Table 66. Chile deep brain stimulation in Parkinson's disease market estimates and forecasts, by end-use, 2018 - 2030 (USD Million)
- Table 67. Venezuela deep brain stimulation in Parkinson's disease market estimates and forecasts, by product, 2018 - 2030 (USD Million)
- Table 68. Venezuela deep brain stimulation in Parkinson's disease market estimates and forecasts, by end-use, 2018 - 2030 (USD Million)
- Table 69. Middle East & Africa deep brain stimulation in Parkinson's disease market estimates and forecasts, by country, 2018 - 2030 (USD Million)
- Table 70. Middle East & Africa deep brain stimulation in Parkinson's disease market estimates and forecasts, by product, 2018 - 2030 (USD Million)
- Table 71. Middle East & Africa deep brain stimulation in Parkinson's disease market estimates and forecasts, by end-use, 2018 - 2030 (USD Million)
- Table 72. South Africa deep brain stimulation in Parkinson's disease market estimates and forecasts, by end-use, 2018 - 2030 (USD Million)
- Table 73. South Africa deep brain stimulation in Parkinson's disease market estimates and forecasts, by end-use, 2018 - 2030 (USD Million)
- Table 74. Saudi Arabia deep brain stimulation in Parkinson's disease market estimates and forecasts, by end-use, 2018 - 2030 (USD Million)
- Table 75. Saudi Arabia deep brain stimulation in Parkinson's disease market estimates and forecasts, by end-use, 2018 - 2030 (USD Million)
- Table 76. UAE deep brain stimulation in Parkinson's disease market estimates and forecasts, by end-use, 2018 - 2030 (USD Million)
- Table 77. UAE deep brain stimulation in Parkinson's disease market estimates and forecasts, by end-use, 2018 - 2030 (USD Million)
- Table 78. Turkey deep brain stimulation in Parkinson's disease market estimates and forecasts, by end-use, 2018 - 2030 (USD Million)
- Table 79. Turkey deep brain stimulation in Parkinson's disease market estimates and forecasts, by end-use, 2018 - 2030 (USD Million)
- Table 80. Iran deep brain stimulation in Parkinson's disease market estimates and forecasts, by end-use, 2018 - 2030 (USD Million)
- Table 81. Iran deep brain stimulation in Parkinson's disease market estimates and forecasts, by end-use, 2018 - 2030 (USD Million)
- Table 82. Kuwait deep brain stimulation in Parkinson's disease market estimates and forecasts, by end-use, 2018 - 2030 (USD Million)
- Table 83. Kuwait deep brain stimulation in Parkinson's disease market estimates and forecasts, by end-use, 2018 - 2030 (USD Million)
List of Figures
- Fig. 1 Market segmentation
- Fig. 2 Information procurement
- Fig. 3 Data analysis models
- Fig. 4 Market formulation and validation
- Fig. 5 Market snapshot
- Fig. 6 Segmental outlook- Product, and End Use
- Fig. 7 Competitive outlook
- Fig. 8 Value chain analysis
- Fig. 9 Market dynamics
- Fig. 10 Porter's analysis
- Fig. 11 PESTEL analysis
- Fig. 12 Deep brain stimulation In Parkinson's disease market, by product: Key takeaways
- Fig. 13 Deep brain stimulation In Parkinson's disease market, by product: Market share, 2024 & 2030
- Fig. 14 Deep brain stimulation In Parkinson's disease market, by end use: Key takeaways
- Fig. 15 Deep brain stimulation In Parkinson's disease market, by end use: Market share, 2024 & 2030
- Fig. 16 Deep brain stimulation In Parkinson's disease market, by region: Key takeaways
- Fig. 17 Deep brain stimulation In Parkinson's disease market, by region: Market share, 2024 & 2030
Deep Brain Stimulation In Parkinson's Disease Market Growth & Trends:
The global deep brain stimulation in Parkinson's disease market size is anticipated to reach USD 1.61 billion by 2030, according to a new report by Grand View Research, Inc., expanding at a CAGR of 10.1% from 2025 to 2030. Surge in the incidence of Parkinson's Disease (PD) and growing awareness about the deep brain stimulation in PD are driving the market.
Rising prevalence of Parkinson's disease has raised the demand for deep brain stimulators as an alternative therapy. Deep brain stimulation has been proved to play an important role in providing therapeutic solutions for the symptoms of Parkinson's disease, which is expected to fuel the market growth during the forecast period.
Moreover, increasing demand for minimally invasive therapies due to improved patient outcomes is a high impact rendering driver for this market. This is due to high cost efficiency, minimal pain, safety, short duration of hospital stays, speedy recovery, and few cases of post-surgical problems. These key factors are anticipated to raise the demand for deep brain stimulators over the forecast period.
In addition, technological advancements by the key players for the improved postoperative outcomes and reduced adverse effects in the treatment of PD symptoms are anticipated to raise the demand for deep brain stimulation. For instance, in January 2020, Abbott's Infinity deep brain stimulation system has secured expanded indication approval from the FDA for the treatment of PD. This system will allow to target patients' specific area of the brain called internal globus pallidus (GPi), which is associated with Parkinson's disease symptoms.
Deep Brain Stimulation In Parkinson's Disease Market Report Highlights:
- The dual channel segment dominated the market with the share of 56.9% in 2024 owing to its increasing adoption by neurosurgeons as it is highly effective in reducing patient tremors
- On the basis of end-use, hospitals dominated the market in 2024 since deep brain stimulation procedures are the most complicated and critical surgeries that are performed in hospitals due to availability of high quality and durable equipment
- North America dominated the market with in 2024 owing to prevalence of psychological disorders and presence of well-established healthcare facilities in the region.
Table of Contents
Chapter 1. Methodology and Scope
- 1.1. Market Segmentation & Scope
- 1.2. Market Definition
- 1.3. Information Procurement
- 1.3.1. Purchased Database
- 1.3.2. GVR's Internal Database
- 1.3.3. Secondary Sources & Third-Party Perspectives
- 1.3.4. Primary Research
- 1.4. Information Analysis
- 1.4.1. Data Analysis Models
- 1.5. Market Formulation & Data Visualization
- 1.6. Data Validation & Publishing
Chapter 2. Executive Summary
- 2.1. Market Insights
- 2.2. Segmental Outlook
- 2.3. Competitive Outlook
Chapter 3. Deep Brain Stimulation In Parkinson's Disease Market Variables, Trends & Scope
- 3.1. Market Lineage Outlook
- 3.2. Market Dynamics
- 3.2.1. Market Driver Analysis
- 3.2.2. Market Restraint Analysis
- 3.3. Business Environment Analysis
- 3.3.1. Industry Analysis - Porter's Five Forces Analysis
- 3.3.1.1. Supplier power
- 3.3.1.2. Buyer power
- 3.3.1.3. Substitution threat
- 3.3.1.4. Threat of new entrant
- 3.3.1.5. Competitive rivalry
- 3.3.2. PESTLE Analysis
- 3.3.1. Industry Analysis - Porter's Five Forces Analysis
Chapter 4. Deep Brain Stimulation In Parkinson's Disease Market: Product Outlook Estimates & Forecasts
- 4.1. Deep Brain Stimulation In Parkinson's Disease Market: Product Movement Analysis, 2024 & 2030
- 4.1.1. Single-channel
- 4.1.1.1. Market estimates and forecast, 2018 - 2030 (USD Million)
- 4.1.2. Dual-channel
- 4.1.2.1. Market estimates and forecast, 2018 - 2030 (USD Million)
- 4.1.1. Single-channel
Chapter 5. Deep Brain Stimulation In Parkinson's Disease Market: End Use Outlook Estimates & Forecasts
- 5.1. Deep Brain Stimulation In Parkinson's Disease Market: End Use Movement Analysis, 2024 & 2030
- 5.1.1. Hospitals
- 5.1.1.1. Market estimates and forecast, 2018 - 2030 (USD Million)
- 5.1.2. Neurology Clinics
- 5.1.2.1. Market estimates and forecast, 2018 - 2030 (USD Million)
- 5.1.3. Ambulatory Surgical Centers
- 5.1.3.1. Market estimates and forecast, 2018 - 2030 (USD Million)
- 5.1.4. Research Centers
- 5.1.4.1. Market estimates and forecast, 2018 - 2030 (USD Million)
- 5.1.1. Hospitals
Chapter 6. Deep Brain Stimulation In Parkinson's Disease Market Regional Outlook Estimates & Forecasts
- 6.1. Regional Market Share Analysis, 2024 & 2030
- 6.2. Regional Market Dashboard
- 6.3. Market Size, & Forecasts Trend Analysis, 2018 to 2030:
- 6.4. North America
- 6.4.1. North America market estimates and forecasts, 2018 - 2030 (USD Million)
- 6.4.2. U.S.
- 6.4.2.1. Key country dynamics
- 6.4.2.2. Regulatory framework
- 6.4.2.3. Competitive insights
- 6.4.2.4. Market estimates and forecasts, 2018 - 2030 (USD Million)
- 6.4.3. Canada
- 6.4.3.1. Key country dynamics
- 6.4.3.2. Regulatory framework
- 6.4.3.3. Competitive insights
- 6.4.3.4. Market estimates and forecasts, 2018 - 2030 (USD Million)
- 6.4.4. Mexico
- 6.4.4.1. Key country dynamics
- 6.4.4.2. Regulatory framework
- 6.4.4.3. Competitive insights
- 6.4.4.4. Market estimates and forecasts, 2018 - 2030 (USD Million)
- 6.5. Europe
- 6.5.1. Europe market estimates and forecasts, 2018 - 2030 (USD Million)
- 6.5.2. Germany
- 6.5.2.1. Key country dynamics
- 6.5.2.2. Regulatory framework
- 6.5.2.3. Competitive insights
- 6.5.2.4. Market estimates and forecasts, 2018 - 2030 (USD Million)
- 6.5.3. UK
- 6.5.3.1. Key country dynamics
- 6.5.3.2. Regulatory framework
- 6.5.3.3. Competitive insights
- 6.5.3.4. Market estimates and forecasts, 2018 - 2030 (USD Million)
- 6.5.4. Italy
- 6.5.4.1. Key country dynamics
- 6.5.4.2. Regulatory framework
- 6.5.4.3. Competitive insights
- 6.5.4.4. Market estimates and forecasts, 2018 - 2030 (USD Million)
- 6.5.5. France
- 6.5.5.1. Key country dynamics
- 6.5.5.2. Regulatory framework
- 6.5.5.3. Competitive insights
- 6.5.5.4. Market estimates and forecasts, 2018 - 2030 (USD Million)
- 6.5.6. Italy
- 6.5.6.1. Key country dynamics
- 6.5.6.2. Regulatory framework
- 6.5.6.3. Competitive insights
- 6.5.6.4. Market estimates and forecasts, 2018 - 2030 (USD Million)
- 6.5.7. Spain
- 6.5.7.1. Key country dynamics
- 6.5.7.2. Regulatory framework
- 6.5.7.3. Competitive insights
- 6.5.7.4. Market estimates and forecasts, 2018 - 2030 (USD Million)
- 6.5.8. Denmark
- 6.5.8.1. Key country dynamics
- 6.5.8.2. Regulatory framework
- 6.5.8.3. Competitive insights
- 6.5.8.4. Market estimates and forecasts, 2018 - 2030 (USD Million)
- 6.5.9. Sweden
- 6.5.9.1. Key country dynamics
- 6.5.9.2. Regulatory framework
- 6.5.9.3. Competitive insights
- 6.5.9.4. Market estimates and forecasts, 2018 - 2030 (USD Million)
- 6.5.10. Norway
- 6.5.10.1. Key country dynamics
- 6.5.10.2. Regulatory framework
- 6.5.10.3. Competitive insights
- 6.5.10.4. Market estimates and forecasts, 2018 - 2030 (USD Million)
- 6.6. Asia Pacific
- 6.6.1. Asia Pacific market estimates and forecasts, 2018 - 2030 (USD Million)
- 6.6.2. China
- 6.6.2.1. Key country dynamics
- 6.6.2.2. Regulatory framework
- 6.6.2.3. Competitive insights
- 6.6.2.4. Market estimates and forecasts, 2018 - 2030 (USD Million)
- 6.6.3. Japan
- 6.6.3.1. Key country dynamics
- 6.6.3.2. Regulatory framework
- 6.6.3.3. Competitive insights
- 6.6.3.4. Market estimates and forecasts, 2018 - 2030 (USD Million)
- 6.6.4. India
- 6.6.4.1. Key country dynamics
- 6.6.4.2. Regulatory framework
- 6.6.4.3. Competitive insights
- 6.6.4.4. Market estimates and forecasts, 2018 - 2030 (USD Million)
- 6.6.5. Indonesia
- 6.6.5.1. Key country dynamics
- 6.6.5.2. Regulatory framework
- 6.6.5.3. Competitive insights
- 6.6.5.4. Market estimates and forecasts, 2018 - 2030 (USD Million)
- 6.6.6. South Korea
- 6.6.6.1. Key country dynamics
- 6.6.6.2. Regulatory framework
- 6.6.6.3. Competitive insights
- 6.6.6.4. Market estimates and forecasts, 2018 - 2030 (USD Million)
- 6.6.7. Thailand
- 6.6.7.1. Key country dynamics
- 6.6.7.2. Regulatory framework
- 6.6.7.3. Competitive insights
- 6.6.7.4. Market estimates and forecasts, 2018 - 2030 (USD Million)
- 6.6.8. Australia
- 6.6.8.1. Key country dynamics
- 6.6.8.2. Regulatory framework
- 6.6.8.3. Competitive insights
- 6.6.8.4. Market estimates and forecasts, 2018 - 2030 (USD Million)
- 6.6.9. Philippines
- 6.6.9.1. Key country dynamics
- 6.6.9.2. Regulatory framework
- 6.6.9.3. Competitive insights
- 6.6.9.4. Market estimates and forecasts, 2018 - 2030 (USD Million)
- 6.6.10. Malaysia
- 6.6.10.1. Key country dynamics
- 6.6.10.2. Regulatory framework
- 6.6.10.3. Competitive insights
- 6.6.10.4. Market estimates and forecasts, 2018 - 2030 (USD Million)
- 6.6.11. Singapore
- 6.6.11.1. Key country dynamics
- 6.6.11.2. Regulatory framework
- 6.6.11.3. Competitive insights
- 6.6.11.4. Market estimates and forecasts, 2018 - 2030 (USD Million)
- 6.7. Latin America
- 6.7.1. Latin America market estimates and forecasts, 2018 - 2030 (USD Million)
- 6.7.2. Brazil
- 6.7.2.1. Key country dynamics
- 6.7.2.2. Regulatory framework
- 6.7.2.3. Competitive insights
- 6.7.2.4. Market estimates and forecasts, 2018 - 2030 (USD Million)
- 6.7.3. Argentina
- 6.7.3.1. Key country dynamics
- 6.7.3.2. Regulatory framework
- 6.7.3.3. Competitive insights
- 6.7.3.4. Market estimates and forecasts, 2018 - 2030 (USD Million)
- 6.7.4. Colombia
- 6.7.4.1. Key country dynamics
- 6.7.4.2. Regulatory framework
- 6.7.4.3. Competitive insights
- 6.7.4.4. Market estimates and forecasts, 2018 - 2030 (USD Million)
- 6.7.5. Chile
- 6.7.5.1. Key country dynamics
- 6.7.5.2. Regulatory framework
- 6.7.5.3. Competitive insights
- 6.7.5.4. Market estimates and forecasts, 2018 - 2030 (USD Million)
- 6.7.6. Venezuela
- 6.7.6.1. Key country dynamics
- 6.7.6.2. Regulatory framework
- 6.7.6.3. Competitive insights
- 6.7.6.4. Market estimates and forecasts, 2018 - 2030 (USD Million)
- 6.8. Middle East & Africa
- 6.8.1. MEA market estimates and forecasts, 2018 - 2030 (USD Million)
- 6.8.2. South Africa
- 6.8.2.1. Key country dynamics
- 6.8.2.2. Regulatory framework
- 6.8.2.3. Competitive insights
- 6.8.2.4. Market estimates and forecasts, 2018 - 2030 (USD Million)
- 6.8.3. Saudi Arabia
- 6.8.3.1. Key country dynamics
- 6.8.3.2. Regulatory framework
- 6.8.3.3. Competitive insights
- 6.8.3.4. Market estimates and forecasts, 2018 - 2030 (USD Million)
- 6.8.4. UAE
- 6.8.4.1. Key country dynamics
- 6.8.4.2. Regulatory framework
- 6.8.4.3. Competitive insights
- 6.8.4.4. Market estimates and forecasts, 2018 - 2030 (USD Million)
- 6.8.5. Turkey
- 6.8.5.1. Key country dynamics
- 6.8.5.2. Regulatory framework
- 6.8.5.3. Competitive insights
- 6.8.5.4. Market estimates and forecasts, 2018 - 2030 (USD Million)
- 6.8.6. Iran
- 6.8.6.1. Key country dynamics
- 6.8.6.2. Regulatory framework
- 6.8.6.3. Competitive insights
- 6.8.6.4. Market estimates and forecasts, 2018 - 2030 (USD Million)
- 6.8.7. Kuwait
- 6.8.7.1. Key country dynamics
- 6.8.7.2. Regulatory framework
- 6.8.7.3. Competitive insights
- 6.8.7.4. Market estimates and forecasts, 2018 - 2030 (USD Million)
Chapter 7. Competitive Landscape
- 7.1. Recent Developments & Impact Analysis, By Key Market Participants
- 7.2. Vendor Landscape
- 7.2.1. Company categorization
- 7.2.2. List of Key Distributors and Channel Partners
- 7.2.3. List of Potential Customers/End Users
- 7.3. Competitive Dynamics
- 7.3.1. Competitive Benchmarking
- 7.3.2. Strategy Mapping
- 7.3.3. Heat Map Analysis
- 7.4. Company Profiles/Listing
- 7.4.1. ABBOTT
- 7.4.1.1. Participant's overview
- 7.4.1.2. Financial performance
- 7.4.1.3. Product benchmarking
- 7.4.1.4. Strategic initiatives
- 7.4.2. Medtronic
- 7.4.2.1. Participant's overview
- 7.4.2.2. Financial performance
- 7.4.2.3. Product benchmarking
- 7.4.2.4. Strategic initiatives
- 7.4.3. Boston Scientific Corporation
- 7.4.3.1. Participant's overview
- 7.4.3.2. Financial performance
- 7.4.3.3. Product benchmarking
- 7.4.3.4. Strategic initiatives
- 7.4.1. ABBOTT
