
|
市場調査レポート
商品コード
1414952
ボディローション市場:タイプ別、エンドユーザー別、パッケージ別、流通チャネル別:世界の機会分析と産業予測 2023-2032年Body Lotion Market By Type, By End User, By Packaging, By Distribution Channel : Global Opportunity Analysis and Industry Forecast, 2023-2032 |
||||||
|
|||||||

| ボディローション市場:タイプ別、エンドユーザー別、パッケージ別、流通チャネル別:世界の機会分析と産業予測 2023-2032年 |
|
出版日: 2023年11月30日
発行: Allied Market Research
ページ情報: 英文 300 Pages
納期: 2~3営業日
|

- 全表示
- 概要
- 図表
- 目次
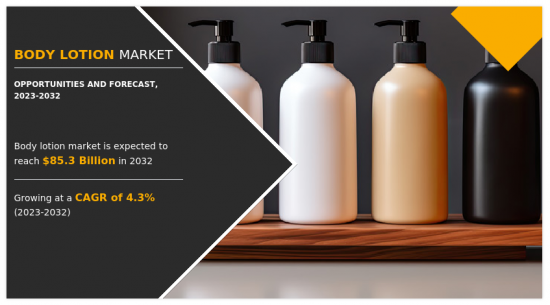
ボディローション市場は2022年に564億米ドルと評価され、2023年から2032年にかけてCAGR 4.3%で成長し、2032年には853億米ドルに達すると推定されます。
ボディローション市場は、多様な消費者ニーズに対応し、肌に潤いと栄養を与えるように設計された幅広い製品を包含しています。この市場には、天然処方、オーガニック処方、特殊処方を含む様々なブランドの製品が含まれます。同市場の成長の主な原動力は、スキンケアに対する意識の高まり、可処分所得の増加、消費者のライフスタイルの変化などです。さらに、ナチュラルな選択肢を求める健康志向の人々から、贅沢なスキンケアや治療的なスキンケアを望む人々まで、幅広い層に対応しています。
化粧品・パーソナルケア業界は、技術分野で新たな発展を遂げています。これらのテクノロジーは、ユーザーにより多くのメリットを提供する様々な成分、生産・製造プロセスの改善、さらに廃棄物の削減と持続可能性の維持に役立っています。これにより、ブランドは様々な種類の植物を使用することができ、また、空気耕栽培で開発されているため、成分がより高濃度に濃縮されています。さらに、スキンケアブランドのヴァセリンは、ユニリーバのプレオペレーション型超水分補給脂質を使用して開発された、褐色と黒色の肌色に焦点を当てたヴァセリン・ラディアントXを発表しました。
化粧品・パーソナルケア業界における新技術のイントロダクションも、市場成長の重要な要因です。特定のスキンケア要件を満たすように設計された、さまざまなパーソナルケア製品に対する需要の増加に伴い、技術開発が大きな役割を果たしています。クラリアントAGのボディローション製造用の植物搾乳技術など、ユニークな植物から成分を抽出する製造業者を支援する高度な製造方法。さらに、技術はパッケージングにも影響し、石油プラスチックに比べて分解速度の速いバイオプラスチックが使用されています。
目次
第1章 イントロダクション
第2章 エグゼクティブサマリー
第3章 市場概要
- 市場の定義と範囲
- 主な調査結果
- 影響要因
- 主な投資機会
- ポーターのファイブフォース分析
- 市場力学
- 促進要因
- ボディケアに対する意識の高まり
- 化粧品業界におけるテクノロジーの台頭
- 抑制要因
- 持続可能性に関する課題
- 政府の規制とコンプライアンスの課題
- 機会
- パーソナライズされたパーソナルケア製品
- 促進要因
第4章 ボディローション市場:タイプ別
- 概要
- 乾燥肌
- 脂性肌
- 普通肌
- 敏感肌
- その他
第5章 ボディローション市場:エンドユーザー別
- 概要
- 男性
- 女性
- 子供
第6章 ボディローション市場:包装材別
- 概要
- ボトル
- チューブ
- ポンプ
- その他
第7章 ボディローション市場:流通チャネル別
- 概要
- スーパーマーケットとハイパーマーケット
- 専門店
- オンラインチャネル
- その他
第8章 ボディローション市場:地域別
- 概要
- 北米
- 米国
- カナダ
- メキシコ
- 欧州
- ドイツ
- 英国
- フランス
- イタリア
- スペイン
- その他
- アジア太平洋
- 中国
- 韓国
- 日本
- インド
- オーストラリア
- ASEAN
- その他
- ラテンアメリカ・中東・アフリカ
- ブラジル
- アルゼンチン
- チリ
- アラブ首長国連邦
- 南アフリカ
- その他
第9章 競争情勢
- イントロダクション
- 主要成功戦略
- 主要10社の製品マッピング
- 競合ダッシュボード
- 競合ヒートマップ
- 主要企業のポジショニング、2022年
第10章 企業プロファイル
- Hindustan Unilever Limited
- Galderma S.A.
- The Estee Lauder Companies Inc.
- The Procter & Gamble Company
- Beiersdorf AG
- Groupe Clarins
- Avon Products, Inc
- Revlon, Inc.
- Johnson & Johnson Services, Inc.
- Coty Inc.
LIST OF TABLES
- TABLE 01. GLOBAL BODY LOTION MARKET, BY TYPE, 2022-2032 ($MILLION)
- TABLE 02. BODY LOTION MARKET FOR DRY SKIN, BY REGION, 2022-2032 ($MILLION)
- TABLE 03. BODY LOTION MARKET FOR OILY SKIN, BY REGION, 2022-2032 ($MILLION)
- TABLE 04. BODY LOTION MARKET FOR NORMAL SKIN, BY REGION, 2022-2032 ($MILLION)
- TABLE 05. BODY LOTION MARKET FOR SENSITIVE SKIN, BY REGION, 2022-2032 ($MILLION)
- TABLE 06. BODY LOTION MARKET FOR OTHERS, BY REGION, 2022-2032 ($MILLION)
- TABLE 07. GLOBAL BODY LOTION MARKET, BY END USER, 2022-2032 ($MILLION)
- TABLE 08. BODY LOTION MARKET FOR MALE, BY REGION, 2022-2032 ($MILLION)
- TABLE 09. BODY LOTION MARKET FOR FEMALE, BY REGION, 2022-2032 ($MILLION)
- TABLE 10. BODY LOTION MARKET FOR KIDS, BY REGION, 2022-2032 ($MILLION)
- TABLE 11. GLOBAL BODY LOTION MARKET, BY PACKAGING, 2022-2032 ($MILLION)
- TABLE 12. BODY LOTION MARKET FOR BOTTLES, BY REGION, 2022-2032 ($MILLION)
- TABLE 13. BODY LOTION MARKET FOR TUBES, BY REGION, 2022-2032 ($MILLION)
- TABLE 14. BODY LOTION MARKET FOR PUMPS, BY REGION, 2022-2032 ($MILLION)
- TABLE 15. BODY LOTION MARKET FOR OTHERS, BY REGION, 2022-2032 ($MILLION)
- TABLE 16. GLOBAL BODY LOTION MARKET, BY DISTRIBUTION CHANNEL, 2022-2032 ($MILLION)
- TABLE 17. BODY LOTION MARKET FOR SUPERMARKET AND HYPERMARKET, BY REGION, 2022-2032 ($MILLION)
- TABLE 18. BODY LOTION MARKET FOR SPECIALTY STORE, BY REGION, 2022-2032 ($MILLION)
- TABLE 19. BODY LOTION MARKET FOR ONLINE CHANNEL, BY REGION, 2022-2032 ($MILLION)
- TABLE 20. BODY LOTION MARKET FOR OTHERS, BY REGION, 2022-2032 ($MILLION)
- TABLE 21. BODY LOTION MARKET, BY REGION, 2022-2032 ($MILLION)
- TABLE 22. NORTH AMERICA BODY LOTION MARKET, BY TYPE, 2022-2032 ($MILLION)
- TABLE 23. NORTH AMERICA BODY LOTION MARKET, BY END USER, 2022-2032 ($MILLION)
- TABLE 24. NORTH AMERICA BODY LOTION MARKET, BY PACKAGING, 2022-2032 ($MILLION)
- TABLE 25. NORTH AMERICA BODY LOTION MARKET, BY DISTRIBUTION CHANNEL, 2022-2032 ($MILLION)
- TABLE 26. NORTH AMERICA BODY LOTION MARKET, BY COUNTRY, 2022-2032 ($MILLION)
- TABLE 27. U.S. BODY LOTION MARKET, BY TYPE, 2022-2032 ($MILLION)
- TABLE 28. U.S. BODY LOTION MARKET, BY END USER, 2022-2032 ($MILLION)
- TABLE 29. U.S. BODY LOTION MARKET, BY PACKAGING, 2022-2032 ($MILLION)
- TABLE 30. U.S. BODY LOTION MARKET, BY DISTRIBUTION CHANNEL, 2022-2032 ($MILLION)
- TABLE 31. CANADA BODY LOTION MARKET, BY TYPE, 2022-2032 ($MILLION)
- TABLE 32. CANADA BODY LOTION MARKET, BY END USER, 2022-2032 ($MILLION)
- TABLE 33. CANADA BODY LOTION MARKET, BY PACKAGING, 2022-2032 ($MILLION)
- TABLE 34. CANADA BODY LOTION MARKET, BY DISTRIBUTION CHANNEL, 2022-2032 ($MILLION)
- TABLE 35. MEXICO BODY LOTION MARKET, BY TYPE, 2022-2032 ($MILLION)
- TABLE 36. MEXICO BODY LOTION MARKET, BY END USER, 2022-2032 ($MILLION)
- TABLE 37. MEXICO BODY LOTION MARKET, BY PACKAGING, 2022-2032 ($MILLION)
- TABLE 38. MEXICO BODY LOTION MARKET, BY DISTRIBUTION CHANNEL, 2022-2032 ($MILLION)
- TABLE 39. EUROPE BODY LOTION MARKET, BY TYPE, 2022-2032 ($MILLION)
- TABLE 40. EUROPE BODY LOTION MARKET, BY END USER, 2022-2032 ($MILLION)
- TABLE 41. EUROPE BODY LOTION MARKET, BY PACKAGING, 2022-2032 ($MILLION)
- TABLE 42. EUROPE BODY LOTION MARKET, BY DISTRIBUTION CHANNEL, 2022-2032 ($MILLION)
- TABLE 43. EUROPE BODY LOTION MARKET, BY COUNTRY, 2022-2032 ($MILLION)
- TABLE 44. GERMANY BODY LOTION MARKET, BY TYPE, 2022-2032 ($MILLION)
- TABLE 45. GERMANY BODY LOTION MARKET, BY END USER, 2022-2032 ($MILLION)
- TABLE 46. GERMANY BODY LOTION MARKET, BY PACKAGING, 2022-2032 ($MILLION)
- TABLE 47. GERMANY BODY LOTION MARKET, BY DISTRIBUTION CHANNEL, 2022-2032 ($MILLION)
- TABLE 48. UK BODY LOTION MARKET, BY TYPE, 2022-2032 ($MILLION)
- TABLE 49. UK BODY LOTION MARKET, BY END USER, 2022-2032 ($MILLION)
- TABLE 50. UK BODY LOTION MARKET, BY PACKAGING, 2022-2032 ($MILLION)
- TABLE 51. UK BODY LOTION MARKET, BY DISTRIBUTION CHANNEL, 2022-2032 ($MILLION)
- TABLE 52. FRANCE BODY LOTION MARKET, BY TYPE, 2022-2032 ($MILLION)
- TABLE 53. FRANCE BODY LOTION MARKET, BY END USER, 2022-2032 ($MILLION)
- TABLE 54. FRANCE BODY LOTION MARKET, BY PACKAGING, 2022-2032 ($MILLION)
- TABLE 55. FRANCE BODY LOTION MARKET, BY DISTRIBUTION CHANNEL, 2022-2032 ($MILLION)
- TABLE 56. ITALY BODY LOTION MARKET, BY TYPE, 2022-2032 ($MILLION)
- TABLE 57. ITALY BODY LOTION MARKET, BY END USER, 2022-2032 ($MILLION)
- TABLE 58. ITALY BODY LOTION MARKET, BY PACKAGING, 2022-2032 ($MILLION)
- TABLE 59. ITALY BODY LOTION MARKET, BY DISTRIBUTION CHANNEL, 2022-2032 ($MILLION)
- TABLE 60. SPAIN BODY LOTION MARKET, BY TYPE, 2022-2032 ($MILLION)
- TABLE 61. SPAIN BODY LOTION MARKET, BY END USER, 2022-2032 ($MILLION)
- TABLE 62. SPAIN BODY LOTION MARKET, BY PACKAGING, 2022-2032 ($MILLION)
- TABLE 63. SPAIN BODY LOTION MARKET, BY DISTRIBUTION CHANNEL, 2022-2032 ($MILLION)
- TABLE 64. REST OF EUROPE BODY LOTION MARKET, BY TYPE, 2022-2032 ($MILLION)
- TABLE 65. REST OF EUROPE BODY LOTION MARKET, BY END USER, 2022-2032 ($MILLION)
- TABLE 66. REST OF EUROPE BODY LOTION MARKET, BY PACKAGING, 2022-2032 ($MILLION)
- TABLE 67. REST OF EUROPE BODY LOTION MARKET, BY DISTRIBUTION CHANNEL, 2022-2032 ($MILLION)
- TABLE 68. ASIA-PACIFIC BODY LOTION MARKET, BY TYPE, 2022-2032 ($MILLION)
- TABLE 69. ASIA-PACIFIC BODY LOTION MARKET, BY END USER, 2022-2032 ($MILLION)
- TABLE 70. ASIA-PACIFIC BODY LOTION MARKET, BY PACKAGING, 2022-2032 ($MILLION)
- TABLE 71. ASIA-PACIFIC BODY LOTION MARKET, BY DISTRIBUTION CHANNEL, 2022-2032 ($MILLION)
- TABLE 72. ASIA-PACIFIC BODY LOTION MARKET, BY COUNTRY, 2022-2032 ($MILLION)
- TABLE 73. CHINA BODY LOTION MARKET, BY TYPE, 2022-2032 ($MILLION)
- TABLE 74. CHINA BODY LOTION MARKET, BY END USER, 2022-2032 ($MILLION)
- TABLE 75. CHINA BODY LOTION MARKET, BY PACKAGING, 2022-2032 ($MILLION)
- TABLE 76. CHINA BODY LOTION MARKET, BY DISTRIBUTION CHANNEL, 2022-2032 ($MILLION)
- TABLE 77. SOUTH KOREA BODY LOTION MARKET, BY TYPE, 2022-2032 ($MILLION)
- TABLE 78. SOUTH KOREA BODY LOTION MARKET, BY END USER, 2022-2032 ($MILLION)
- TABLE 79. SOUTH KOREA BODY LOTION MARKET, BY PACKAGING, 2022-2032 ($MILLION)
- TABLE 80. SOUTH KOREA BODY LOTION MARKET, BY DISTRIBUTION CHANNEL, 2022-2032 ($MILLION)
- TABLE 81. JAPAN BODY LOTION MARKET, BY TYPE, 2022-2032 ($MILLION)
- TABLE 82. JAPAN BODY LOTION MARKET, BY END USER, 2022-2032 ($MILLION)
- TABLE 83. JAPAN BODY LOTION MARKET, BY PACKAGING, 2022-2032 ($MILLION)
- TABLE 84. JAPAN BODY LOTION MARKET, BY DISTRIBUTION CHANNEL, 2022-2032 ($MILLION)
- TABLE 85. INDIA BODY LOTION MARKET, BY TYPE, 2022-2032 ($MILLION)
- TABLE 86. INDIA BODY LOTION MARKET, BY END USER, 2022-2032 ($MILLION)
- TABLE 87. INDIA BODY LOTION MARKET, BY PACKAGING, 2022-2032 ($MILLION)
- TABLE 88. INDIA BODY LOTION MARKET, BY DISTRIBUTION CHANNEL, 2022-2032 ($MILLION)
- TABLE 89. AUSTRALIA BODY LOTION MARKET, BY TYPE, 2022-2032 ($MILLION)
- TABLE 90. AUSTRALIA BODY LOTION MARKET, BY END USER, 2022-2032 ($MILLION)
- TABLE 91. AUSTRALIA BODY LOTION MARKET, BY PACKAGING, 2022-2032 ($MILLION)
- TABLE 92. AUSTRALIA BODY LOTION MARKET, BY DISTRIBUTION CHANNEL, 2022-2032 ($MILLION)
- TABLE 93. ASEAN BODY LOTION MARKET, BY TYPE, 2022-2032 ($MILLION)
- TABLE 94. ASEAN BODY LOTION MARKET, BY END USER, 2022-2032 ($MILLION)
- TABLE 95. ASEAN BODY LOTION MARKET, BY PACKAGING, 2022-2032 ($MILLION)
- TABLE 96. ASEAN BODY LOTION MARKET, BY DISTRIBUTION CHANNEL, 2022-2032 ($MILLION)
- TABLE 97. REST OF ASIA-PACIFIC BODY LOTION MARKET, BY TYPE, 2022-2032 ($MILLION)
- TABLE 98. REST OF ASIA-PACIFIC BODY LOTION MARKET, BY END USER, 2022-2032 ($MILLION)
- TABLE 99. REST OF ASIA-PACIFIC BODY LOTION MARKET, BY PACKAGING, 2022-2032 ($MILLION)
- TABLE 100. REST OF ASIA-PACIFIC BODY LOTION MARKET, BY DISTRIBUTION CHANNEL, 2022-2032 ($MILLION)
- TABLE 101. LAMEA BODY LOTION MARKET, BY TYPE, 2022-2032 ($MILLION)
- TABLE 102. LAMEA BODY LOTION MARKET, BY END USER, 2022-2032 ($MILLION)
- TABLE 103. LAMEA BODY LOTION MARKET, BY PACKAGING, 2022-2032 ($MILLION)
- TABLE 104. LAMEA BODY LOTION MARKET, BY DISTRIBUTION CHANNEL, 2022-2032 ($MILLION)
- TABLE 105. LAMEA BODY LOTION MARKET, BY COUNTRY, 2022-2032 ($MILLION)
- TABLE 106. BRAZIL BODY LOTION MARKET, BY TYPE, 2022-2032 ($MILLION)
- TABLE 107. BRAZIL BODY LOTION MARKET, BY END USER, 2022-2032 ($MILLION)
- TABLE 108. BRAZIL BODY LOTION MARKET, BY PACKAGING, 2022-2032 ($MILLION)
- TABLE 109. BRAZIL BODY LOTION MARKET, BY DISTRIBUTION CHANNEL, 2022-2032 ($MILLION)
- TABLE 110. ARGENTINA BODY LOTION MARKET, BY TYPE, 2022-2032 ($MILLION)
- TABLE 111. ARGENTINA BODY LOTION MARKET, BY END USER, 2022-2032 ($MILLION)
- TABLE 112. ARGENTINA BODY LOTION MARKET, BY PACKAGING, 2022-2032 ($MILLION)
- TABLE 113. ARGENTINA BODY LOTION MARKET, BY DISTRIBUTION CHANNEL, 2022-2032 ($MILLION)
- TABLE 114. CHILE BODY LOTION MARKET, BY TYPE, 2022-2032 ($MILLION)
- TABLE 115. CHILE BODY LOTION MARKET, BY END USER, 2022-2032 ($MILLION)
- TABLE 116. CHILE BODY LOTION MARKET, BY PACKAGING, 2022-2032 ($MILLION)
- TABLE 117. CHILE BODY LOTION MARKET, BY DISTRIBUTION CHANNEL, 2022-2032 ($MILLION)
- TABLE 118. UNITED ARAB EMIRATES BODY LOTION MARKET, BY TYPE, 2022-2032 ($MILLION)
- TABLE 119. UNITED ARAB EMIRATES BODY LOTION MARKET, BY END USER, 2022-2032 ($MILLION)
- TABLE 120. UNITED ARAB EMIRATES BODY LOTION MARKET, BY PACKAGING, 2022-2032 ($MILLION)
- TABLE 121. UNITED ARAB EMIRATES BODY LOTION MARKET, BY DISTRIBUTION CHANNEL, 2022-2032 ($MILLION)
- TABLE 122. SOUTH AFRICA BODY LOTION MARKET, BY TYPE, 2022-2032 ($MILLION)
- TABLE 123. SOUTH AFRICA BODY LOTION MARKET, BY END USER, 2022-2032 ($MILLION)
- TABLE 124. SOUTH AFRICA BODY LOTION MARKET, BY PACKAGING, 2022-2032 ($MILLION)
- TABLE 125. SOUTH AFRICA BODY LOTION MARKET, BY DISTRIBUTION CHANNEL, 2022-2032 ($MILLION)
- TABLE 126. REST OF LAMEA BODY LOTION MARKET, BY TYPE, 2022-2032 ($MILLION)
- TABLE 127. REST OF LAMEA BODY LOTION MARKET, BY END USER, 2022-2032 ($MILLION)
- TABLE 128. REST OF LAMEA BODY LOTION MARKET, BY PACKAGING, 2022-2032 ($MILLION)
- TABLE 129. REST OF LAMEA BODY LOTION MARKET, BY DISTRIBUTION CHANNEL, 2022-2032 ($MILLION)
- TABLE 130. HINDUSTAN UNILEVER LIMITED: KEY EXECUTIVES
- TABLE 131. HINDUSTAN UNILEVER LIMITED: COMPANY SNAPSHOT
- TABLE 132. HINDUSTAN UNILEVER LIMITED: PRODUCT SEGMENTS
- TABLE 133. HINDUSTAN UNILEVER LIMITED: PRODUCT PORTFOLIO
- TABLE 134. GALDERMA S.A.: KEY EXECUTIVES
- TABLE 135. GALDERMA S.A.: COMPANY SNAPSHOT
- TABLE 136. GALDERMA S.A.: PRODUCT SEGMENTS
- TABLE 137. GALDERMA S.A.: PRODUCT PORTFOLIO
- TABLE 138. GALDERMA S.A.: KEY STRATERGIES
- TABLE 139. THE ESTEE LAUDER COMPANIES INC.: KEY EXECUTIVES
- TABLE 140. THE ESTEE LAUDER COMPANIES INC.: COMPANY SNAPSHOT
- TABLE 141. THE ESTEE LAUDER COMPANIES INC.: PRODUCT SEGMENTS
- TABLE 142. THE ESTEE LAUDER COMPANIES INC.: PRODUCT PORTFOLIO
- TABLE 143. THE ESTEE LAUDER COMPANIES INC.: KEY STRATERGIES
- TABLE 144. THE PROCTER & GAMBLE COMPANY: KEY EXECUTIVES
- TABLE 145. THE PROCTER & GAMBLE COMPANY: COMPANY SNAPSHOT
- TABLE 146. THE PROCTER & GAMBLE COMPANY: PRODUCT SEGMENTS
- TABLE 147. THE PROCTER & GAMBLE COMPANY: PRODUCT PORTFOLIO
- TABLE 148. THE PROCTER & GAMBLE COMPANY: KEY STRATERGIES
- TABLE 149. BEIERSDORF AG: KEY EXECUTIVES
- TABLE 150. BEIERSDORF AG: COMPANY SNAPSHOT
- TABLE 151. BEIERSDORF AG: PRODUCT SEGMENTS
- TABLE 152. BEIERSDORF AG: PRODUCT PORTFOLIO
- TABLE 153. BEIERSDORF AG: KEY STRATERGIES
- TABLE 154. GROUPE CLARINS: KEY EXECUTIVES
- TABLE 155. GROUPE CLARINS: COMPANY SNAPSHOT
- TABLE 156. GROUPE CLARINS: PRODUCT SEGMENTS
- TABLE 157. GROUPE CLARINS: PRODUCT PORTFOLIO
- TABLE 158. GROUPE CLARINS: KEY STRATERGIES
- TABLE 159. AVON PRODUCTS, INC: KEY EXECUTIVES
- TABLE 160. AVON PRODUCTS, INC: COMPANY SNAPSHOT
- TABLE 161. AVON PRODUCTS, INC: PRODUCT SEGMENTS
- TABLE 162. AVON PRODUCTS, INC: PRODUCT PORTFOLIO
- TABLE 163. AVON PRODUCTS, INC: KEY STRATERGIES
- TABLE 164. REVLON, INC.: KEY EXECUTIVES
- TABLE 165. REVLON, INC.: COMPANY SNAPSHOT
- TABLE 166. REVLON, INC.: PRODUCT SEGMENTS
- TABLE 167. REVLON, INC.: PRODUCT PORTFOLIO
- TABLE 168. JOHNSON & JOHNSON SERVICES, INC.: KEY EXECUTIVES
- TABLE 169. JOHNSON & JOHNSON SERVICES, INC.: COMPANY SNAPSHOT
- TABLE 170. JOHNSON & JOHNSON SERVICES, INC.: PRODUCT SEGMENTS
- TABLE 171. JOHNSON & JOHNSON SERVICES, INC.: PRODUCT PORTFOLIO
- TABLE 172. COTY INC.: KEY EXECUTIVES
- TABLE 173. COTY INC.: COMPANY SNAPSHOT
- TABLE 174. COTY INC.: PRODUCT SEGMENTS
- TABLE 175. COTY INC.: PRODUCT PORTFOLIO
- TABLE 176. COTY INC.: KEY STRATERGIES
LIST OF FIGURES
- FIGURE 01. BODY LOTION MARKET, 2022-2032
- FIGURE 02. SEGMENTATION OF BODY LOTION MARKET,2022-2032
- FIGURE 03. TOP IMPACTING FACTORS IN BODY LOTION MARKET (2022 TO 2032)
- FIGURE 04. TOP INVESTMENT POCKETS IN BODY LOTION MARKET (2023-2032)
- FIGURE 05. MODERATE BARGAINING POWER OF SUPPLIERS
- FIGURE 06. MODERATE THREAT OF NEW ENTRANTS
- FIGURE 07. MODERATE THREAT OF SUBSTITUTES
- FIGURE 08. MODERATE INTENSITY OF RIVALRY
- FIGURE 09. MODERATE BARGAINING POWER OF BUYERS
- FIGURE 10. GLOBAL BODY LOTION MARKET:DRIVERS, RESTRAINTS AND OPPORTUNITIES
- FIGURE 11. BODY LOTION MARKET, BY TYPE, 2022 AND 2032(%)
- FIGURE 12. COMPARATIVE SHARE ANALYSIS OF BODY LOTION MARKET FOR DRY SKIN, BY COUNTRY 2022 AND 2032(%)
- FIGURE 13. COMPARATIVE SHARE ANALYSIS OF BODY LOTION MARKET FOR OILY SKIN, BY COUNTRY 2022 AND 2032(%)
- FIGURE 14. COMPARATIVE SHARE ANALYSIS OF BODY LOTION MARKET FOR NORMAL SKIN, BY COUNTRY 2022 AND 2032(%)
- FIGURE 15. COMPARATIVE SHARE ANALYSIS OF BODY LOTION MARKET FOR SENSITIVE SKIN, BY COUNTRY 2022 AND 2032(%)
- FIGURE 16. COMPARATIVE SHARE ANALYSIS OF BODY LOTION MARKET FOR OTHERS, BY COUNTRY 2022 AND 2032(%)
- FIGURE 17. BODY LOTION MARKET, BY END USER, 2022 AND 2032(%)
- FIGURE 18. COMPARATIVE SHARE ANALYSIS OF BODY LOTION MARKET FOR MALE, BY COUNTRY 2022 AND 2032(%)
- FIGURE 19. COMPARATIVE SHARE ANALYSIS OF BODY LOTION MARKET FOR FEMALE, BY COUNTRY 2022 AND 2032(%)
- FIGURE 20. COMPARATIVE SHARE ANALYSIS OF BODY LOTION MARKET FOR KIDS, BY COUNTRY 2022 AND 2032(%)
- FIGURE 21. BODY LOTION MARKET, BY PACKAGING, 2022 AND 2032(%)
- FIGURE 22. COMPARATIVE SHARE ANALYSIS OF BODY LOTION MARKET FOR BOTTLES, BY COUNTRY 2022 AND 2032(%)
- FIGURE 23. COMPARATIVE SHARE ANALYSIS OF BODY LOTION MARKET FOR TUBES, BY COUNTRY 2022 AND 2032(%)
- FIGURE 24. COMPARATIVE SHARE ANALYSIS OF BODY LOTION MARKET FOR PUMPS, BY COUNTRY 2022 AND 2032(%)
- FIGURE 25. COMPARATIVE SHARE ANALYSIS OF BODY LOTION MARKET FOR OTHERS, BY COUNTRY 2022 AND 2032(%)
- FIGURE 26. BODY LOTION MARKET, BY DISTRIBUTION CHANNEL, 2022 AND 2032(%)
- FIGURE 27. COMPARATIVE SHARE ANALYSIS OF BODY LOTION MARKET FOR SUPERMARKET AND HYPERMARKET, BY COUNTRY 2022 AND 2032(%)
- FIGURE 28. COMPARATIVE SHARE ANALYSIS OF BODY LOTION MARKET FOR SPECIALTY STORE, BY COUNTRY 2022 AND 2032(%)
- FIGURE 29. COMPARATIVE SHARE ANALYSIS OF BODY LOTION MARKET FOR ONLINE CHANNEL, BY COUNTRY 2022 AND 2032(%)
- FIGURE 30. COMPARATIVE SHARE ANALYSIS OF BODY LOTION MARKET FOR OTHERS, BY COUNTRY 2022 AND 2032(%)
- FIGURE 31. BODY LOTION MARKET BY REGION, 2022 AND 2032(%)
- FIGURE 32. U.S. BODY LOTION MARKET, 2022-2032 ($MILLION)
- FIGURE 33. CANADA BODY LOTION MARKET, 2022-2032 ($MILLION)
- FIGURE 34. MEXICO BODY LOTION MARKET, 2022-2032 ($MILLION)
- FIGURE 35. GERMANY BODY LOTION MARKET, 2022-2032 ($MILLION)
- FIGURE 36. UK BODY LOTION MARKET, 2022-2032 ($MILLION)
- FIGURE 37. FRANCE BODY LOTION MARKET, 2022-2032 ($MILLION)
- FIGURE 38. ITALY BODY LOTION MARKET, 2022-2032 ($MILLION)
- FIGURE 39. SPAIN BODY LOTION MARKET, 2022-2032 ($MILLION)
- FIGURE 40. REST OF EUROPE BODY LOTION MARKET, 2022-2032 ($MILLION)
- FIGURE 41. CHINA BODY LOTION MARKET, 2022-2032 ($MILLION)
- FIGURE 42. SOUTH KOREA BODY LOTION MARKET, 2022-2032 ($MILLION)
- FIGURE 43. JAPAN BODY LOTION MARKET, 2022-2032 ($MILLION)
- FIGURE 44. INDIA BODY LOTION MARKET, 2022-2032 ($MILLION)
- FIGURE 45. AUSTRALIA BODY LOTION MARKET, 2022-2032 ($MILLION)
- FIGURE 46. ASEAN BODY LOTION MARKET, 2022-2032 ($MILLION)
- FIGURE 47. REST OF ASIA-PACIFIC BODY LOTION MARKET, 2022-2032 ($MILLION)
- FIGURE 48. BRAZIL BODY LOTION MARKET, 2022-2032 ($MILLION)
- FIGURE 49. ARGENTINA BODY LOTION MARKET, 2022-2032 ($MILLION)
- FIGURE 50. CHILE BODY LOTION MARKET, 2022-2032 ($MILLION)
- FIGURE 51. UNITED ARAB EMIRATES BODY LOTION MARKET, 2022-2032 ($MILLION)
- FIGURE 52. SOUTH AFRICA BODY LOTION MARKET, 2022-2032 ($MILLION)
- FIGURE 53. REST OF LAMEA BODY LOTION MARKET, 2022-2032 ($MILLION)
- FIGURE 54. TOP WINNING STRATEGIES, BY YEAR (2020-2023)
- FIGURE 55. TOP WINNING STRATEGIES, BY DEVELOPMENT (2020-2023)
- FIGURE 56. TOP WINNING STRATEGIES, BY COMPANY (2020-2023)
- FIGURE 57. PRODUCT MAPPING OF TOP 10 PLAYERS
- FIGURE 58. COMPETITIVE DASHBOARD
- FIGURE 59. COMPETITIVE HEATMAP: BODY LOTION MARKET
- FIGURE 60. TOP PLAYER POSITIONING, 2022
- FIGURE 61. HINDUSTAN UNILEVER LIMITED: NET SALES, 2020-2022 ($MILLION)
- FIGURE 62. HINDUSTAN UNILEVER LIMITED: REVENUE SHARE BY SEGMENT, 2022 (%)
- FIGURE 63. HINDUSTAN UNILEVER LIMITED: REVENUE SHARE BY REGION, 2022 (%)
- FIGURE 64. THE ESTEE LAUDER COMPANIES INC.: NET SALES, 2020-2022 ($MILLION)
- FIGURE 65. THE ESTEE LAUDER COMPANIES INC.: RESEARCH & DEVELOPMENT EXPENDITURE, 2020-2022 ($MILLION)
- FIGURE 66. THE ESTEE LAUDER COMPANIES INC.: REVENUE SHARE BY SEGMENT, 2022 (%)
- FIGURE 67. THE ESTEE LAUDER COMPANIES INC.: REVENUE SHARE BY REGION, 2022 (%)
- FIGURE 68. THE PROCTER & GAMBLE COMPANY: NET REVENUE, 2020-2022 ($MILLION)
- FIGURE 69. THE PROCTER & GAMBLE COMPANY: RESEARCH & DEVELOPMENT EXPENDITURE, 2020-2022 ($MILLION)
- FIGURE 70. THE PROCTER & GAMBLE COMPANY: REVENUE SHARE BY SEGMENT, 2022 (%)
- FIGURE 71. BEIERSDORF AG: NET SALES, 2020-2022 ($MILLION)
- FIGURE 72. BEIERSDORF AG: RESEARCH & DEVELOPMENT EXPENDITURE, 2020-2022 ($MILLION)
- FIGURE 73. BEIERSDORF AG: REVENUE SHARE BY SEGMENT, 2022 (%)
- FIGURE 74. BEIERSDORF AG: REVENUE SHARE BY REGION, 2022 (%)
- FIGURE 75. REVLON, INC.: NET SALES, 2020-2022 ($MILLION)
- FIGURE 76. REVLON, INC.: RESEARCH & DEVELOPMENT EXPENDITURE, 2020-2022 ($MILLION)
- FIGURE 77. REVLON, INC.: REVENUE SHARE BY SEGMENT, 2022 (%)
- FIGURE 78. REVLON, INC.: REVENUE SHARE BY REGION, 2022 (%)
- FIGURE 79. JOHNSON & JOHNSON SERVICES, INC.: NET REVENUE, 2020-2022 ($MILLION)
- FIGURE 80. JOHNSON & JOHNSON SERVICES, INC.: RESEARCH & DEVELOPMENT EXPENDITURE, 2020-2022 ($MILLION)
- FIGURE 81. JOHNSON & JOHNSON SERVICES, INC.: REVENUE SHARE BY SEGMENT, 2022 (%)
- FIGURE 82. JOHNSON & JOHNSON SERVICES, INC.: REVENUE SHARE BY REGION, 2022 (%)
- FIGURE 83. COTY INC.: NET REVENUE, 2020-2022 ($MILLION)
- FIGURE 84. COTY INC.: RESEARCH & DEVELOPMENT EXPENDITURE, 2020-2022 ($MILLION)
- FIGURE 85. COTY INC.: REVENUE SHARE BY SEGMENT, 2022 (%)
According to a new report published by Allied Market Research, titled, "Body Lotion Market," The body lotion market was valued at $56.4 billion in 2022, and is estimated to reach $85.3 billion by 2032, growing at a CAGR of 4.3% from 2023 to 2032.
The body lotion market encompasses a wide range of products designed to moisturize & nourish the skin, catering to diverse consumer needs. This market includes offerings from various brands, including natural, organic, and specialty formulations. Key drivers of its growth include increase in awareness of skincare, rise in disposable incomes, and change in consumer lifestyles. Moreover, it caters to a broad demographic, from health-conscious individuals seeking natural options to those desiring luxurious or therapeutic skincare experiences.
The cosmetics and personal care industry is experiencing a new range of developments in the technology field. These technologies help in bringing variety of ingredients that offer more benefits to the users, improvements in production & manufacturing processes, and further help reduce waste & maintain sustainability. This allows brands to use variety of plant species, and due to being developed in aeroponic culture, the ingredients are more highly concentrated. Moreover, skincare brand Vaseline, has introduced Vaseline Radiant X, focused on brown and black skin tone, developed using Unilever's preoperatory ultra-hydrating lipids.
Introduction of new technologies in the cosmetics and personal care industry is another key factor for market growth. With rise in demand for different personal care products which are designed to meet specific skincare requirements, technological development is playing a major role. Advanced production methods which assist manufacturers in extracting ingredients from unique plants, including plant milking technology from Clariant AG for manufacturing body lotion. Furthermore, technology affects the packaging, under which companies use bioplastics, which has a fast decomposition rate compared to petroleum plastic.
The body lotion market is segmented into skin type, end user, packaging distribution channel, and region. By skin type, the market is divided into dry skin, oily skin, normal skin, sensitive skin, and others. Depending on end user, it is categorized into male, female, and kids. By packaging, it is segmented into bottle, tube, pump, and others. As per distribution channel, it is segmented into supermarket & hypermarket, specialty store, online retail, and others. Region wise, the market is analyzed across North America (the U.S., Canada, and Mexico), Europe (Germany, UK, France, Italy, Spain, Russia, and rest of Europe), Asia-Pacific (China, India, Japan, South Korea, Australia, and rest of Asia-Pacific), and LAMEA (Brazil, Argentina, Chile, South Africa, and rest of LAMEA).
The players in the body lotion market have adopted acquisition, business expansion, partnership, collaboration, and product launch as their key development strategies to increase profitability and improve their position in the market. Some of the key players profiled in the market analysis include The Procter & Gamble Company, Groupe Clarins, Hindustan Unilever Limited, The Estee Lauder Companies Inc., Galderma S.A., Beiersdorf AG, Revlon, Inc., Avon Products, Inc, Coty Inc., and Johnson & Johnson Services, Inc.
Key Benefits For Stakeholders
- This report provides a quantitative analysis of the market segments, current trends, estimations, and dynamics of the body lotion market analysis from 2022 to 2032 to identify the prevailing body lotion market opportunities.
- The market research is offered along with information related to key drivers, restraints, and opportunities.
- Porter's five forces analysis highlights the potency of buyers and suppliers to enable stakeholders make profit-oriented business decisions and strengthen their supplier-buyer network.
- In-depth analysis of the body lotion market segmentation assists to determine the prevailing market opportunities.
- Major countries in each region are mapped according to their revenue contribution to the global market.
- Market player positioning facilitates benchmarking and provides a clear understanding of the present position of the market players.
- The report includes the analysis of the regional as well as global body lotion market trends, key players, market segments, application areas, and market growth strategies.
Additional benefits you will get with this purchase are:
- Quarterly Update and* (only available with a corporate license, on listed price)
- 5 additional Company Profile of client Choice pre- or Post-purchase, as a free update.
- Free Upcoming Version on the Purchase of Five and Enterprise User License.
- 16 analyst hours of support* (post-purchase, if you find additional data requirements upon review of the report, you may receive support amounting to 16 analyst hours to solve questions, and post-sale queries)
- 15% Free Customization* (in case the scope or segment of the report does not match your requirements, 15% is equivalent to 3 working days of free work, applicable once)
- Free data Pack on the Five and Enterprise User License. (Excel version of the report)
- Free Updated report if the report is 6-12 months old or older.
- 24-hour priority response*
- Free Industry updates and white papers.
Possible Customization with this report (with additional cost and timeline, please talk to the sales executive to know more)
- Additional company profiles with specific to client's interest
- Additional country or region analysis- market size and forecast
- Historic market data
Key Market Segments
By Type
- Dry Skin
- Oily Skin
- Normal Skin
- Sensitive Skin
- Others
By End User
- Male
- Female
- Kids
By Packaging
- Bottles
- Tubes
- Pumps
- Others
By Distribution Channel
- Supermarket and Hypermarket
- Specialty Store
- Online Channel
- Others
By Region
- North America
- U.S.
- Canada
- Mexico
- Europe
- Germany
- UK
- France
- Italy
- Spain
- Rest of Europe
- Asia-Pacific
- China
- South Korea
- Japan
- India
- Australia
- Asean
- Rest of Asia-Pacific
- LAMEA
- Brazil
- Argentina
- Chile
- United Arab Emirates
- South Africa
- Rest of LAMEA
Key Market Players:
- The Procter & Gamble Company
- Groupe Clarins
- The Estee Lauder Companies Inc.
- Galderma S.A.
- Beiersdorf AG
- Revlon, Inc.
- Coty Inc.
- Johnson & Johnson Services, Inc.
- Hindustan Unilever Limited
- Avon Products, Inc
TABLE OF CONTENTS
CHAPTER 1: INTRODUCTION
- 1.1. Report description
- 1.2. Key market segments
- 1.3. Key benefits to the stakeholders
- 1.4. Research methodology
- 1.4.1. Primary research
- 1.4.2. Secondary research
- 1.4.3. Analyst tools and models
CHAPTER 2: EXECUTIVE SUMMARY
- 2.1. CXO Perspective
CHAPTER 3: MARKET OVERVIEW
- 3.1. Market definition and scope
- 3.2. Key findings
- 3.2.1. Top impacting factors
- 3.2.2. Top investment pockets
- 3.3. Porter's five forces analysis
- 3.3.1. Moderate bargaining power of suppliers
- 3.3.2. Moderate threat of new entrants
- 3.3.3. Moderate threat of substitutes
- 3.3.4. Moderate intensity of rivalry
- 3.3.5. Moderate bargaining power of buyers
- 3.4. Market dynamics
- 3.4.1. Drivers
- 3.4.1.1. Increase in awareness toward body care
- 3.4.1.2. Rise in technology in cosmetic industry
- 3.4.2. Restraints
- 3.4.2.1. Sustainability challenges
- 3.4.2.2. Government regulation and compliance challenges
- 3.4.3. Opportunities
- 3.4.3.1. Personalized personal care products
- 3.4.1. Drivers
CHAPTER 4: BODY LOTION MARKET, BY TYPE
- 4.1. Overview
- 4.1.1. Market size and forecast
- 4.2. Dry Skin
- 4.2.1. Key market trends, growth factors and opportunities
- 4.2.2. Market size and forecast, by region
- 4.2.3. Market share analysis by country
- 4.3. Oily Skin
- 4.3.1. Key market trends, growth factors and opportunities
- 4.3.2. Market size and forecast, by region
- 4.3.3. Market share analysis by country
- 4.4. Normal Skin
- 4.4.1. Key market trends, growth factors and opportunities
- 4.4.2. Market size and forecast, by region
- 4.4.3. Market share analysis by country
- 4.5. Sensitive Skin
- 4.5.1. Key market trends, growth factors and opportunities
- 4.5.2. Market size and forecast, by region
- 4.5.3. Market share analysis by country
- 4.6. Others
- 4.6.1. Key market trends, growth factors and opportunities
- 4.6.2. Market size and forecast, by region
- 4.6.3. Market share analysis by country
CHAPTER 5: BODY LOTION MARKET, BY END USER
- 5.1. Overview
- 5.1.1. Market size and forecast
- 5.2. Male
- 5.2.1. Key market trends, growth factors and opportunities
- 5.2.2. Market size and forecast, by region
- 5.2.3. Market share analysis by country
- 5.3. Female
- 5.3.1. Key market trends, growth factors and opportunities
- 5.3.2. Market size and forecast, by region
- 5.3.3. Market share analysis by country
- 5.4. Kids
- 5.4.1. Key market trends, growth factors and opportunities
- 5.4.2. Market size and forecast, by region
- 5.4.3. Market share analysis by country
CHAPTER 6: BODY LOTION MARKET, BY PACKAGING
- 6.1. Overview
- 6.1.1. Market size and forecast
- 6.2. Bottles
- 6.2.1. Key market trends, growth factors and opportunities
- 6.2.2. Market size and forecast, by region
- 6.2.3. Market share analysis by country
- 6.3. Tubes
- 6.3.1. Key market trends, growth factors and opportunities
- 6.3.2. Market size and forecast, by region
- 6.3.3. Market share analysis by country
- 6.4. Pumps
- 6.4.1. Key market trends, growth factors and opportunities
- 6.4.2. Market size and forecast, by region
- 6.4.3. Market share analysis by country
- 6.5. Others
- 6.5.1. Key market trends, growth factors and opportunities
- 6.5.2. Market size and forecast, by region
- 6.5.3. Market share analysis by country
CHAPTER 7: BODY LOTION MARKET, BY DISTRIBUTION CHANNEL
- 7.1. Overview
- 7.1.1. Market size and forecast
- 7.2. Supermarket and Hypermarket
- 7.2.1. Key market trends, growth factors and opportunities
- 7.2.2. Market size and forecast, by region
- 7.2.3. Market share analysis by country
- 7.3. Specialty Store
- 7.3.1. Key market trends, growth factors and opportunities
- 7.3.2. Market size and forecast, by region
- 7.3.3. Market share analysis by country
- 7.4. Online Channel
- 7.4.1. Key market trends, growth factors and opportunities
- 7.4.2. Market size and forecast, by region
- 7.4.3. Market share analysis by country
- 7.5. Others
- 7.5.1. Key market trends, growth factors and opportunities
- 7.5.2. Market size and forecast, by region
- 7.5.3. Market share analysis by country
CHAPTER 8: BODY LOTION MARKET, BY REGION
- 8.1. Overview
- 8.1.1. Market size and forecast By Region
- 8.2. North America
- 8.2.1. Key market trends, growth factors and opportunities
- 8.2.2. Market size and forecast, by Type
- 8.2.3. Market size and forecast, by End User
- 8.2.4. Market size and forecast, by Packaging
- 8.2.5. Market size and forecast, by Distribution Channel
- 8.2.6. Market size and forecast, by country
- 8.2.6.1. U.S.
- 8.2.6.1.1. Market size and forecast, by Type
- 8.2.6.1.2. Market size and forecast, by End User
- 8.2.6.1.3. Market size and forecast, by Packaging
- 8.2.6.1.4. Market size and forecast, by Distribution Channel
- 8.2.6.2. Canada
- 8.2.6.2.1. Market size and forecast, by Type
- 8.2.6.2.2. Market size and forecast, by End User
- 8.2.6.2.3. Market size and forecast, by Packaging
- 8.2.6.2.4. Market size and forecast, by Distribution Channel
- 8.2.6.3. Mexico
- 8.2.6.3.1. Market size and forecast, by Type
- 8.2.6.3.2. Market size and forecast, by End User
- 8.2.6.3.3. Market size and forecast, by Packaging
- 8.2.6.3.4. Market size and forecast, by Distribution Channel
- 8.3. Europe
- 8.3.1. Key market trends, growth factors and opportunities
- 8.3.2. Market size and forecast, by Type
- 8.3.3. Market size and forecast, by End User
- 8.3.4. Market size and forecast, by Packaging
- 8.3.5. Market size and forecast, by Distribution Channel
- 8.3.6. Market size and forecast, by country
- 8.3.6.1. Germany
- 8.3.6.1.1. Market size and forecast, by Type
- 8.3.6.1.2. Market size and forecast, by End User
- 8.3.6.1.3. Market size and forecast, by Packaging
- 8.3.6.1.4. Market size and forecast, by Distribution Channel
- 8.3.6.2. UK
- 8.3.6.2.1. Market size and forecast, by Type
- 8.3.6.2.2. Market size and forecast, by End User
- 8.3.6.2.3. Market size and forecast, by Packaging
- 8.3.6.2.4. Market size and forecast, by Distribution Channel
- 8.3.6.3. France
- 8.3.6.3.1. Market size and forecast, by Type
- 8.3.6.3.2. Market size and forecast, by End User
- 8.3.6.3.3. Market size and forecast, by Packaging
- 8.3.6.3.4. Market size and forecast, by Distribution Channel
- 8.3.6.4. Italy
- 8.3.6.4.1. Market size and forecast, by Type
- 8.3.6.4.2. Market size and forecast, by End User
- 8.3.6.4.3. Market size and forecast, by Packaging
- 8.3.6.4.4. Market size and forecast, by Distribution Channel
- 8.3.6.5. Spain
- 8.3.6.5.1. Market size and forecast, by Type
- 8.3.6.5.2. Market size and forecast, by End User
- 8.3.6.5.3. Market size and forecast, by Packaging
- 8.3.6.5.4. Market size and forecast, by Distribution Channel
- 8.3.6.6. Rest of Europe
- 8.3.6.6.1. Market size and forecast, by Type
- 8.3.6.6.2. Market size and forecast, by End User
- 8.3.6.6.3. Market size and forecast, by Packaging
- 8.3.6.6.4. Market size and forecast, by Distribution Channel
- 8.4. Asia-Pacific
- 8.4.1. Key market trends, growth factors and opportunities
- 8.4.2. Market size and forecast, by Type
- 8.4.3. Market size and forecast, by End User
- 8.4.4. Market size and forecast, by Packaging
- 8.4.5. Market size and forecast, by Distribution Channel
- 8.4.6. Market size and forecast, by country
- 8.4.6.1. China
- 8.4.6.1.1. Market size and forecast, by Type
- 8.4.6.1.2. Market size and forecast, by End User
- 8.4.6.1.3. Market size and forecast, by Packaging
- 8.4.6.1.4. Market size and forecast, by Distribution Channel
- 8.4.6.2. South Korea
- 8.4.6.2.1. Market size and forecast, by Type
- 8.4.6.2.2. Market size and forecast, by End User
- 8.4.6.2.3. Market size and forecast, by Packaging
- 8.4.6.2.4. Market size and forecast, by Distribution Channel
- 8.4.6.3. Japan
- 8.4.6.3.1. Market size and forecast, by Type
- 8.4.6.3.2. Market size and forecast, by End User
- 8.4.6.3.3. Market size and forecast, by Packaging
- 8.4.6.3.4. Market size and forecast, by Distribution Channel
- 8.4.6.4. India
- 8.4.6.4.1. Market size and forecast, by Type
- 8.4.6.4.2. Market size and forecast, by End User
- 8.4.6.4.3. Market size and forecast, by Packaging
- 8.4.6.4.4. Market size and forecast, by Distribution Channel
- 8.4.6.5. Australia
- 8.4.6.5.1. Market size and forecast, by Type
- 8.4.6.5.2. Market size and forecast, by End User
- 8.4.6.5.3. Market size and forecast, by Packaging
- 8.4.6.5.4. Market size and forecast, by Distribution Channel
- 8.4.6.6. Asean
- 8.4.6.6.1. Market size and forecast, by Type
- 8.4.6.6.2. Market size and forecast, by End User
- 8.4.6.6.3. Market size and forecast, by Packaging
- 8.4.6.6.4. Market size and forecast, by Distribution Channel
- 8.4.6.7. Rest of Asia-Pacific
- 8.4.6.7.1. Market size and forecast, by Type
- 8.4.6.7.2. Market size and forecast, by End User
- 8.4.6.7.3. Market size and forecast, by Packaging
- 8.4.6.7.4. Market size and forecast, by Distribution Channel
- 8.5. LAMEA
- 8.5.1. Key market trends, growth factors and opportunities
- 8.5.2. Market size and forecast, by Type
- 8.5.3. Market size and forecast, by End User
- 8.5.4. Market size and forecast, by Packaging
- 8.5.5. Market size and forecast, by Distribution Channel
- 8.5.6. Market size and forecast, by country
- 8.5.6.1. Brazil
- 8.5.6.1.1. Market size and forecast, by Type
- 8.5.6.1.2. Market size and forecast, by End User
- 8.5.6.1.3. Market size and forecast, by Packaging
- 8.5.6.1.4. Market size and forecast, by Distribution Channel
- 8.5.6.2. Argentina
- 8.5.6.2.1. Market size and forecast, by Type
- 8.5.6.2.2. Market size and forecast, by End User
- 8.5.6.2.3. Market size and forecast, by Packaging
- 8.5.6.2.4. Market size and forecast, by Distribution Channel
- 8.5.6.3. Chile
- 8.5.6.3.1. Market size and forecast, by Type
- 8.5.6.3.2. Market size and forecast, by End User
- 8.5.6.3.3. Market size and forecast, by Packaging
- 8.5.6.3.4. Market size and forecast, by Distribution Channel
- 8.5.6.4. United Arab Emirates
- 8.5.6.4.1. Market size and forecast, by Type
- 8.5.6.4.2. Market size and forecast, by End User
- 8.5.6.4.3. Market size and forecast, by Packaging
- 8.5.6.4.4. Market size and forecast, by Distribution Channel
- 8.5.6.5. South Africa
- 8.5.6.5.1. Market size and forecast, by Type
- 8.5.6.5.2. Market size and forecast, by End User
- 8.5.6.5.3. Market size and forecast, by Packaging
- 8.5.6.5.4. Market size and forecast, by Distribution Channel
- 8.5.6.6. Rest of LAMEA
- 8.5.6.6.1. Market size and forecast, by Type
- 8.5.6.6.2. Market size and forecast, by End User
- 8.5.6.6.3. Market size and forecast, by Packaging
- 8.5.6.6.4. Market size and forecast, by Distribution Channel
CHAPTER 9: COMPETITIVE LANDSCAPE
- 9.1. Introduction
- 9.2. Top winning strategies
- 9.3. Product mapping of top 10 player
- 9.4. Competitive dashboard
- 9.5. Competitive heatmap
- 9.6. Top player positioning, 2022
CHAPTER 10: COMPANY PROFILES
- 10.1. Hindustan Unilever Limited
- 10.1.1. Company overview
- 10.1.2. Key executives
- 10.1.3. Company snapshot
- 10.1.4. Operating business segments
- 10.1.5. Product portfolio
- 10.1.6. Business performance
- 10.2. Galderma S.A.
- 10.2.1. Company overview
- 10.2.2. Key executives
- 10.2.3. Company snapshot
- 10.2.4. Operating business segments
- 10.2.5. Product portfolio
- 10.2.6. Key strategic moves and developments
- 10.3. The Estee Lauder Companies Inc.
- 10.3.1. Company overview
- 10.3.2. Key executives
- 10.3.3. Company snapshot
- 10.3.4. Operating business segments
- 10.3.5. Product portfolio
- 10.3.6. Business performance
- 10.3.7. Key strategic moves and developments
- 10.4. The Procter & Gamble Company
- 10.4.1. Company overview
- 10.4.2. Key executives
- 10.4.3. Company snapshot
- 10.4.4. Operating business segments
- 10.4.5. Product portfolio
- 10.4.6. Business performance
- 10.4.7. Key strategic moves and developments
- 10.5. Beiersdorf AG
- 10.5.1. Company overview
- 10.5.2. Key executives
- 10.5.3. Company snapshot
- 10.5.4. Operating business segments
- 10.5.5. Product portfolio
- 10.5.6. Business performance
- 10.5.7. Key strategic moves and developments
- 10.6. Groupe Clarins
- 10.6.1. Company overview
- 10.6.2. Key executives
- 10.6.3. Company snapshot
- 10.6.4. Operating business segments
- 10.6.5. Product portfolio
- 10.6.6. Key strategic moves and developments
- 10.7. Avon Products, Inc
- 10.7.1. Company overview
- 10.7.2. Key executives
- 10.7.3. Company snapshot
- 10.7.4. Operating business segments
- 10.7.5. Product portfolio
- 10.7.6. Key strategic moves and developments
- 10.8. Revlon, Inc.
- 10.8.1. Company overview
- 10.8.2. Key executives
- 10.8.3. Company snapshot
- 10.8.4. Operating business segments
- 10.8.5. Product portfolio
- 10.8.6. Business performance
- 10.9. Johnson & Johnson Services, Inc.
- 10.9.1. Company overview
- 10.9.2. Key executives
- 10.9.3. Company snapshot
- 10.9.4. Operating business segments
- 10.9.5. Product portfolio
- 10.9.6. Business performance
- 10.10. Coty Inc.
- 10.10.1. Company overview
- 10.10.2. Key executives
- 10.10.3. Company snapshot
- 10.10.4. Operating business segments
- 10.10.5. Product portfolio
- 10.10.6. Business performance
- 10.10.7. Key strategic moves and developments
