
|
市場調査レポート
商品コード
1414900
通信費管理(TEM)市場:タイプ別、展開形態別、企業規模別、エンドユーザー別:世界の機会分析と産業予測、2023-2032年Telecom Expense Management Market By Type, By Deployment Mode, By Enterprise Size, By End User : Global Opportunity Analysis and Industry Forecast, 2023-2032 |
||||||
|
|||||||

| 通信費管理(TEM)市場:タイプ別、展開形態別、企業規模別、エンドユーザー別:世界の機会分析と産業予測、2023-2032年 |
|
出版日: 2023年11月30日
発行: Allied Market Research
ページ情報: 英文 434 Pages
納期: 2~3営業日
|

- 全表示
- 概要
- 図表
- 目次
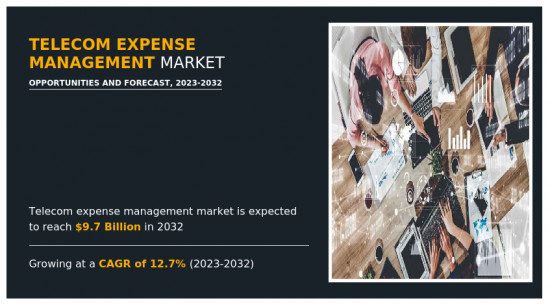
通信費管理(TEM)市場は、2022年には30億米ドルと評価され、2023年から2032年までのCAGRは12.7%で成長し、2032年には97億米ドルに達すると予測されています。
通信費管理(TEM)とは、組織が通信サービスに関連するコストや資産をより適切に管理・コントロールできるようにする、さまざまなタスク、プロセス、テクノロジー、サービスを指す言葉です。電気通信サービスには、一般的に以下のような固定有線通信サービスが含まれます。
- 音声、データ、ネットワーク・サービス。電気通信の最適化には通常、既存の通信投資をより効率的に活用することでコストや無駄を削減することが含まれます。
TEMには、効率性、費用対効果、組織方針の遵守を確保するために、これらの経費を戦略的に監督、分析、管理することが含まれます。このプロセスには通常、以下のような活動が含まれます。
- 請求書の検証、在庫管理、契約交渉、通信サービスの最適化。TEMを実施することで、企業は通信費の可視性を高め、コスト削減の可能性を特定し、通信サービスの領域における全体的な業務効率を高めることを目指しています。TEMソリューションには、プロセスを自動化し、通信費に関するリアルタイムの洞察を提供する特殊なソフトウェア・プラットフォームが含まれており、企業は十分な情報に基づいた意思決定を行い、通信予算を管理することができます。
通信費管理(TEM)は、通信業界のダイナミックな性質と、複雑化する組織の通信ニーズに組み込まれています。企業が成長するにつれ、モバイル機器、データプラン、音声サービスなど、多様な通信サービスへの依存度も高まっています。こうしたサービスの量と多様性により、組織は関連費用を効果的に監視・管理することが課題となっています。
目次
第1章 イントロダクション
第2章 エグゼクティブサマリー
第3章 市場概要
- 市場の定義と範囲
- 主な調査結果
- 影響要因
- 主な投資機会
- ポーターのファイブフォース分析
- 市場力学
- 促進要因
- 携帯電話やその他のポータブルデバイスの普及拡大
- 増大する通信費の管理に対する需要の急増
- 5Gインフラへの投資の増加
- 抑制要因
- セキュリティ問題と相互運用性の欠如
- 機会
- 経費の可視化とコスト削減ニーズの高まり
- 促進要因
第4章 通信費管理市場:タイプ別
- 概要
- 係争管理
- 請求書管理
- 発注・プロビジョニング管理
- ソーシング管理
- 利用管理
- その他
第5章 通信費管理市場:展開形態別
- 概要
- オンプレミス
- クラウド
第6章 通信費管理市場:企業規模別
- 概要
- 大企業
- 中小企業
第7章 通信費管理市場:エンドユーザー別
- 概要
- BFSI
- 消費財・小売
- ITおよび電気通信
- ヘルスケア
- 製造・自動車
- その他
第8章 通信費管理市場:地域別
- 概要
- 北米
- 米国
- カナダ
- 欧州
- 英国
- ドイツ
- フランス
- イタリア
- スペイン
- その他
- アジア太平洋
- 中国
- 日本
- インド
- オーストラリア
- 韓国
- その他
- ラテンアメリカ
- ラテンアメリカ
- 中東
- アフリカ
第9章 競合情勢
- イントロダクション
- 主要成功戦略
- 主要10社の製品マッピング
- 競合ダッシュボード
- 競合ヒートマップ
- 主要企業のポジショニング、2022年
第10章 企業プロファイル
- Accenture
- AVOTUS
- Calero
- CGI Inc.
- WidePoint Corporation
- Tangoe
- Vodafone Group Plc
- Sakon
- TeleManagement Technologies, Inc.
- Upland Software, Inc.
LIST OF TABLES
- TABLE 01. GLOBAL TELECOM EXPENSE MANAGEMENT MARKET, BY TYPE, 2022-2032 ($MILLION)
- TABLE 02. TELECOM EXPENSE MANAGEMENT MARKET FOR DISPUTE MANAGEMENT, BY REGION, 2022-2032 ($MILLION)
- TABLE 03. TELECOM EXPENSE MANAGEMENT MARKET FOR INVOICE MANAGEMENT, BY REGION, 2022-2032 ($MILLION)
- TABLE 04. TELECOM EXPENSE MANAGEMENT MARKET FOR ORDERING AND PROVISIONING MANAGEMENT, BY REGION, 2022-2032 ($MILLION)
- TABLE 05. TELECOM EXPENSE MANAGEMENT MARKET FOR SOURCING MANAGEMENT, BY REGION, 2022-2032 ($MILLION)
- TABLE 06. TELECOM EXPENSE MANAGEMENT MARKET FOR USAGE MANAGEMENT, BY REGION, 2022-2032 ($MILLION)
- TABLE 07. TELECOM EXPENSE MANAGEMENT MARKET FOR OTHERS, BY REGION, 2022-2032 ($MILLION)
- TABLE 08. GLOBAL TELECOM EXPENSE MANAGEMENT MARKET, BY DEPLOYMENT MODE, 2022-2032 ($MILLION)
- TABLE 09. TELECOM EXPENSE MANAGEMENT MARKET FOR ON-PREMISE, BY REGION, 2022-2032 ($MILLION)
- TABLE 10. TELECOM EXPENSE MANAGEMENT MARKET FOR CLOUD, BY REGION, 2022-2032 ($MILLION)
- TABLE 11. GLOBAL TELECOM EXPENSE MANAGEMENT MARKET, BY ENTERPRISE SIZE, 2022-2032 ($MILLION)
- TABLE 12. TELECOM EXPENSE MANAGEMENT MARKET FOR LARGE ENTERPRISE, BY REGION, 2022-2032 ($MILLION)
- TABLE 13. TELECOM EXPENSE MANAGEMENT MARKET FOR SMALL AND MEDIUM-SIZED ENTERPRISE, BY REGION, 2022-2032 ($MILLION)
- TABLE 14. GLOBAL TELECOM EXPENSE MANAGEMENT MARKET, BY END USER, 2022-2032 ($MILLION)
- TABLE 15. TELECOM EXPENSE MANAGEMENT MARKET FOR BFSI, BY REGION, 2022-2032 ($MILLION)
- TABLE 16. TELECOM EXPENSE MANAGEMENT MARKET FOR CONSUMER GOODS AND RETAIL, BY REGION, 2022-2032 ($MILLION)
- TABLE 17. TELECOM EXPENSE MANAGEMENT MARKET FOR IT AND TELECOM, BY REGION, 2022-2032 ($MILLION)
- TABLE 18. TELECOM EXPENSE MANAGEMENT MARKET FOR HEALTHCARE, BY REGION, 2022-2032 ($MILLION)
- TABLE 19. TELECOM EXPENSE MANAGEMENT MARKET FOR MANUFACTURING AND AUTOMOTIVE, BY REGION, 2022-2032 ($MILLION)
- TABLE 20. TELECOM EXPENSE MANAGEMENT MARKET FOR OTHERS, BY REGION, 2022-2032 ($MILLION)
- TABLE 21. TELECOM EXPENSE MANAGEMENT MARKET, BY REGION, 2022-2032 ($MILLION)
- TABLE 22. NORTH AMERICA TELECOM EXPENSE MANAGEMENT MARKET, BY TYPE, 2022-2032 ($MILLION)
- TABLE 23. NORTH AMERICA TELECOM EXPENSE MANAGEMENT MARKET, BY DEPLOYMENT MODE, 2022-2032 ($MILLION)
- TABLE 24. NORTH AMERICA TELECOM EXPENSE MANAGEMENT MARKET, BY ENTERPRISE SIZE, 2022-2032 ($MILLION)
- TABLE 25. NORTH AMERICA TELECOM EXPENSE MANAGEMENT MARKET, BY END USER, 2022-2032 ($MILLION)
- TABLE 26. NORTH AMERICA TELECOM EXPENSE MANAGEMENT MARKET, BY COUNTRY, 2022-2032 ($MILLION)
- TABLE 27. U.S. TELECOM EXPENSE MANAGEMENT MARKET, BY TYPE, 2022-2032 ($MILLION)
- TABLE 28. U.S. TELECOM EXPENSE MANAGEMENT MARKET, BY DEPLOYMENT MODE, 2022-2032 ($MILLION)
- TABLE 29. U.S. TELECOM EXPENSE MANAGEMENT MARKET, BY ENTERPRISE SIZE, 2022-2032 ($MILLION)
- TABLE 30. U.S. TELECOM EXPENSE MANAGEMENT MARKET, BY END USER, 2022-2032 ($MILLION)
- TABLE 31. CANADA TELECOM EXPENSE MANAGEMENT MARKET, BY TYPE, 2022-2032 ($MILLION)
- TABLE 32. CANADA TELECOM EXPENSE MANAGEMENT MARKET, BY DEPLOYMENT MODE, 2022-2032 ($MILLION)
- TABLE 33. CANADA TELECOM EXPENSE MANAGEMENT MARKET, BY ENTERPRISE SIZE, 2022-2032 ($MILLION)
- TABLE 34. CANADA TELECOM EXPENSE MANAGEMENT MARKET, BY END USER, 2022-2032 ($MILLION)
- TABLE 35. EUROPE TELECOM EXPENSE MANAGEMENT MARKET, BY TYPE, 2022-2032 ($MILLION)
- TABLE 36. EUROPE TELECOM EXPENSE MANAGEMENT MARKET, BY DEPLOYMENT MODE, 2022-2032 ($MILLION)
- TABLE 37. EUROPE TELECOM EXPENSE MANAGEMENT MARKET, BY ENTERPRISE SIZE, 2022-2032 ($MILLION)
- TABLE 38. EUROPE TELECOM EXPENSE MANAGEMENT MARKET, BY END USER, 2022-2032 ($MILLION)
- TABLE 39. EUROPE TELECOM EXPENSE MANAGEMENT MARKET, BY COUNTRY, 2022-2032 ($MILLION)
- TABLE 40. UK TELECOM EXPENSE MANAGEMENT MARKET, BY TYPE, 2022-2032 ($MILLION)
- TABLE 41. UK TELECOM EXPENSE MANAGEMENT MARKET, BY DEPLOYMENT MODE, 2022-2032 ($MILLION)
- TABLE 42. UK TELECOM EXPENSE MANAGEMENT MARKET, BY ENTERPRISE SIZE, 2022-2032 ($MILLION)
- TABLE 43. UK TELECOM EXPENSE MANAGEMENT MARKET, BY END USER, 2022-2032 ($MILLION)
- TABLE 44. GERMANY TELECOM EXPENSE MANAGEMENT MARKET, BY TYPE, 2022-2032 ($MILLION)
- TABLE 45. GERMANY TELECOM EXPENSE MANAGEMENT MARKET, BY DEPLOYMENT MODE, 2022-2032 ($MILLION)
- TABLE 46. GERMANY TELECOM EXPENSE MANAGEMENT MARKET, BY ENTERPRISE SIZE, 2022-2032 ($MILLION)
- TABLE 47. GERMANY TELECOM EXPENSE MANAGEMENT MARKET, BY END USER, 2022-2032 ($MILLION)
- TABLE 48. FRANCE TELECOM EXPENSE MANAGEMENT MARKET, BY TYPE, 2022-2032 ($MILLION)
- TABLE 49. FRANCE TELECOM EXPENSE MANAGEMENT MARKET, BY DEPLOYMENT MODE, 2022-2032 ($MILLION)
- TABLE 50. FRANCE TELECOM EXPENSE MANAGEMENT MARKET, BY ENTERPRISE SIZE, 2022-2032 ($MILLION)
- TABLE 51. FRANCE TELECOM EXPENSE MANAGEMENT MARKET, BY END USER, 2022-2032 ($MILLION)
- TABLE 52. ITALY TELECOM EXPENSE MANAGEMENT MARKET, BY TYPE, 2022-2032 ($MILLION)
- TABLE 53. ITALY TELECOM EXPENSE MANAGEMENT MARKET, BY DEPLOYMENT MODE, 2022-2032 ($MILLION)
- TABLE 54. ITALY TELECOM EXPENSE MANAGEMENT MARKET, BY ENTERPRISE SIZE, 2022-2032 ($MILLION)
- TABLE 55. ITALY TELECOM EXPENSE MANAGEMENT MARKET, BY END USER, 2022-2032 ($MILLION)
- TABLE 56. SPAIN TELECOM EXPENSE MANAGEMENT MARKET, BY TYPE, 2022-2032 ($MILLION)
- TABLE 57. SPAIN TELECOM EXPENSE MANAGEMENT MARKET, BY DEPLOYMENT MODE, 2022-2032 ($MILLION)
- TABLE 58. SPAIN TELECOM EXPENSE MANAGEMENT MARKET, BY ENTERPRISE SIZE, 2022-2032 ($MILLION)
- TABLE 59. SPAIN TELECOM EXPENSE MANAGEMENT MARKET, BY END USER, 2022-2032 ($MILLION)
- TABLE 60. REST OF EUROPE TELECOM EXPENSE MANAGEMENT MARKET, BY TYPE, 2022-2032 ($MILLION)
- TABLE 61. REST OF EUROPE TELECOM EXPENSE MANAGEMENT MARKET, BY DEPLOYMENT MODE, 2022-2032 ($MILLION)
- TABLE 62. REST OF EUROPE TELECOM EXPENSE MANAGEMENT MARKET, BY ENTERPRISE SIZE, 2022-2032 ($MILLION)
- TABLE 63. REST OF EUROPE TELECOM EXPENSE MANAGEMENT MARKET, BY END USER, 2022-2032 ($MILLION)
- TABLE 64. ASIA-PACIFIC TELECOM EXPENSE MANAGEMENT MARKET, BY TYPE, 2022-2032 ($MILLION)
- TABLE 65. ASIA-PACIFIC TELECOM EXPENSE MANAGEMENT MARKET, BY DEPLOYMENT MODE, 2022-2032 ($MILLION)
- TABLE 66. ASIA-PACIFIC TELECOM EXPENSE MANAGEMENT MARKET, BY ENTERPRISE SIZE, 2022-2032 ($MILLION)
- TABLE 67. ASIA-PACIFIC TELECOM EXPENSE MANAGEMENT MARKET, BY END USER, 2022-2032 ($MILLION)
- TABLE 68. ASIA-PACIFIC TELECOM EXPENSE MANAGEMENT MARKET, BY COUNTRY, 2022-2032 ($MILLION)
- TABLE 69. CHINA TELECOM EXPENSE MANAGEMENT MARKET, BY TYPE, 2022-2032 ($MILLION)
- TABLE 70. CHINA TELECOM EXPENSE MANAGEMENT MARKET, BY DEPLOYMENT MODE, 2022-2032 ($MILLION)
- TABLE 71. CHINA TELECOM EXPENSE MANAGEMENT MARKET, BY ENTERPRISE SIZE, 2022-2032 ($MILLION)
- TABLE 72. CHINA TELECOM EXPENSE MANAGEMENT MARKET, BY END USER, 2022-2032 ($MILLION)
- TABLE 73. JAPAN TELECOM EXPENSE MANAGEMENT MARKET, BY TYPE, 2022-2032 ($MILLION)
- TABLE 74. JAPAN TELECOM EXPENSE MANAGEMENT MARKET, BY DEPLOYMENT MODE, 2022-2032 ($MILLION)
- TABLE 75. JAPAN TELECOM EXPENSE MANAGEMENT MARKET, BY ENTERPRISE SIZE, 2022-2032 ($MILLION)
- TABLE 76. JAPAN TELECOM EXPENSE MANAGEMENT MARKET, BY END USER, 2022-2032 ($MILLION)
- TABLE 77. INDIA TELECOM EXPENSE MANAGEMENT MARKET, BY TYPE, 2022-2032 ($MILLION)
- TABLE 78. INDIA TELECOM EXPENSE MANAGEMENT MARKET, BY DEPLOYMENT MODE, 2022-2032 ($MILLION)
- TABLE 79. INDIA TELECOM EXPENSE MANAGEMENT MARKET, BY ENTERPRISE SIZE, 2022-2032 ($MILLION)
- TABLE 80. INDIA TELECOM EXPENSE MANAGEMENT MARKET, BY END USER, 2022-2032 ($MILLION)
- TABLE 81. AUSTRALIA TELECOM EXPENSE MANAGEMENT MARKET, BY TYPE, 2022-2032 ($MILLION)
- TABLE 82. AUSTRALIA TELECOM EXPENSE MANAGEMENT MARKET, BY DEPLOYMENT MODE, 2022-2032 ($MILLION)
- TABLE 83. AUSTRALIA TELECOM EXPENSE MANAGEMENT MARKET, BY ENTERPRISE SIZE, 2022-2032 ($MILLION)
- TABLE 84. AUSTRALIA TELECOM EXPENSE MANAGEMENT MARKET, BY END USER, 2022-2032 ($MILLION)
- TABLE 85. SOUTH KOREA TELECOM EXPENSE MANAGEMENT MARKET, BY TYPE, 2022-2032 ($MILLION)
- TABLE 86. SOUTH KOREA TELECOM EXPENSE MANAGEMENT MARKET, BY DEPLOYMENT MODE, 2022-2032 ($MILLION)
- TABLE 87. SOUTH KOREA TELECOM EXPENSE MANAGEMENT MARKET, BY ENTERPRISE SIZE, 2022-2032 ($MILLION)
- TABLE 88. SOUTH KOREA TELECOM EXPENSE MANAGEMENT MARKET, BY END USER, 2022-2032 ($MILLION)
- TABLE 89. REST OF ASIA-PACIFIC TELECOM EXPENSE MANAGEMENT MARKET, BY TYPE, 2022-2032 ($MILLION)
- TABLE 90. REST OF ASIA-PACIFIC TELECOM EXPENSE MANAGEMENT MARKET, BY DEPLOYMENT MODE, 2022-2032 ($MILLION)
- TABLE 91. REST OF ASIA-PACIFIC TELECOM EXPENSE MANAGEMENT MARKET, BY ENTERPRISE SIZE, 2022-2032 ($MILLION)
- TABLE 92. REST OF ASIA-PACIFIC TELECOM EXPENSE MANAGEMENT MARKET, BY END USER, 2022-2032 ($MILLION)
- TABLE 93. LAMEA TELECOM EXPENSE MANAGEMENT MARKET, BY TYPE, 2022-2032 ($MILLION)
- TABLE 94. LAMEA TELECOM EXPENSE MANAGEMENT MARKET, BY DEPLOYMENT MODE, 2022-2032 ($MILLION)
- TABLE 95. LAMEA TELECOM EXPENSE MANAGEMENT MARKET, BY ENTERPRISE SIZE, 2022-2032 ($MILLION)
- TABLE 96. LAMEA TELECOM EXPENSE MANAGEMENT MARKET, BY END USER, 2022-2032 ($MILLION)
- TABLE 97. LAMEA TELECOM EXPENSE MANAGEMENT MARKET, BY COUNTRY, 2022-2032 ($MILLION)
- TABLE 98. LATIN AMERICA TELECOM EXPENSE MANAGEMENT MARKET, BY TYPE, 2022-2032 ($MILLION)
- TABLE 99. LATIN AMERICA TELECOM EXPENSE MANAGEMENT MARKET, BY DEPLOYMENT MODE, 2022-2032 ($MILLION)
- TABLE 100. LATIN AMERICA TELECOM EXPENSE MANAGEMENT MARKET, BY ENTERPRISE SIZE, 2022-2032 ($MILLION)
- TABLE 101. LATIN AMERICA TELECOM EXPENSE MANAGEMENT MARKET, BY END USER, 2022-2032 ($MILLION)
- TABLE 102. MIDDLE EAST TELECOM EXPENSE MANAGEMENT MARKET, BY TYPE, 2022-2032 ($MILLION)
- TABLE 103. MIDDLE EAST TELECOM EXPENSE MANAGEMENT MARKET, BY DEPLOYMENT MODE, 2022-2032 ($MILLION)
- TABLE 104. MIDDLE EAST TELECOM EXPENSE MANAGEMENT MARKET, BY ENTERPRISE SIZE, 2022-2032 ($MILLION)
- TABLE 105. MIDDLE EAST TELECOM EXPENSE MANAGEMENT MARKET, BY END USER, 2022-2032 ($MILLION)
- TABLE 106. AFRICA TELECOM EXPENSE MANAGEMENT MARKET, BY TYPE, 2022-2032 ($MILLION)
- TABLE 107. AFRICA TELECOM EXPENSE MANAGEMENT MARKET, BY DEPLOYMENT MODE, 2022-2032 ($MILLION)
- TABLE 108. AFRICA TELECOM EXPENSE MANAGEMENT MARKET, BY ENTERPRISE SIZE, 2022-2032 ($MILLION)
- TABLE 109. AFRICA TELECOM EXPENSE MANAGEMENT MARKET, BY END USER, 2022-2032 ($MILLION)
- TABLE 110. ACCENTURE: KEY EXECUTIVES
- TABLE 111. ACCENTURE: COMPANY SNAPSHOT
- TABLE 112. ACCENTURE: PRODUCT SEGMENTS
- TABLE 113. ACCENTURE: PRODUCT PORTFOLIO
- TABLE 114. ACCENTURE: KEY STRATERGIES
- TABLE 115. AVOTUS: KEY EXECUTIVES
- TABLE 116. AVOTUS: COMPANY SNAPSHOT
- TABLE 117. AVOTUS: PRODUCT SEGMENTS
- TABLE 118. AVOTUS: PRODUCT PORTFOLIO
- TABLE 119. CALERO: KEY EXECUTIVES
- TABLE 120. CALERO: COMPANY SNAPSHOT
- TABLE 121. CALERO: SERVICE SEGMENTS
- TABLE 122. CALERO: PRODUCT PORTFOLIO
- TABLE 123. CALERO: KEY STRATERGIES
- TABLE 124. CGI INC.: KEY EXECUTIVES
- TABLE 125. CGI INC.: COMPANY SNAPSHOT
- TABLE 126. CGI INC.: SERVICE SEGMENTS
- TABLE 127. CGI INC.: PRODUCT PORTFOLIO
- TABLE 128. WIDEPOINT CORPORATION: KEY EXECUTIVES
- TABLE 129. WIDEPOINT CORPORATION: COMPANY SNAPSHOT
- TABLE 130. WIDEPOINT CORPORATION: SERVICE SEGMENTS
- TABLE 131. WIDEPOINT CORPORATION: PRODUCT PORTFOLIO
- TABLE 132. WIDEPOINT CORPORATION: KEY STRATERGIES
- TABLE 133. TANGOE: KEY EXECUTIVES
- TABLE 134. TANGOE: COMPANY SNAPSHOT
- TABLE 135. TANGOE: PRODUCT SEGMENTS
- TABLE 136. TANGOE: PRODUCT PORTFOLIO
- TABLE 137. VODAFONE GROUP PLC: KEY EXECUTIVES
- TABLE 138. VODAFONE GROUP PLC: COMPANY SNAPSHOT
- TABLE 139. VODAFONE GROUP PLC: SERVICE SEGMENTS
- TABLE 140. VODAFONE GROUP PLC: PRODUCT PORTFOLIO
- TABLE 141. VODAFONE GROUP PLC: KEY STRATERGIES
- TABLE 142. SAKON: KEY EXECUTIVES
- TABLE 143. SAKON: COMPANY SNAPSHOT
- TABLE 144. SAKON: SERVICE SEGMENTS
- TABLE 145. SAKON: PRODUCT PORTFOLIO
- TABLE 146. SAKON: KEY STRATERGIES
- TABLE 147. TELEMANAGEMENT TECHNOLOGIES, INC.: KEY EXECUTIVES
- TABLE 148. TELEMANAGEMENT TECHNOLOGIES, INC.: COMPANY SNAPSHOT
- TABLE 149. TELEMANAGEMENT TECHNOLOGIES, INC.: PRODUCT SEGMENTS
- TABLE 150. TELEMANAGEMENT TECHNOLOGIES, INC.: PRODUCT PORTFOLIO
- TABLE 151. UPLAND SOFTWARE, INC.: KEY EXECUTIVES
- TABLE 152. UPLAND SOFTWARE, INC.: COMPANY SNAPSHOT
- TABLE 153. UPLAND SOFTWARE, INC.: SERVICE SEGMENTS
- TABLE 154. UPLAND SOFTWARE, INC.: PRODUCT PORTFOLIO
LIST OF FIGURES
- FIGURE 01. TELECOM EXPENSE MANAGEMENT MARKET, 2022-2032
- FIGURE 02. SEGMENTATION OF TELECOM EXPENSE MANAGEMENT MARKET,2022-2032
- FIGURE 03. TOP IMPACTING FACTORS IN TELECOM EXPENSE MANAGEMENT MARKET (2022 TO 2032)
- FIGURE 04. TOP INVESTMENT POCKETS IN TELECOM EXPENSE MANAGEMENT MARKET (2023-2032)
- FIGURE 05. LOW BARGAINING POWER OF SUPPLIERS
- FIGURE 06. LOW THREAT OF NEW ENTRANTS
- FIGURE 07. LOW THREAT OF SUBSTITUTES
- FIGURE 08. LOW INTENSITY OF RIVALRY
- FIGURE 09. LOW BARGAINING POWER OF BUYERS
- FIGURE 10. GLOBAL TELECOM EXPENSE MANAGEMENT MARKET:DRIVERS, RESTRAINTS AND OPPORTUNITIES
- FIGURE 11. TELECOM EXPENSE MANAGEMENT MARKET, BY TYPE, 2022 AND 2032(%)
- FIGURE 12. COMPARATIVE SHARE ANALYSIS OF TELECOM EXPENSE MANAGEMENT MARKET FOR DISPUTE MANAGEMENT, BY COUNTRY 2022 AND 2032(%)
- FIGURE 13. COMPARATIVE SHARE ANALYSIS OF TELECOM EXPENSE MANAGEMENT MARKET FOR INVOICE MANAGEMENT, BY COUNTRY 2022 AND 2032(%)
- FIGURE 14. COMPARATIVE SHARE ANALYSIS OF TELECOM EXPENSE MANAGEMENT MARKET FOR ORDERING AND PROVISIONING MANAGEMENT, BY COUNTRY 2022 AND 2032(%)
- FIGURE 15. COMPARATIVE SHARE ANALYSIS OF TELECOM EXPENSE MANAGEMENT MARKET FOR SOURCING MANAGEMENT, BY COUNTRY 2022 AND 2032(%)
- FIGURE 16. COMPARATIVE SHARE ANALYSIS OF TELECOM EXPENSE MANAGEMENT MARKET FOR USAGE MANAGEMENT, BY COUNTRY 2022 AND 2032(%)
- FIGURE 17. COMPARATIVE SHARE ANALYSIS OF TELECOM EXPENSE MANAGEMENT MARKET FOR OTHERS, BY COUNTRY 2022 AND 2032(%)
- FIGURE 18. TELECOM EXPENSE MANAGEMENT MARKET, BY DEPLOYMENT MODE, 2022 AND 2032(%)
- FIGURE 19. COMPARATIVE SHARE ANALYSIS OF TELECOM EXPENSE MANAGEMENT MARKET FOR ON-PREMISE, BY COUNTRY 2022 AND 2032(%)
- FIGURE 20. COMPARATIVE SHARE ANALYSIS OF TELECOM EXPENSE MANAGEMENT MARKET FOR CLOUD, BY COUNTRY 2022 AND 2032(%)
- FIGURE 21. TELECOM EXPENSE MANAGEMENT MARKET, BY ENTERPRISE SIZE, 2022 AND 2032(%)
- FIGURE 22. COMPARATIVE SHARE ANALYSIS OF TELECOM EXPENSE MANAGEMENT MARKET FOR LARGE ENTERPRISE, BY COUNTRY 2022 AND 2032(%)
- FIGURE 23. COMPARATIVE SHARE ANALYSIS OF TELECOM EXPENSE MANAGEMENT MARKET FOR SMALL AND MEDIUM-SIZED ENTERPRISE, BY COUNTRY 2022 AND 2032(%)
- FIGURE 24. TELECOM EXPENSE MANAGEMENT MARKET, BY END USER, 2022 AND 2032(%)
- FIGURE 25. COMPARATIVE SHARE ANALYSIS OF TELECOM EXPENSE MANAGEMENT MARKET FOR BFSI, BY COUNTRY 2022 AND 2032(%)
- FIGURE 26. COMPARATIVE SHARE ANALYSIS OF TELECOM EXPENSE MANAGEMENT MARKET FOR CONSUMER GOODS AND RETAIL, BY COUNTRY 2022 AND 2032(%)
- FIGURE 27. COMPARATIVE SHARE ANALYSIS OF TELECOM EXPENSE MANAGEMENT MARKET FOR IT AND TELECOM, BY COUNTRY 2022 AND 2032(%)
- FIGURE 28. COMPARATIVE SHARE ANALYSIS OF TELECOM EXPENSE MANAGEMENT MARKET FOR HEALTHCARE, BY COUNTRY 2022 AND 2032(%)
- FIGURE 29. COMPARATIVE SHARE ANALYSIS OF TELECOM EXPENSE MANAGEMENT MARKET FOR MANUFACTURING AND AUTOMOTIVE, BY COUNTRY 2022 AND 2032(%)
- FIGURE 30. COMPARATIVE SHARE ANALYSIS OF TELECOM EXPENSE MANAGEMENT MARKET FOR OTHERS, BY COUNTRY 2022 AND 2032(%)
- FIGURE 31. TELECOM EXPENSE MANAGEMENT MARKET BY REGION, 2022 AND 2032(%)
- FIGURE 32. U.S. TELECOM EXPENSE MANAGEMENT MARKET, 2022-2032 ($MILLION)
- FIGURE 33. CANADA TELECOM EXPENSE MANAGEMENT MARKET, 2022-2032 ($MILLION)
- FIGURE 34. UK TELECOM EXPENSE MANAGEMENT MARKET, 2022-2032 ($MILLION)
- FIGURE 35. GERMANY TELECOM EXPENSE MANAGEMENT MARKET, 2022-2032 ($MILLION)
- FIGURE 36. FRANCE TELECOM EXPENSE MANAGEMENT MARKET, 2022-2032 ($MILLION)
- FIGURE 37. ITALY TELECOM EXPENSE MANAGEMENT MARKET, 2022-2032 ($MILLION)
- FIGURE 38. SPAIN TELECOM EXPENSE MANAGEMENT MARKET, 2022-2032 ($MILLION)
- FIGURE 39. REST OF EUROPE TELECOM EXPENSE MANAGEMENT MARKET, 2022-2032 ($MILLION)
- FIGURE 40. CHINA TELECOM EXPENSE MANAGEMENT MARKET, 2022-2032 ($MILLION)
- FIGURE 41. JAPAN TELECOM EXPENSE MANAGEMENT MARKET, 2022-2032 ($MILLION)
- FIGURE 42. INDIA TELECOM EXPENSE MANAGEMENT MARKET, 2022-2032 ($MILLION)
- FIGURE 43. AUSTRALIA TELECOM EXPENSE MANAGEMENT MARKET, 2022-2032 ($MILLION)
- FIGURE 44. SOUTH KOREA TELECOM EXPENSE MANAGEMENT MARKET, 2022-2032 ($MILLION)
- FIGURE 45. REST OF ASIA-PACIFIC TELECOM EXPENSE MANAGEMENT MARKET, 2022-2032 ($MILLION)
- FIGURE 46. LATIN AMERICA TELECOM EXPENSE MANAGEMENT MARKET, 2022-2032 ($MILLION)
- FIGURE 47. MIDDLE EAST TELECOM EXPENSE MANAGEMENT MARKET, 2022-2032 ($MILLION)
- FIGURE 48. AFRICA TELECOM EXPENSE MANAGEMENT MARKET, 2022-2032 ($MILLION)
- FIGURE 49. TOP WINNING STRATEGIES, BY YEAR (2022-2023)
- FIGURE 50. TOP WINNING STRATEGIES, BY DEVELOPMENT (2022-2023)
- FIGURE 51. TOP WINNING STRATEGIES, BY COMPANY (2022-2023)
- FIGURE 52. PRODUCT MAPPING OF TOP 10 PLAYERS
- FIGURE 53. COMPETITIVE DASHBOARD
- FIGURE 54. COMPETITIVE HEATMAP: TELECOM EXPENSE MANAGEMENT MARKET
- FIGURE 55. TOP PLAYER POSITIONING, 2022
- FIGURE 56. ACCENTURE: RESEARCH & DEVELOPMENT EXPENDITURE, 2020-2022 ($MILLION)
- FIGURE 57. ACCENTURE: NET SALES, 2020-2022 ($MILLION)
- FIGURE 58. ACCENTURE: REVENUE SHARE BY SEGMENT, 2022 (%)
- FIGURE 59. ACCENTURE: REVENUE SHARE BY REGION, 2022 (%)
- FIGURE 60. CGI INC.: NET REVENUE, 2020-2022 ($MILLION)
- FIGURE 61. CGI INC.: REVENUE SHARE BY SEGMENT, 2021 (%)
- FIGURE 62. VODAFONE GROUP PLC: NET REVENUE, 2021-2023 ($MILLION)
- FIGURE 63. VODAFONE GROUP PLC: REVENUE SHARE BY REGION, 2023 (%)
According to a new report published by Allied Market Research, titled, "Telecom Expense Management Market," The telecom expense management market was valued at $3 billion in 2022, and is estimated to reach $9.7 billion by 2032, growing at a CAGR of 12.7% from 2023 to 2032.
Telecom expense management (TEM) is a term that describes a range of tasks, processes, technologies, and services that enable an organization to better manage and control their costs and assets related to telecommunications services. Telecom services commonly include fixed wireline communications services such as voice, data, and network services. Telecom optimization efforts typically include reducing costs and waste by making more efficient use of existing communications investments.
TEM involves the strategic oversight, analysis, and management of these expenses to ensure efficiency, cost-effectiveness, and compliance with organizational policies. This process typically includes activities such as invoice validation, inventory management, contract negotiation, and optimization of telecom services. By implementing TEM practices, businesses aim to gain better visibility into their telecom expenses, identify areas for cost savings, and enhance overall operational efficiency in the realm of communication services. TEM solutions involve the use of specialized software platforms to automate processes and provide real-time insights into telecom spending, enabling organizations to make informed decisions and maintain control over their telecommunications budgets.
Telecom expense management (TEM) is embedded in the dynamic nature of the telecommunications industry and the increasing complexity of organizational communication needs. As businesses grow, so does their reliance on a diverse array of communication services, including mobile devices, data plans, voice services, and more. The sheer volume and diversity of these services make it challenging for organizations to effectively monitor and manage associated expenses.
In addition, the frequent changes in technology, service plans, and pricing structures further contribute to the complexity. Cost containment, operational efficiency, and compliance with corporate policies and industry regulations are key motivators for implementing TEM strategies. Organizations seek to optimize their telecom spending by identifying cost-saving opportunities, negotiating favorable contracts with service providers, and ensuring accurate invoicing.
The telecom expense management market is segmented on the basis of type, deployment mode, enterprise size, end user, and region. On the basis of type, the market is categorized into dispute management, invoice management, ordering & provisioning management, sourcing management, usage management, and others. By deployment mode, it is divided into on-premise and cloud. On the basis of enterprise size, the market is classified into large enterprise and small & medium-sized enterprise. On the basis of end user, the market is segregated into BFSI, consumer goods & retail, IT & telecom, healthcare, manufacturing & automotive, and others. By region, the market is analyzed across North America, Europe, Asia-Pacific, and LAMEA.
Competitive analysis and profiles of the major players in the telecom expense management industry include Accenture, CGI Inc., WidePoint Corporation, Tangoe, Vodafone Group Plc, AVOTUS, Calero, Sakon, Upland Software, Inc., and TeleManagement Technologies, Inc. Major players have adopted product launch, partnership, collaborations, and acquisition as key developmental strategies to improve the product portfolio and gain strong foothold in the telecom expense management industry.
Key Benefits For Stakeholders
- This report provides a quantitative analysis of the market segments, current trends, estimations, and dynamics of the telecom expense management market analysis from 2022 to 2032 to identify the prevailing telecom expense management market opportunities.
- The market research is offered along with information related to key drivers, restraints, and opportunities.
- Porter's five forces analysis highlights the potency of buyers and suppliers to enable stakeholders make profit-oriented business decisions and strengthen their supplier-buyer network.
- In-depth analysis of the telecom expense management market segmentation assists to determine the prevailing market opportunities.
- Major countries in each region are mapped according to their revenue contribution to the global market.
- Market player positioning facilitates benchmarking and provides a clear understanding of the present position of the market players.
- The report includes the analysis of the regional as well as global telecom expense management market trends, key players, market segments, application areas, and market growth strategies.
Additional benefits you will get with this purchase are:
- Quarterly Update and* (only available with a corporate license, on listed price)
- 5 additional Company Profile of client Choice pre- or Post-purchase, as a free update.
- Free Upcoming Version on the Purchase of Five and Enterprise User License.
- 16 analyst hours of support* (post-purchase, if you find additional data requirements upon review of the report, you may receive support amounting to 16 analyst hours to solve questions, and post-sale queries)
- 15% Free Customization* (in case the scope or segment of the report does not match your requirements, 15% is equivalent to 3 working days of free work, applicable once)
- Free data Pack on the Five and Enterprise User License. (Excel version of the report)
- Free Updated report if the report is 6-12 months old or older.
- 24-hour priority response*
- Free Industry updates and white papers.
Possible Customization with this report (with additional cost and timeline, please talk to the sales executive to know more)
- Senario Analysis & Growth Trend Comparision
- Additional company profiles with specific to client's interest
- Additional country or region analysis- market size and forecast
- Expanded list for Company Profiles
- Key player details (including location, contact details, supplier/vendor network etc. in excel format)
- Market share analysis of players at global/region/country level
- SWOT Analysis
Key Market Segments
By Type
- Dispute Management
- Invoice Management
- Ordering and Provisioning Management
- Sourcing Management
- Usage Management
- Others
By Deployment Mode
- On-premise
- Cloud
By Enterprise Size
- Large Enterprise
- Small and Medium-sized Enterprise
By End User
- BFSI
- Consumer Goods and Retail
- IT and Telecom
- Healthcare
- Manufacturing and Automotive
- Others
By Region
- North America
- U.S.
- Canada
- Europe
- UK
- Germany
- France
- Italy
- Spain
- Rest of Europe
- Asia-Pacific
- China
- Japan
- India
- Australia
- South Korea
- Rest of Asia-Pacific
- LAMEA
- Latin America
- Middle East
- Africa
Key Market Players:
- Accenture
- CGI Inc.
- Tangoe
- Vodafone Group Plc
- Calero
- Upland Software, Inc.
- WidePoint Corporation
- AVOTUS
- Sakon
- TeleManagement Technologies, Inc.
TABLE OF CONTENTS
CHAPTER 1: INTRODUCTION
- 1.1. Report description
- 1.2. Key market segments
- 1.3. Key benefits to the stakeholders
- 1.4. Research methodology
- 1.4.1. Primary research
- 1.4.2. Secondary research
- 1.4.3. Analyst tools and models
CHAPTER 2: EXECUTIVE SUMMARY
- 2.1. CXO Perspective
CHAPTER 3: MARKET OVERVIEW
- 3.1. Market definition and scope
- 3.2. Key findings
- 3.2.1. Top impacting factors
- 3.2.2. Top investment pockets
- 3.3. Porter's five forces analysis
- 3.3.1. Low bargaining power of suppliers
- 3.3.2. Low threat of new entrants
- 3.3.3. Low threat of substitutes
- 3.3.4. Low intensity of rivalry
- 3.3.5. Low bargaining power of buyers
- 3.4. Market dynamics
- 3.4.1. Drivers
- 3.4.1.1. Increase in adoption of mobile phones and other portable devices
- 3.4.1.2. Surge in demand for managing the increasing telecom expense
- 3.4.1.3. Increased investment on 5G infrastructure
- 3.4.2. Restraints
- 3.4.2.1. Security issues and a lack of interoperability
- 3.4.3. Opportunities
- 3.4.3.1. Growing need for expense visibility and cost reduction
- 3.4.1. Drivers
CHAPTER 4: TELECOM EXPENSE MANAGEMENT MARKET, BY TYPE
- 4.1. Overview
- 4.1.1. Market size and forecast
- 4.2. Dispute Management
- 4.2.1. Key market trends, growth factors and opportunities
- 4.2.2. Market size and forecast, by region
- 4.2.3. Market share analysis by country
- 4.3. Invoice Management
- 4.3.1. Key market trends, growth factors and opportunities
- 4.3.2. Market size and forecast, by region
- 4.3.3. Market share analysis by country
- 4.4. Ordering and Provisioning Management
- 4.4.1. Key market trends, growth factors and opportunities
- 4.4.2. Market size and forecast, by region
- 4.4.3. Market share analysis by country
- 4.5. Sourcing Management
- 4.5.1. Key market trends, growth factors and opportunities
- 4.5.2. Market size and forecast, by region
- 4.5.3. Market share analysis by country
- 4.6. Usage Management
- 4.6.1. Key market trends, growth factors and opportunities
- 4.6.2. Market size and forecast, by region
- 4.6.3. Market share analysis by country
- 4.7. Others
- 4.7.1. Key market trends, growth factors and opportunities
- 4.7.2. Market size and forecast, by region
- 4.7.3. Market share analysis by country
CHAPTER 5: TELECOM EXPENSE MANAGEMENT MARKET, BY DEPLOYMENT MODE
- 5.1. Overview
- 5.1.1. Market size and forecast
- 5.2. On-premise
- 5.2.1. Key market trends, growth factors and opportunities
- 5.2.2. Market size and forecast, by region
- 5.2.3. Market share analysis by country
- 5.3. Cloud
- 5.3.1. Key market trends, growth factors and opportunities
- 5.3.2. Market size and forecast, by region
- 5.3.3. Market share analysis by country
CHAPTER 6: TELECOM EXPENSE MANAGEMENT MARKET, BY ENTERPRISE SIZE
- 6.1. Overview
- 6.1.1. Market size and forecast
- 6.2. Large Enterprise
- 6.2.1. Key market trends, growth factors and opportunities
- 6.2.2. Market size and forecast, by region
- 6.2.3. Market share analysis by country
- 6.3. Small and Medium-sized Enterprise
- 6.3.1. Key market trends, growth factors and opportunities
- 6.3.2. Market size and forecast, by region
- 6.3.3. Market share analysis by country
CHAPTER 7: TELECOM EXPENSE MANAGEMENT MARKET, BY END USER
- 7.1. Overview
- 7.1.1. Market size and forecast
- 7.2. BFSI
- 7.2.1. Key market trends, growth factors and opportunities
- 7.2.2. Market size and forecast, by region
- 7.2.3. Market share analysis by country
- 7.3. Consumer Goods and Retail
- 7.3.1. Key market trends, growth factors and opportunities
- 7.3.2. Market size and forecast, by region
- 7.3.3. Market share analysis by country
- 7.4. IT and Telecom
- 7.4.1. Key market trends, growth factors and opportunities
- 7.4.2. Market size and forecast, by region
- 7.4.3. Market share analysis by country
- 7.5. Healthcare
- 7.5.1. Key market trends, growth factors and opportunities
- 7.5.2. Market size and forecast, by region
- 7.5.3. Market share analysis by country
- 7.6. Manufacturing and Automotive
- 7.6.1. Key market trends, growth factors and opportunities
- 7.6.2. Market size and forecast, by region
- 7.6.3. Market share analysis by country
- 7.7. Others
- 7.7.1. Key market trends, growth factors and opportunities
- 7.7.2. Market size and forecast, by region
- 7.7.3. Market share analysis by country
CHAPTER 8: TELECOM EXPENSE MANAGEMENT MARKET, BY REGION
- 8.1. Overview
- 8.1.1. Market size and forecast By Region
- 8.2. North America
- 8.2.1. Key market trends, growth factors and opportunities
- 8.2.2. Market size and forecast, by Type
- 8.2.3. Market size and forecast, by Deployment Mode
- 8.2.4. Market size and forecast, by Enterprise Size
- 8.2.5. Market size and forecast, by End User
- 8.2.6. Market size and forecast, by country
- 8.2.6.1. U.S.
- 8.2.6.1.1. Market size and forecast, by Type
- 8.2.6.1.2. Market size and forecast, by Deployment Mode
- 8.2.6.1.3. Market size and forecast, by Enterprise Size
- 8.2.6.1.4. Market size and forecast, by End User
- 8.2.6.2. Canada
- 8.2.6.2.1. Market size and forecast, by Type
- 8.2.6.2.2. Market size and forecast, by Deployment Mode
- 8.2.6.2.3. Market size and forecast, by Enterprise Size
- 8.2.6.2.4. Market size and forecast, by End User
- 8.3. Europe
- 8.3.1. Key market trends, growth factors and opportunities
- 8.3.2. Market size and forecast, by Type
- 8.3.3. Market size and forecast, by Deployment Mode
- 8.3.4. Market size and forecast, by Enterprise Size
- 8.3.5. Market size and forecast, by End User
- 8.3.6. Market size and forecast, by country
- 8.3.6.1. UK
- 8.3.6.1.1. Market size and forecast, by Type
- 8.3.6.1.2. Market size and forecast, by Deployment Mode
- 8.3.6.1.3. Market size and forecast, by Enterprise Size
- 8.3.6.1.4. Market size and forecast, by End User
- 8.3.6.2. Germany
- 8.3.6.2.1. Market size and forecast, by Type
- 8.3.6.2.2. Market size and forecast, by Deployment Mode
- 8.3.6.2.3. Market size and forecast, by Enterprise Size
- 8.3.6.2.4. Market size and forecast, by End User
- 8.3.6.3. France
- 8.3.6.3.1. Market size and forecast, by Type
- 8.3.6.3.2. Market size and forecast, by Deployment Mode
- 8.3.6.3.3. Market size and forecast, by Enterprise Size
- 8.3.6.3.4. Market size and forecast, by End User
- 8.3.6.4. Italy
- 8.3.6.4.1. Market size and forecast, by Type
- 8.3.6.4.2. Market size and forecast, by Deployment Mode
- 8.3.6.4.3. Market size and forecast, by Enterprise Size
- 8.3.6.4.4. Market size and forecast, by End User
- 8.3.6.5. Spain
- 8.3.6.5.1. Market size and forecast, by Type
- 8.3.6.5.2. Market size and forecast, by Deployment Mode
- 8.3.6.5.3. Market size and forecast, by Enterprise Size
- 8.3.6.5.4. Market size and forecast, by End User
- 8.3.6.6. Rest of Europe
- 8.3.6.6.1. Market size and forecast, by Type
- 8.3.6.6.2. Market size and forecast, by Deployment Mode
- 8.3.6.6.3. Market size and forecast, by Enterprise Size
- 8.3.6.6.4. Market size and forecast, by End User
- 8.4. Asia-Pacific
- 8.4.1. Key market trends, growth factors and opportunities
- 8.4.2. Market size and forecast, by Type
- 8.4.3. Market size and forecast, by Deployment Mode
- 8.4.4. Market size and forecast, by Enterprise Size
- 8.4.5. Market size and forecast, by End User
- 8.4.6. Market size and forecast, by country
- 8.4.6.1. China
- 8.4.6.1.1. Market size and forecast, by Type
- 8.4.6.1.2. Market size and forecast, by Deployment Mode
- 8.4.6.1.3. Market size and forecast, by Enterprise Size
- 8.4.6.1.4. Market size and forecast, by End User
- 8.4.6.2. Japan
- 8.4.6.2.1. Market size and forecast, by Type
- 8.4.6.2.2. Market size and forecast, by Deployment Mode
- 8.4.6.2.3. Market size and forecast, by Enterprise Size
- 8.4.6.2.4. Market size and forecast, by End User
- 8.4.6.3. India
- 8.4.6.3.1. Market size and forecast, by Type
- 8.4.6.3.2. Market size and forecast, by Deployment Mode
- 8.4.6.3.3. Market size and forecast, by Enterprise Size
- 8.4.6.3.4. Market size and forecast, by End User
- 8.4.6.4. Australia
- 8.4.6.4.1. Market size and forecast, by Type
- 8.4.6.4.2. Market size and forecast, by Deployment Mode
- 8.4.6.4.3. Market size and forecast, by Enterprise Size
- 8.4.6.4.4. Market size and forecast, by End User
- 8.4.6.5. South Korea
- 8.4.6.5.1. Market size and forecast, by Type
- 8.4.6.5.2. Market size and forecast, by Deployment Mode
- 8.4.6.5.3. Market size and forecast, by Enterprise Size
- 8.4.6.5.4. Market size and forecast, by End User
- 8.4.6.6. Rest of Asia-Pacific
- 8.4.6.6.1. Market size and forecast, by Type
- 8.4.6.6.2. Market size and forecast, by Deployment Mode
- 8.4.6.6.3. Market size and forecast, by Enterprise Size
- 8.4.6.6.4. Market size and forecast, by End User
- 8.5. LAMEA
- 8.5.1. Key market trends, growth factors and opportunities
- 8.5.2. Market size and forecast, by Type
- 8.5.3. Market size and forecast, by Deployment Mode
- 8.5.4. Market size and forecast, by Enterprise Size
- 8.5.5. Market size and forecast, by End User
- 8.5.6. Market size and forecast, by country
- 8.5.6.1. Latin America
- 8.5.6.1.1. Market size and forecast, by Type
- 8.5.6.1.2. Market size and forecast, by Deployment Mode
- 8.5.6.1.3. Market size and forecast, by Enterprise Size
- 8.5.6.1.4. Market size and forecast, by End User
- 8.5.6.2. Middle East
- 8.5.6.2.1. Market size and forecast, by Type
- 8.5.6.2.2. Market size and forecast, by Deployment Mode
- 8.5.6.2.3. Market size and forecast, by Enterprise Size
- 8.5.6.2.4. Market size and forecast, by End User
- 8.5.6.3. Africa
- 8.5.6.3.1. Market size and forecast, by Type
- 8.5.6.3.2. Market size and forecast, by Deployment Mode
- 8.5.6.3.3. Market size and forecast, by Enterprise Size
- 8.5.6.3.4. Market size and forecast, by End User
CHAPTER 9: COMPETITIVE LANDSCAPE
- 9.1. Introduction
- 9.2. Top winning strategies
- 9.3. Product mapping of top 10 player
- 9.4. Competitive dashboard
- 9.5. Competitive heatmap
- 9.6. Top player positioning, 2022
CHAPTER 10: COMPANY PROFILES
- 10.1. Accenture
- 10.1.1. Company overview
- 10.1.2. Key executives
- 10.1.3. Company snapshot
- 10.1.4. Operating business segments
- 10.1.5. Product portfolio
- 10.1.6. Business performance
- 10.1.7. Key strategic moves and developments
- 10.2. AVOTUS
- 10.2.1. Company overview
- 10.2.2. Key executives
- 10.2.3. Company snapshot
- 10.2.4. Operating business segments
- 10.2.5. Product portfolio
- 10.3. Calero
- 10.3.1. Company overview
- 10.3.2. Key executives
- 10.3.3. Company snapshot
- 10.3.4. Operating business segments
- 10.3.5. Product portfolio
- 10.3.6. Key strategic moves and developments
- 10.4. CGI Inc.
- 10.4.1. Company overview
- 10.4.2. Key executives
- 10.4.3. Company snapshot
- 10.4.4. Operating business segments
- 10.4.5. Product portfolio
- 10.4.6. Business performance
- 10.5. WidePoint Corporation
- 10.5.1. Company overview
- 10.5.2. Key executives
- 10.5.3. Company snapshot
- 10.5.4. Operating business segments
- 10.5.5. Product portfolio
- 10.5.6. Business performance
- 10.5.7. Key strategic moves and developments
- 10.6. Tangoe
- 10.6.1. Company overview
- 10.6.2. Key executives
- 10.6.3. Company snapshot
- 10.6.4. Operating business segments
- 10.6.5. Product portfolio
- 10.7. Vodafone Group Plc
- 10.7.1. Company overview
- 10.7.2. Key executives
- 10.7.3. Company snapshot
- 10.7.4. Operating business segments
- 10.7.5. Product portfolio
- 10.7.6. Business performance
- 10.7.7. Key strategic moves and developments
- 10.8. Sakon
- 10.8.1. Company overview
- 10.8.2. Key executives
- 10.8.3. Company snapshot
- 10.8.4. Operating business segments
- 10.8.5. Product portfolio
- 10.8.6. Key strategic moves and developments
- 10.9. TeleManagement Technologies, Inc.
- 10.9.1. Company overview
- 10.9.2. Key executives
- 10.9.3. Company snapshot
- 10.9.4. Operating business segments
- 10.9.5. Product portfolio
- 10.10. Upland Software, Inc.
- 10.10.1. Company overview
- 10.10.2. Key executives
- 10.10.3. Company snapshot
- 10.10.4. Operating business segments
- 10.10.5. Product portfolio
- 10.10.6. Business performance
