|
|
市場調査レポート
商品コード
1396893
UV-C LED市場:世界の機会分析と産業予測、2023年~2032年UV-C LED Market By Application (Water/air disinfection, Sterilization, Healthcare, Industrial, Sensing, Others): Global Opportunity Analysis and Industry Forecast, 2023-2032 |
||||||
|
|
|||||||
|
|||||||


| UV-C LED市場:世界の機会分析と産業予測、2023年~2032年 |
|
出版日: 2023年09月30日
発行: Allied Market Research
ページ情報: 英文 230 Pages
納期: 2~3営業日
|

- 全表示
- 概要
- 図表
- 目次
UV-C LED市場は、2022年に3億8,000万米ドルと評価され、2023年~2032年にCAGR 36.6%を記録し、2032年には810万米ドルに達すると予測されています。
UV-C LEDは、他の従来のUVランプと比較していくつかの利点があります。コンパクトサイズで、エアコン、空気清浄機、洗濯機など様々な家電製品に簡単に組み込むことができます。UV-C LEDは、ポータブル製品によく採用されています。水銀灯の場合、殺菌に必要な紫外線量を照射するのに10~30分かかるが、UV-C LEDは電源を入れればフル稼働し、予熱も必要ないです。
UV-C LEDの水ろ過用途への急速な普及と、その卓越した殺菌効果が、世界のUV-C LED市場を牽引する主な要因となっています。しかし、UV-C LEDの熱管理は産業拡大を制限する重大な技術課題です。しかし、予測期間中、UV-C LEDは家電製品や消費財と統合され、市場拡大の有利な可能性を生み出すと予測されています。その他の市場促進要因は、出力と信頼性の向上、UV-C LEDの最近の単価引き下げです。
UV-C LED市場は用途と地域に区分されます。用途ベースでは、市場は水/空気殺菌、滅菌、ヘルスケア、産業、センシング、その他に分類されます。2022年には、水/空気殺菌分野が市場を独占し、ヘルスケア分野が予測期間中に最も高いCAGRで成長すると予測されています。
地域別では、北米(米国、カナダ、メキシコ)、欧州(英国、ドイツ、フランス、その他の欧州)、アジア太平洋(中国、日本、インド、韓国、その他のアジア太平洋)、ラテンアメリカ(中南米、中東・アフリカ)でUV-C LED市場動向が分析されています。
本レポートに掲載されている世界の主要UV-C LED市場の競合分析とプロファイルは、ams OSRAM、Crystal IS, Inc.、Convergever Inc、IRTronix, Inc.、日亜化学工業株式会社、日機装株式会社、窒化物半導体株式会社、NKFG株式会社、フォトンウェーブ株式会社、ソウルビオシス株式会社、シグニファイホールディング株式会社、スタンレー電気株式会社、桃園電子(香港)有限公司、豊田合成株式会社。UV-C LED市場の主要企業が採用する主な戦略は、製品発売、買収、事業拡大です。
目次
第1章 イントロダクション
第2章 エグゼクティブサマリー
第3章 市場概要
- 市場の定義と範囲
- 主な調査結果
- 影響要因
- 主な投資機会
- ポーターのファイブフォース分析
- 市場力学
- 促進要因
- 殺菌効果の高いUV-C LED
- 浄水への採用が急増
- 抑制要因
- UV-C LEDの熱管理が懸念される
- 機会
- 家電製品や消費者製品との統合
- 促進要因
第4章 UV-C LED市場:用途別
- 概要
- 水/空気の殺菌
- 殺菌
- ヘルスケア
- 産業用
- センシング
- その他
第5章 UV-C LED市場:地域別
- 概要
- 北米
- 米国
- カナダ
- メキシコ
- 欧州
- 英国
- ドイツ
- フランス
- その他
- アジア太平洋
- 中国
- 日本
- インド
- 韓国
- その他
- ラテンアメリカ
- ラテンアメリカ
- 中東
- アフリカ
第6章 競合情勢
- イントロダクション
- 主要成功戦略
- 主要10社の製品マッピング
- 競合ダッシュボード
- 競合ヒートマップ
- 主要企業のポジショニング、2022年
第7章 企業プロファイル
- ams OSRAM AG
- Nichia Corporation
- NKFG Corporation
- Signify Holding
- Taoyuan Electron(HK)Limited
- Asahi Kasei Corporation
- Convergever Inc., Ltd.
- DOWA Holdings Co., Ltd.
- Hongqi Technology Co., Ltd.
- Heraeus Holding
- High Power Lighting Corp.
- IBT group.(Ivy Bridge Technology)
- INTERNATIONAL LIGHT TECHNOLOGIES INC.
- IRTronix, Inc
- Nikkiso Co., Ltd.
- Photon Wave Co., Ltd.
- Seoul Viosys Co., Ltd.
- Stanley Electric Co., Ltd.
- Toyoda Gosei Co., Ltd.
- Nitride Semiconductors Co., Ltd.
LIST OF TABLES
- TABLE 01. GLOBAL UV-C LED MARKET, BY APPLICATION, 2022-2032 ($MILLION)
- TABLE 02. UV-C LED MARKET FOR WATER/AIR DISINFECTION, BY REGION, 2022-2032 ($MILLION)
- TABLE 03. UV-C LED MARKET FOR STERILIZATION, BY REGION, 2022-2032 ($MILLION)
- TABLE 04. UV-C LED MARKET FOR HEALTHCARE, BY REGION, 2022-2032 ($MILLION)
- TABLE 05. UV-C LED MARKET FOR INDUSTRIAL, BY REGION, 2022-2032 ($MILLION)
- TABLE 06. UV-C LED MARKET FOR SENSING, BY REGION, 2022-2032 ($MILLION)
- TABLE 07. UV-C LED MARKET FOR OTHERS, BY REGION, 2022-2032 ($MILLION)
- TABLE 08. UV-C LED MARKET, BY REGION, 2022-2032 ($MILLION)
- TABLE 09. NORTH AMERICA UV-C LED MARKET, BY APPLICATION, 2022-2032 ($MILLION)
- TABLE 10. NORTH AMERICA UV-C LED MARKET, BY COUNTRY, 2022-2032 ($MILLION)
- TABLE 11. U.S. UV-C LED MARKET, BY APPLICATION, 2022-2032 ($MILLION)
- TABLE 12. CANADA UV-C LED MARKET, BY APPLICATION, 2022-2032 ($MILLION)
- TABLE 13. MEXICO UV-C LED MARKET, BY APPLICATION, 2022-2032 ($MILLION)
- TABLE 14. EUROPE UV-C LED MARKET, BY APPLICATION, 2022-2032 ($MILLION)
- TABLE 15. EUROPE UV-C LED MARKET, BY COUNTRY, 2022-2032 ($MILLION)
- TABLE 16. UK UV-C LED MARKET, BY APPLICATION, 2022-2032 ($MILLION)
- TABLE 17. GERMANY UV-C LED MARKET, BY APPLICATION, 2022-2032 ($MILLION)
- TABLE 18. FRANCE UV-C LED MARKET, BY APPLICATION, 2022-2032 ($MILLION)
- TABLE 19. REST OF EUROPE UV-C LED MARKET, BY APPLICATION, 2022-2032 ($MILLION)
- TABLE 20. ASIA-PACIFIC UV-C LED MARKET, BY APPLICATION, 2022-2032 ($MILLION)
- TABLE 21. ASIA-PACIFIC UV-C LED MARKET, BY COUNTRY, 2022-2032 ($MILLION)
- TABLE 22. CHINA UV-C LED MARKET, BY APPLICATION, 2022-2032 ($MILLION)
- TABLE 23. JAPAN UV-C LED MARKET, BY APPLICATION, 2022-2032 ($MILLION)
- TABLE 24. INDIA UV-C LED MARKET, BY APPLICATION, 2022-2032 ($MILLION)
- TABLE 25. SOUTH KOREA UV-C LED MARKET, BY APPLICATION, 2022-2032 ($MILLION)
- TABLE 26. REST OF ASIA-PACIFIC UV-C LED MARKET, BY APPLICATION, 2022-2032 ($MILLION)
- TABLE 27. LAMEA UV-C LED MARKET, BY APPLICATION, 2022-2032 ($MILLION)
- TABLE 28. LAMEA UV-C LED MARKET, BY COUNTRY, 2022-2032 ($MILLION)
- TABLE 29. LATIN AMERICA UV-C LED MARKET, BY APPLICATION, 2022-2032 ($MILLION)
- TABLE 30. MIDDLE EAST UV-C LED MARKET, BY APPLICATION, 2022-2032 ($MILLION)
- TABLE 31. AFRICA UV-C LED MARKET, BY APPLICATION, 2022-2032 ($MILLION)
- TABLE 32. AMS OSRAM AG: KEY EXECUTIVES
- TABLE 33. AMS OSRAM AG: COMPANY SNAPSHOT
- TABLE 34. AMS OSRAM AG: SERVICE SEGMENTS
- TABLE 35. AMS OSRAM AG: PRODUCT PORTFOLIO
- TABLE 36. AMS OSRAM AG: KEY STRATERGIES
- TABLE 37. NICHIA CORPORATION: KEY EXECUTIVES
- TABLE 38. NICHIA CORPORATION: COMPANY SNAPSHOT
- TABLE 39. NICHIA CORPORATION: PRODUCT SEGMENTS
- TABLE 40. NICHIA CORPORATION: PRODUCT PORTFOLIO
- TABLE 41. NICHIA CORPORATION: KEY STRATERGIES
- TABLE 42. NKFG CORPORATION: KEY EXECUTIVES
- TABLE 43. NKFG CORPORATION: COMPANY SNAPSHOT
- TABLE 44. NKFG CORPORATION: PRODUCT SEGMENTS
- TABLE 45. NKFG CORPORATION: PRODUCT PORTFOLIO
- TABLE 46. SIGNIFY HOLDING: KEY EXECUTIVES
- TABLE 47. SIGNIFY HOLDING: COMPANY SNAPSHOT
- TABLE 48. SIGNIFY HOLDING: PRODUCT SEGMENTS
- TABLE 49. SIGNIFY HOLDING: PRODUCT PORTFOLIO
- TABLE 50. SIGNIFY HOLDING: KEY STRATERGIES
- TABLE 51. TAOYUAN ELECTRON (HK) LIMITED: KEY EXECUTIVES
- TABLE 52. TAOYUAN ELECTRON (HK) LIMITED: COMPANY SNAPSHOT
- TABLE 53. TAOYUAN ELECTRON (HK) LIMITED: PRODUCT SEGMENTS
- TABLE 54. TAOYUAN ELECTRON (HK) LIMITED: PRODUCT PORTFOLIO
- TABLE 55. TAOYUAN ELECTRON (HK) LIMITED: KEY STRATERGIES
- TABLE 56. ASAHI KASEI CORPORATION: KEY EXECUTIVES
- TABLE 57. ASAHI KASEI CORPORATION: COMPANY SNAPSHOT
- TABLE 58. ASAHI KASEI CORPORATION: PRODUCT SEGMENTS
- TABLE 59. ASAHI KASEI CORPORATION: PRODUCT PORTFOLIO
- TABLE 60. ASAHI KASEI CORPORATION: KEY STRATERGIES
- TABLE 61. CONVERGEVER INC., LTD.: KEY EXECUTIVES
- TABLE 62. CONVERGEVER INC., LTD.: COMPANY SNAPSHOT
- TABLE 63. CONVERGEVER INC., LTD.: PRODUCT SEGMENTS
- TABLE 64. CONVERGEVER INC., LTD.: PRODUCT PORTFOLIO
- TABLE 65. DOWA HOLDINGS CO., LTD.: KEY EXECUTIVES
- TABLE 66. DOWA HOLDINGS CO., LTD.: COMPANY SNAPSHOT
- TABLE 67. DOWA HOLDINGS CO., LTD.: PRODUCT SEGMENTS
- TABLE 68. DOWA HOLDINGS CO., LTD.: PRODUCT PORTFOLIO
- TABLE 69. HONGQI TECHNOLOGY CO., LTD.: KEY EXECUTIVES
- TABLE 70. HONGQI TECHNOLOGY CO., LTD.: COMPANY SNAPSHOT
- TABLE 71. HONGQI TECHNOLOGY CO., LTD.: PRODUCT SEGMENTS
- TABLE 72. HONGQI TECHNOLOGY CO., LTD.: PRODUCT PORTFOLIO
- TABLE 73. HERAEUS HOLDING: KEY EXECUTIVES
- TABLE 74. HERAEUS HOLDING: COMPANY SNAPSHOT
- TABLE 75. HERAEUS HOLDING: PRODUCT SEGMENTS
- TABLE 76. HERAEUS HOLDING: PRODUCT PORTFOLIO
- TABLE 77. HERAEUS HOLDING: KEY STRATERGIES
- TABLE 78. HIGH POWER LIGHTING CORP.: KEY EXECUTIVES
- TABLE 79. HIGH POWER LIGHTING CORP.: COMPANY SNAPSHOT
- TABLE 80. HIGH POWER LIGHTING CORP.: PRODUCT SEGMENTS
- TABLE 81. HIGH POWER LIGHTING CORP.: PRODUCT PORTFOLIO
- TABLE 82. IBT GROUP. (IVY BRIDGE TECHNOLOGY): KEY EXECUTIVES
- TABLE 83. IBT GROUP. (IVY BRIDGE TECHNOLOGY): COMPANY SNAPSHOT
- TABLE 84. IBT GROUP. (IVY BRIDGE TECHNOLOGY): PRODUCT SEGMENTS
- TABLE 85. IBT GROUP. (IVY BRIDGE TECHNOLOGY): PRODUCT PORTFOLIO
- TABLE 86. INTERNATIONAL LIGHT TECHNOLOGIES INC.: KEY EXECUTIVES
- TABLE 87. INTERNATIONAL LIGHT TECHNOLOGIES INC.: COMPANY SNAPSHOT
- TABLE 88. INTERNATIONAL LIGHT TECHNOLOGIES INC.: PRODUCT SEGMENTS
- TABLE 89. INTERNATIONAL LIGHT TECHNOLOGIES INC.: PRODUCT PORTFOLIO
- TABLE 90. IRTRONIX, INC: KEY EXECUTIVES
- TABLE 91. IRTRONIX, INC: COMPANY SNAPSHOT
- TABLE 92. IRTRONIX, INC: PRODUCT SEGMENTS
- TABLE 93. IRTRONIX, INC: PRODUCT PORTFOLIO
- TABLE 94. NIKKISO CO., LTD.: KEY EXECUTIVES
- TABLE 95. NIKKISO CO., LTD.: COMPANY SNAPSHOT
- TABLE 96. NIKKISO CO., LTD.: PRODUCT SEGMENTS
- TABLE 97. NIKKISO CO., LTD.: PRODUCT PORTFOLIO
- TABLE 98. NIKKISO CO., LTD.: KEY STRATERGIES
- TABLE 99. PHOTON WAVE CO., LTD.: KEY EXECUTIVES
- TABLE 100. PHOTON WAVE CO., LTD.: COMPANY SNAPSHOT
- TABLE 101. PHOTON WAVE CO., LTD.: PRODUCT SEGMENTS
- TABLE 102. PHOTON WAVE CO., LTD.: PRODUCT PORTFOLIO
- TABLE 103. SEOUL VIOSYS CO., LTD.: KEY EXECUTIVES
- TABLE 104. SEOUL VIOSYS CO., LTD.: COMPANY SNAPSHOT
- TABLE 105. SEOUL VIOSYS CO., LTD.: PRODUCT SEGMENTS
- TABLE 106. SEOUL VIOSYS CO., LTD.: SERVICE SEGMENTS
- TABLE 107. SEOUL VIOSYS CO., LTD.: PRODUCT PORTFOLIO
- TABLE 108. SEOUL VIOSYS CO., LTD.: KEY STRATERGIES
- TABLE 109. STANLEY ELECTRIC CO., LTD.: KEY EXECUTIVES
- TABLE 110. STANLEY ELECTRIC CO., LTD.: COMPANY SNAPSHOT
- TABLE 111. STANLEY ELECTRIC CO., LTD.: PRODUCT SEGMENTS
- TABLE 112. STANLEY ELECTRIC CO., LTD.: PRODUCT PORTFOLIO
- TABLE 113. STANLEY ELECTRIC CO., LTD.: KEY STRATERGIES
- TABLE 114. TOYODA GOSEI CO., LTD.: KEY EXECUTIVES
- TABLE 115. TOYODA GOSEI CO., LTD.: COMPANY SNAPSHOT
- TABLE 116. TOYODA GOSEI CO., LTD.: PRODUCT SEGMENTS
- TABLE 117. TOYODA GOSEI CO., LTD.: PRODUCT PORTFOLIO
- TABLE 118. TOYODA GOSEI CO., LTD.: KEY STRATERGIES
- TABLE 119. NITRIDE SEMICONDUCTORS CO., LTD.: KEY EXECUTIVES
- TABLE 120. NITRIDE SEMICONDUCTORS CO., LTD.: COMPANY SNAPSHOT
- TABLE 121. NITRIDE SEMICONDUCTORS CO., LTD.: PRODUCT SEGMENTS
- TABLE 122. NITRIDE SEMICONDUCTORS CO., LTD.: PRODUCT PORTFOLIO
LIST OF FIGURES
- FIGURE 01. UV-C LED MARKET, 2022-2032
- FIGURE 02. SEGMENTATION OF UV-C LED MARKET,2022-2032
- FIGURE 03. TOP INVESTMENT POCKETS IN UV-C LED MARKET (2023-2032)
- FIGURE 04. HIGH BARGAINING POWER OF SUPPLIERS
- FIGURE 05. MODERATE TO HIGH THREAT OF NEW ENTRANTS
- FIGURE 06. MODERATE THREAT OF SUBSTITUTES
- FIGURE 07. MODERATE INTENSITY OF RIVALRY
- FIGURE 08. HIGH BARGAINING POWER OF BUYERS
- FIGURE 09. GLOBAL UV-C LED MARKET:DRIVERS, RESTRAINTS AND OPPORTUNITIES
- FIGURE 10. UV-C LED MARKET, BY APPLICATION, 2022 AND 2032(%)
- FIGURE 11. COMPARATIVE SHARE ANALYSIS OF UV-C LED MARKET FOR WATER/AIR DISINFECTION, BY COUNTRY 2022 AND 2032(%)
- FIGURE 12. COMPARATIVE SHARE ANALYSIS OF UV-C LED MARKET FOR STERILIZATION, BY COUNTRY 2022 AND 2032(%)
- FIGURE 13. COMPARATIVE SHARE ANALYSIS OF UV-C LED MARKET FOR HEALTHCARE, BY COUNTRY 2022 AND 2032(%)
- FIGURE 14. COMPARATIVE SHARE ANALYSIS OF UV-C LED MARKET FOR INDUSTRIAL, BY COUNTRY 2022 AND 2032(%)
- FIGURE 15. COMPARATIVE SHARE ANALYSIS OF UV-C LED MARKET FOR SENSING, BY COUNTRY 2022 AND 2032(%)
- FIGURE 16. COMPARATIVE SHARE ANALYSIS OF UV-C LED MARKET FOR OTHERS, BY COUNTRY 2022 AND 2032(%)
- FIGURE 17. UV-C LED MARKET BY REGION, 2022 AND 2032(%)
- FIGURE 18. U.S. UV-C LED MARKET, 2022-2032 ($MILLION)
- FIGURE 19. CANADA UV-C LED MARKET, 2022-2032 ($MILLION)
- FIGURE 20. MEXICO UV-C LED MARKET, 2022-2032 ($MILLION)
- FIGURE 21. UK UV-C LED MARKET, 2022-2032 ($MILLION)
- FIGURE 22. GERMANY UV-C LED MARKET, 2022-2032 ($MILLION)
- FIGURE 23. FRANCE UV-C LED MARKET, 2022-2032 ($MILLION)
- FIGURE 24. REST OF EUROPE UV-C LED MARKET, 2022-2032 ($MILLION)
- FIGURE 25. CHINA UV-C LED MARKET, 2022-2032 ($MILLION)
- FIGURE 26. JAPAN UV-C LED MARKET, 2022-2032 ($MILLION)
- FIGURE 27. INDIA UV-C LED MARKET, 2022-2032 ($MILLION)
- FIGURE 28. SOUTH KOREA UV-C LED MARKET, 2022-2032 ($MILLION)
- FIGURE 29. REST OF ASIA-PACIFIC UV-C LED MARKET, 2022-2032 ($MILLION)
- FIGURE 30. LATIN AMERICA UV-C LED MARKET, 2022-2032 ($MILLION)
- FIGURE 31. MIDDLE EAST UV-C LED MARKET, 2022-2032 ($MILLION)
- FIGURE 32. AFRICA UV-C LED MARKET, 2022-2032 ($MILLION)
- FIGURE 33. TOP WINNING STRATEGIES, BY YEAR (2020-2023)
- FIGURE 34. TOP WINNING STRATEGIES, BY DEVELOPMENT (2020-2023)
- FIGURE 35. TOP WINNING STRATEGIES, BY COMPANY (2020-2023)
- FIGURE 36. PRODUCT MAPPING OF TOP 10 PLAYERS
- FIGURE 37. COMPETITIVE DASHBOARD
- FIGURE 38. COMPETITIVE HEATMAP: UV-C LED MARKET
- FIGURE 39. TOP PLAYER POSITIONING, 2022
- FIGURE 40. AMS OSRAM AG: NET REVENUE, 2020-2022 ($MILLION)
- FIGURE 41. AMS OSRAM AG: RESEARCH & DEVELOPMENT EXPENDITURE, 2020-2022 ($MILLION)
- FIGURE 42. AMS OSRAM AG: REVENUE SHARE BY REGION, 2022 (%)
- FIGURE 43. AMS OSRAM AG: REVENUE SHARE BY SEGMENT, 2022 (%)
- FIGURE 44. SIGNIFY HOLDING: NET REVENUE, 2020-2022 ($MILLION)
- FIGURE 45. SIGNIFY HOLDING: RESEARCH & DEVELOPMENT EXPENDITURE, 2020-2022 ($MILLION)
- FIGURE 46. SIGNIFY HOLDING: REVENUE SHARE BY SEGMENT, 2022 (%)
- FIGURE 47. SIGNIFY HOLDING: REVENUE SHARE BY REGION, 2022 (%)
- FIGURE 48. ASAHI KASEI CORPORATION: NET SALES, 2020-2022 ($MILLION)
- FIGURE 49. ASAHI KASEI CORPORATION: REVENUE SHARE BY SEGMENT, 2022 (%)
- FIGURE 50. ASAHI KASEI CORPORATION: REVENUE SHARE BY REGION, 2022 (%)
- FIGURE 51. DOWA HOLDINGS CO., LTD.: NET REVENUE, 2020-2021 ($MILLION)
- FIGURE 52. DOWA HOLDINGS CO., LTD.: REVENUE SHARE BY SEGMENT, 2021 (%)
- FIGURE 53. HONGQI TECHNOLOGY CO., LTD.: NET REVENUE, 2020-2022 ($MILLION)
- FIGURE 54. HONGQI TECHNOLOGY CO., LTD.: RESEARCH & DEVELOPMENT EXPENDITURE, 2020-2022 ($MILLION)
- FIGURE 55. HONGQI TECHNOLOGY CO., LTD.: REVENUE SHARE BY REGION, 2022 (%)
- FIGURE 56. HERAEUS HOLDING: NET REVENUE, 2020-2022 ($MILLION)
- FIGURE 57. HERAEUS HOLDING: REVENUE SHARE BY SEGMENT, 2022 (%)
- FIGURE 58. HERAEUS HOLDING: REVENUE SHARE BY REGION, 2022 (%)
- FIGURE 59. HIGH POWER LIGHTING CORP.: NET REVENUE, 2020-2022 ($MILLION)
- FIGURE 60. NIKKISO CO., LTD.: NET REVENUE, 2020-2022 ($MILLION)
- FIGURE 61. NIKKISO CO., LTD.: RESEARCH & DEVELOPMENT EXPENDITURE, 2020-2022 ($MILLION)
- FIGURE 62. NIKKISO CO., LTD.: REVENUE SHARE BY SEGMENT, 2022 (%)
- FIGURE 63. SEOUL VIOSYS CO., LTD.: SALES REVENUE, 2019-2021 ($MILLION)
- FIGURE 64. STANLEY ELECTRIC CO., LTD.: SALES REVENUE, 2022-2023 ($MILLION)
- FIGURE 65. STANLEY ELECTRIC CO., LTD.: REVENUE SHARE BY SEGMENT, 2022 (%)
- FIGURE 66. TOYODA GOSEI CO., LTD.: SALES REVENUE, 2020-2022 ($MILLION)
- FIGURE 67. TOYODA GOSEI CO., LTD.: REVENUE SHARE BY REGION, 2022 (%)
The UV-C LED market was valued at $0.38 billion in 2022 and is projected to reach $8.10 million by 2032, registering a CAGR of 36.6% from 2023 to 2032.
UV-C LED offers several advantages over the other traditional UV lamps. They are compact in size and can be easily integrated with different home appliances such as air conditioners, air purifiers or even washing machines. UV-C LEDs are often adopted for portable products. They can fully operate once turned on and do not need preheating while it takes about 10 to 30 minutes for mercury lamps to deliver the required UV dose for disinfection.
The rapid usage of UV-C LEDs for water filtration and their exceptional efficacy in disinfection are the main factors propelling the global UV-C LED market. Thermal management of UV-C LEDs, however, is a significant technological challenge that restricts industry expansion. However, during the projection period, UV-C LED integration with household appliances and consumer goods is anticipated to generate lucrative potential for market expansion. Other significant market growth drivers are improvements in output power and dependability as well as the recent unit cost price reduction for UV-C LEDs.
The UV-C LED market is segmented into application and region. On the basis of application, the market is classified into water/air disinfection, sterilization, healthcare, industrial, sensing, and others. In 2022, the water/air disinfection segment dominated the market, and the healthcare segment is expected to grow with the highest CAGR over the forecast period.
On the basis of region, the UV-C LED Market trends are analyzed across North America (the U.S., Canada, and Mexico), Europe (the UK, Germany, France, and rest of Europe), Asia-Pacific (China, Japan, India, South Korea, and rest of Asia-Pacific), and LAMEA (Latin America, Middle East, and Africa).
Competitive analysis and profiles of the major global UV-C LED market players that have been provided in the report include ams OSRAM; Crystal IS, Inc., Convergever Inc., Ltd., DOWA Holdings Co., Ltd, Harvatek Corporation, Heraeus Holding GmbH, High Power Lighting Corporation, IBT Group, International Light Technologies, Inc., IRTronix, Inc., Nichia Corporation, Nikkiso Co, Ltd., Nitride Semiconductor Co, Ltd., NKFG Corporation, Photon Wave Co., Ltd., Seoul Viosys Co, Ltd., Signify Holding, Stanley Electric Co, Ltd, Taoyuan Electron (HK) Limited, and Toyoda Gosei Co., Ltd. The key strategies adopted by the major players of the UV-C LED market are product launch, acquisition, and business expansion.
Key Benefits For Stakeholders
- This report provides a quantitative analysis of the market segments, current trends, estimations, and dynamics of the uv-c led market analysis from 2022 to 2032 to identify the prevailing uv-c led market opportunities.
- The market research is offered along with information related to key drivers, restraints, and opportunities.
- Porter's five forces analysis highlights the potency of buyers and suppliers to enable stakeholders make profit-oriented business decisions and strengthen their supplier-buyer network.
- In-depth analysis of the uv-c led market segmentation assists to determine the prevailing market opportunities.
- Major countries in each region are mapped according to their revenue contribution to the global market.
- Market player positioning facilitates benchmarking and provides a clear understanding of the present position of the market players.
- The report includes the analysis of the regional as well as global uv-c led market trends, key players, market segments, application areas, and market growth strategies.
Additional benefits you will get with this purchase are:
- Quarterly Update and* (only available with a corporate license, on listed price)
- 5 additional Company Profile of client Choice pre- or Post-purchase, as a free update.
- Free Upcoming Version on the Purchase of Five and Enterprise User License.
- 16 analyst hours of support* (post-purchase, if you find additional data requirements upon review of the report, you may receive support amounting to 16 analyst hours to solve questions, and post-sale queries)
- 15% Free Customization* (in case the scope or segment of the report does not match your requirements, 15% is equivalent to 3 working days of free work, applicable once)
- Free data Pack on the Five and Enterprise User License. (Excel version of the report)
- Free Updated report if the report is 6-12 months old or older.
- 24-hour priority response*
- Free Industry updates and white papers.
Possible Customization with this report (with additional cost and timeline, please talk to the sales executive to know more)
- Investment Opportunities
- New Product Development/ Product Matrix of Key Players
- Regulatory Guidelines
- Historic market data
- Key player details (including location, contact details, supplier/vendor network etc. in excel format)
- Market share analysis of players at global/region/country level
Key Market Segments
By Application
- Water/air disinfection
- Sterilization
- Healthcare
- Industrial
- Sensing
- Others
By Region
- North America
- U.S.
- Canada
- Mexico
- Europe
- UK
- Germany
- France
- Rest of Europe
- Asia-Pacific
- China
- Japan
- India
- South Korea
- Rest of Asia-Pacific
- LAMEA
- Latin America
- Middle East
- Africa
Key Market Players:
- Convergever Inc., Ltd.
- Signify Holding
- Asahi Kasei Corporation
- NKFG Corporation
- ams OSRAM AG
- Taoyuan Electron (HK) Limited
- Photon Wave Co., Ltd.
- Toyoda Gosei Co., Ltd.
- Seoul Viosys Co., Ltd.
- IRTronix, Inc
- Hongqi Technology Co., Ltd.
- Heraeus Holding
- Stanley Electric Co., Ltd.
- INTERNATIONAL LIGHT TECHNOLOGIES INC.
- Nichia Corporation
- DOWA Holdings Co., Ltd.
- High Power Lighting Corp.
- IBT group. (Ivy Bridge Technology)
- Nikkiso Co., Ltd.
- Nitride Semiconductors Co., Ltd.
TABLE OF CONTENTS
CHAPTER 1: INTRODUCTION
- 1.1. Report description
- 1.2. Key market segments
- 1.3. Key benefits to the stakeholders
- 1.4. Research Methodology
- 1.4.1. Primary research
- 1.4.2. Secondary research
- 1.4.3. Analyst tools and models
CHAPTER 2: EXECUTIVE SUMMARY
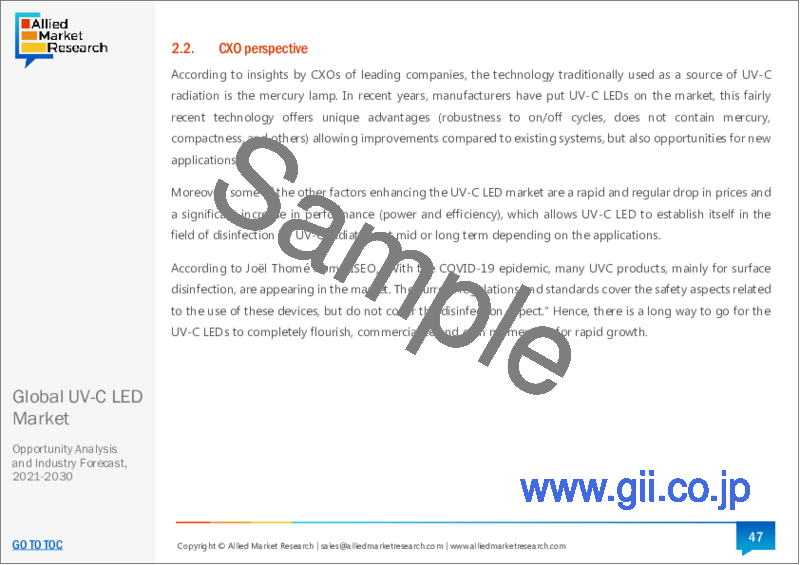
- 2.1. CXO Perspective
CHAPTER 3: MARKET OVERVIEW
- 3.1. Market definition and scope
- 3.2. Key findings
- 3.2.1. Top impacting factors
- 3.2.2. Top investment pockets
- 3.3. Porter's five forces analysis
- 3.3.1. High bargaining power of suppliers
- 3.3.2. Moderate to high threat of new entrants
- 3.3.3. Moderate threat of substitutes
- 3.3.4. Moderate intensity of rivalry
- 3.3.5. High bargaining power of buyers
- 3.4. Market dynamics
- 3.4.1. Drivers
- 3.4.1.1. UV-C LED is highly effective for disinfection
- 3.4.1.2. Surge in adoption for water purification
- 3.4.2. Restraints
- 3.4.2.1. Thermal management of UV-C LED is a concern
- 3.4.3. Opportunities
- 3.4.3.1. Integration with home appliances and consumer products
- 3.4.1. Drivers
CHAPTER 4: UV-C LED MARKET, BY APPLICATION
- 4.1. Overview
- 4.1.1. Market size and forecast
- 4.2. Water/air disinfection
- 4.2.1. Key market trends, growth factors and opportunities
- 4.2.2. Market size and forecast, by region
- 4.2.3. Market share analysis by country
- 4.3. Sterilization
- 4.3.1. Key market trends, growth factors and opportunities
- 4.3.2. Market size and forecast, by region
- 4.3.3. Market share analysis by country
- 4.4. Healthcare
- 4.4.1. Key market trends, growth factors and opportunities
- 4.4.2. Market size and forecast, by region
- 4.4.3. Market share analysis by country
- 4.5. Industrial
- 4.5.1. Key market trends, growth factors and opportunities
- 4.5.2. Market size and forecast, by region
- 4.5.3. Market share analysis by country
- 4.6. Sensing
- 4.6.1. Key market trends, growth factors and opportunities
- 4.6.2. Market size and forecast, by region
- 4.6.3. Market share analysis by country
- 4.7. Others
- 4.7.1. Key market trends, growth factors and opportunities
- 4.7.2. Market size and forecast, by region
- 4.7.3. Market share analysis by country
CHAPTER 5: UV-C LED MARKET, BY REGION
- 5.1. Overview
- 5.1.1. Market size and forecast By Region
- 5.2. North America
- 5.2.1. Key market trends, growth factors and opportunities
- 5.2.2. Market size and forecast, by Application
- 5.2.3. Market size and forecast, by country
- 5.2.3.1. U.S.
- 5.2.3.1.1. Market size and forecast, by Application
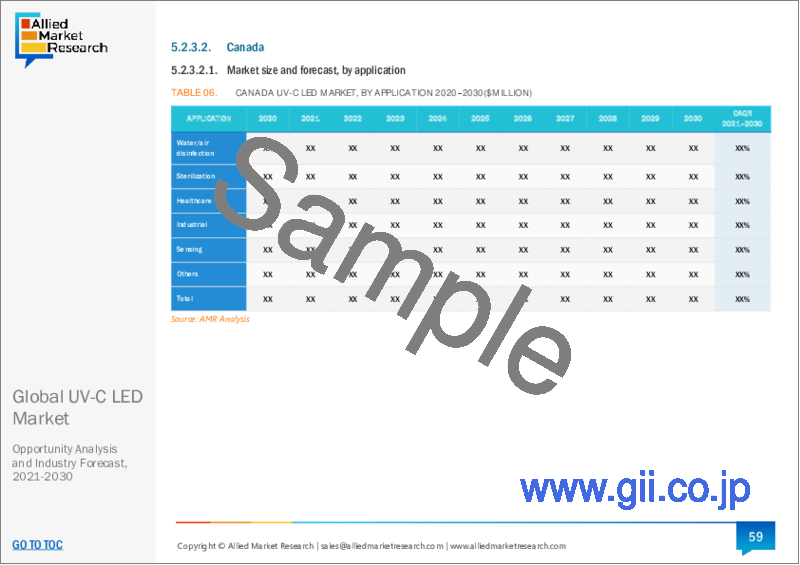
- 5.2.3.2. Canada
- 5.2.3.2.1. Market size and forecast, by Application
- 5.2.3.3. Mexico
- 5.2.3.3.1. Market size and forecast, by Application
- 5.3. Europe
- 5.3.1. Key market trends, growth factors and opportunities
- 5.3.2. Market size and forecast, by Application
- 5.3.3. Market size and forecast, by country
- 5.3.3.1. UK
- 5.3.3.1.1. Market size and forecast, by Application
- 5.3.3.2. Germany
- 5.3.3.2.1. Market size and forecast, by Application
- 5.3.3.3. France
- 5.3.3.3.1. Market size and forecast, by Application
- 5.3.3.4. Rest of Europe
- 5.3.3.4.1. Market size and forecast, by Application
- 5.4. Asia-Pacific
- 5.4.1. Key market trends, growth factors and opportunities
- 5.4.2. Market size and forecast, by Application
- 5.4.3. Market size and forecast, by country
- 5.4.3.1. China
- 5.4.3.1.1. Market size and forecast, by Application
- 5.4.3.2. Japan
- 5.4.3.2.1. Market size and forecast, by Application
- 5.4.3.3. India
- 5.4.3.3.1. Market size and forecast, by Application
- 5.4.3.4. South Korea
- 5.4.3.4.1. Market size and forecast, by Application
- 5.4.3.5. Rest of Asia-Pacific
- 5.4.3.5.1. Market size and forecast, by Application
- 5.5. LAMEA
- 5.5.1. Key market trends, growth factors and opportunities
- 5.5.2. Market size and forecast, by Application
- 5.5.3. Market size and forecast, by country
- 5.5.3.1. Latin America
- 5.5.3.1.1. Market size and forecast, by Application
- 5.5.3.2. Middle East
- 5.5.3.2.1. Market size and forecast, by Application
- 5.5.3.3. Africa
- 5.5.3.3.1. Market size and forecast, by Application
CHAPTER 6: COMPETITIVE LANDSCAPE
- 6.1. Introduction
- 6.2. Top winning strategies
- 6.3. Product Mapping of Top 10 Player
- 6.4. Competitive Dashboard
- 6.5. Competitive Heatmap
- 6.6. Top player positioning, 2022
CHAPTER 7: COMPANY PROFILES
- 7.1. ams OSRAM AG
- 7.1.1. Company overview
- 7.1.2. Key Executives
- 7.1.3. Company snapshot
- 7.1.4. Operating business segments
- 7.1.5. Product portfolio
- 7.1.6. Business performance
- 7.1.7. Key strategic moves and developments
- 7.2. Nichia Corporation
- 7.2.1. Company overview
- 7.2.2. Key Executives
- 7.2.3. Company snapshot
- 7.2.4. Operating business segments
- 7.2.5. Product portfolio
- 7.2.6. Key strategic moves and developments
- 7.3. NKFG Corporation
- 7.3.1. Company overview
- 7.3.2. Key Executives
- 7.3.3. Company snapshot
- 7.3.4. Operating business segments
- 7.3.5. Product portfolio
- 7.4. Signify Holding
- 7.4.1. Company overview
- 7.4.2. Key Executives
- 7.4.3. Company snapshot
- 7.4.4. Operating business segments
- 7.4.5. Product portfolio
- 7.4.6. Business performance
- 7.4.7. Key strategic moves and developments
- 7.5. Taoyuan Electron (HK) Limited
- 7.5.1. Company overview
- 7.5.2. Key Executives
- 7.5.3. Company snapshot
- 7.5.4. Operating business segments
- 7.5.5. Product portfolio
- 7.5.6. Key strategic moves and developments
- 7.6. Asahi Kasei Corporation
- 7.6.1. Company overview
- 7.6.2. Key Executives
- 7.6.3. Company snapshot
- 7.6.4. Operating business segments
- 7.6.5. Product portfolio
- 7.6.6. Business performance
- 7.6.7. Key strategic moves and developments
- 7.7. Convergever Inc., Ltd.
- 7.7.1. Company overview
- 7.7.2. Key Executives
- 7.7.3. Company snapshot
- 7.7.4. Operating business segments
- 7.7.5. Product portfolio
- 7.8. DOWA Holdings Co., Ltd.
- 7.8.1. Company overview
- 7.8.2. Key Executives
- 7.8.3. Company snapshot
- 7.8.4. Operating business segments
- 7.8.5. Product portfolio
- 7.8.6. Business performance
- 7.9. Hongqi Technology Co., Ltd.
- 7.9.1. Company overview
- 7.9.2. Key Executives
- 7.9.3. Company snapshot
- 7.9.4. Operating business segments
- 7.9.5. Product portfolio
- 7.9.6. Business performance
- 7.10. Heraeus Holding
- 7.10.1. Company overview
- 7.10.2. Key Executives
- 7.10.3. Company snapshot
- 7.10.4. Operating business segments
- 7.10.5. Product portfolio
- 7.10.6. Business performance
- 7.10.7. Key strategic moves and developments
- 7.11. High Power Lighting Corp.
- 7.11.1. Company overview
- 7.11.2. Key Executives
- 7.11.3. Company snapshot
- 7.11.4. Operating business segments
- 7.11.5. Product portfolio
- 7.11.6. Business performance
- 7.12. IBT group. (Ivy Bridge Technology)
- 7.12.1. Company overview
- 7.12.2. Key Executives
- 7.12.3. Company snapshot
- 7.12.4. Operating business segments
- 7.12.5. Product portfolio
- 7.13. INTERNATIONAL LIGHT TECHNOLOGIES INC.
- 7.13.1. Company overview
- 7.13.2. Key Executives
- 7.13.3. Company snapshot
- 7.13.4. Operating business segments
- 7.13.5. Product portfolio
- 7.14. IRTronix, Inc
- 7.14.1. Company overview
- 7.14.2. Key Executives
- 7.14.3. Company snapshot
- 7.14.4. Operating business segments
- 7.14.5. Product portfolio
- 7.15. Nikkiso Co., Ltd.
- 7.15.1. Company overview
- 7.15.2. Key Executives
- 7.15.3. Company snapshot
- 7.15.4. Operating business segments
- 7.15.5. Product portfolio
- 7.15.6. Business performance
- 7.15.7. Key strategic moves and developments
- 7.16. Photon Wave Co., Ltd.
- 7.16.1. Company overview
- 7.16.2. Key Executives
- 7.16.3. Company snapshot
- 7.16.4. Operating business segments
- 7.16.5. Product portfolio
- 7.17. Seoul Viosys Co., Ltd.
- 7.17.1. Company overview
- 7.17.2. Key Executives
- 7.17.3. Company snapshot
- 7.17.4. Operating business segments
- 7.17.5. Product portfolio
- 7.17.6. Business performance
- 7.17.7. Key strategic moves and developments
- 7.18. Stanley Electric Co., Ltd.
- 7.18.1. Company overview
- 7.18.2. Key Executives
- 7.18.3. Company snapshot
- 7.18.4. Operating business segments
- 7.18.5. Product portfolio
- 7.18.6. Business performance
- 7.18.7. Key strategic moves and developments
- 7.19. Toyoda Gosei Co., Ltd.
- 7.19.1. Company overview
- 7.19.2. Key Executives
- 7.19.3. Company snapshot
- 7.19.4. Operating business segments
- 7.19.5. Product portfolio
- 7.19.6. Business performance
- 7.19.7. Key strategic moves and developments
- 7.20. Nitride Semiconductors Co., Ltd.
- 7.20.1. Company overview
- 7.20.2. Key Executives
- 7.20.3. Company snapshot
- 7.20.4. Operating business segments
- 7.20.5. Product portfolio
