|
|
市場調査レポート
商品コード
1554002
UV LEDの市場規模、シェア、動向分析レポート:技術別、出力別、用途別、最終用途別、地域別、セグメント予測、2024年~2030年UV LED Market Size, Share, & Trends Analysis Report By Technology (UV-A, UV-B), By Power Output (Less than 1W, 1W -5W), By Application (UV Curing, Medical Light Therapy), By End Use (Industrial, Commercial), By Region, And Segment Forecasts, 2024 - 2030 |
||||||
|
|||||||
カスタマイズ可能
|
|||||||

| UV LEDの市場規模、シェア、動向分析レポート:技術別、出力別、用途別、最終用途別、地域別、セグメント予測、2024年~2030年 |
|
出版日: 2024年08月05日
発行: Grand View Research
ページ情報: 英文 120 Pages
納期: 2~10営業日
|

全表示
- 概要
- 図表
- 目次
UV LEDの市場規模と動向:
UV LED市場規模は、2023年に13億6,000万米ドルと推定され、2024~2030年にCAGR 24.6%で成長すると予測されています。
市場成長の原動力は、エネルギー効率が高く環境に優しい照明ソリューションに対する需要の高まりであり、殺菌や滅菌など様々なアプリケーションでUV LEDの採用が増加しています。
水銀ベースのUVランプの有害な影響に対する意識の高まりが、水銀フリーで長寿命、低エネルギー消費のUV LED技術へのシフトを加速しています。さらに、UV LED技術の進歩により、性能とコスト効率が向上し、市場の成長をさらに促進しています。
UV LEDは従来のUVランプに比べて消費電力が大幅に少ないため、殺菌、医療機器、浄水など幅広い用途で魅力的な選択肢となっています。省エネに対する意識の高まりと持続可能な技術へのニーズがUV LEDの採用をさらに後押ししています。例えば2023年10月、米国のUV殺菌技術メーカーであるUltraViolet Devices, Inc.(UVDI)は、新しいUV LED Surface Sanitizer「UVDI-GO」をヘルスケア環境で世界的に販売開始すると発表しました。UVDI-GOは、一般的なヘルスケア関連微生物を20秒以内に不活性化する99.99%以上の効果を示しています。その迅速な作用、表面への安全な塗布、携帯性により、訓練を受けたヘルスケア専門家が効率的に表面を除菌することができます。
また、UV LED技術の進歩や革新も市場成長を後押ししています。メーカーはUV LEDの性能、効率、寿命を継続的に改善しており、コスト効率と信頼性を高めています。新材料の開発と製造プロセスの改善により、より高い出力と優れた熱管理を備えたUV LEDの生産が可能になった。これらの進歩により、UV LEDは工業用硬化プロセスや高度製造業など、より要求の厳しい用途で使用できるようになり、市場の可能性が拡大しています。例えば、日本のLEDメーカーである日亜化学工業は2023年5月、微生物の不活性化を含むUV感度を評価するための新しいLED照射装置を発表しました。この革新的な装置は、LEDの電気的・熱的特性、ターゲット表面の放射照度、放射照度分布、照射時間、ビーム角度、隣接する材料からの反射、サンプルの温度などを考慮し、UV感度を正確かつ一貫して評価できるように設計されています。
さらに、規制当局の支援の増加と環境安全性に関する厳しい政府規制が、市場にプラスの影響を与えています。従来の水銀ベースのUVランプは、水銀含有により環境と健康に悪影響を及ぼします。世界中の規制機関がこうした水銀ベースのランプを段階的に廃止しており、より安全で環境に優しい代替品としてUV LEDの採用を奨励しています。このような規制の後押しがUV LEDメーカーに新たな機会を生み出し、市場拡大を後押ししています。例えば、カナダのSOR/2024-109 Regulations Amending the Products Containing Mercury Regulationsは、害虫駆除製品などの例外を除き、ほとんどの水銀含有製品の製造と輸入を禁止することで、環境と人体への水銀暴露リスクを低減することを目的としています。2025年6月19日に施行される本改正は、一般的な水銀含有ランプを段階的に廃止することにより、カナダの水銀含有ランプに関する国家戦略を支援するものです。一般照明用の水銀ランプについては、今後数年間で新たな禁止措置が実施される予定です。
COVID-19のパンデミックは、効果的な滅菌・消毒技術の重要性を浮き彫りにし、UV LEDベースのソリューションに対する需要の急増につながった。UV LEDは医療機器、空気、表面の殺菌に使用され、病原体を除去する化学薬品を使わない方法を提供します。このため、ヘルスケア環境におけるUV LED製品の開発と展開が加速し、市場成長に大きく寄与しています。
目次
第1章 調査手法と範囲
第2章 エグゼクティブサマリー
第3章 UV LEDの変数、動向、範囲
- 市場イントロダクション/系統展望
- 業界バリューチェーン分析
- 市場力学
- 市場促進要因分析
- 市場抑制要因分析
- 業界の機会
- UV LED分析ツール
- ポーターのファイブフォース分析
- PESTEL分析
第4章 UV LED:技術別推定・動向分析
- セグメントダッシュボード
- UV LED:技術別変動分析、2023年および2030年
- UV-A
- 市場規模の推定と予測、2018~2030年
- UV-B
- 市場規模の推定と予測、2018~2030年
- UV-C
- 市場規模の推定と予測、2018~2030年
第5章 UV LED:出力別推定・動向分析
- セグメントダッシュボード
- UV LED:出力別変動分析、2023年および2030年
- 1W未満
- 市場規模の推定と予測、2018~2030年
- 1W-5W
- 市場規模の推定と予測、2018~2030年
- 5W以上
- 市場規模の推定と予測、2018~2030年
第6章 UV LED:用途別推定・動向分析
- セグメントダッシュボード
- UV LED:用途別変動分析、2023年および2030年
- UV硬化
- 市場規模の推定と予測、2018~2030年
- 医療用光線療法
- 市場規模の推定と予測、2018~2030年
- 消毒・殺菌
- 市場規模の推定と予測、2018~2030年
- 偽造品検出
- 市場規模の推定と予測、2018~2030年
- 光学センシングと計測
- 市場規模の推定と予測、2018~2030年
- その他
- 市場規模の推定と予測、2018~2030年
第7章 UV LED:最終用途の推定・動向分析
- セグメントダッシュボード
- UV LED:最終用途変動分析、2023年および2030年
- 産業
- 市場規模の推定と予測、2018年-2030年
- 商業
- 市場規模の推定と予測、2018年-2030年
- 住宅
- 市場規模の推定と予測、2018年-2030年
- 農業
- 市場規模の推定と予測、2018年-2030年
- ヘルスケア
- 市場規模の推定と予測、2018年-2030年
第8章 UV LED市場:地域推定・動向分析
- UV LED市場シェア、地域別、2023年および2030年
- 北米
- 技術別、2018-2030年
- 出力別、2018-2030年
- 用途別、2018-2030
- 最終用途別、2018-2030年
- 米国
- カナダ
- メキシコ
- 欧州
- 技術別、2018-2030年
- 出力別、2018-2030年
- 用途別、2018-2030
- 最終用途別、2018-2030年
- 英国
- ドイツ
- フランス
- アジア太平洋
- 技術別、2018-2030年
- 出力別、2018-2030年
- 用途別、2018-2030
- 最終用途別、2018-2030年
- 中国
- インド
- 日本
- オーストラリア
- 韓国
- ラテンアメリカ
- 技術別、2018-2030年
- 出力別、2018-2030年
- 用途別、2018-2030
- 最終用途別、2018-2030年
- ブラジル
- 中東・アフリカ
- アラブ首長国連邦
- サウジアラビア王国
- 南アフリカ
第9章 競合情勢
- 主要市場参入企業による最近の動向と影響分析
- 企業分類
- 企業の市場シェア分析
- 企業ヒートマップ分析
- 戦略マッピング
- 拡大
- 合併と買収
- パートナーシップとコラボレーション
- 新製品の発売
- 研究開発
- 企業プロファイル
- Advanced Optoelectronic Technology, Inc.
- Crystal IS, Inc.
- EPISTAR Corporation
- Excelitas Noblelight
- LG Innotek
- Lumileds Holding BV
- NICHIA CORPORATION
- ams-OSRAM AG
- Phoseon Technology
- Semileds Corporation
- Sensor Electronic Technology, Inc.(SETi)
- Seoul Viosys Co., Ltd.
- STANLEY ELECTRIC CO., LTD.
- Ushio, Inc.
- Violumas
List of Tables
- Table 1 UV LED market (USD Billion), 2018 - 2030
- Table 2 Global UV LED market estimates and forecasts by region, (USD Billion), 2018 - 2030
- Table 3 Global UV LED market estimates and forecasts by technology, (USD Billion), 2018 - 2030
- Table 4 Global UV LED market estimates and forecasts by power output, (USD Billion), 2018 - 2030
- Table 5 Global UV LED market estimates and forecasts by application, (USD Billion), 2018 - 2030
- Table 6 Global UV LED market estimates and forecasts by end use, (USD Billion), 2018 - 2030
- Table 7 North America UV LED market, by technology, 2018 - 2030, (Revenue, USD Billion)
- Table 8 North America UV LED market, by power output, 2018 - 2030, (Revenue, USD Billion)
- Table 9 North America UV LED market, by end use, 2018 - 2030, (Revenue, USD Billion)
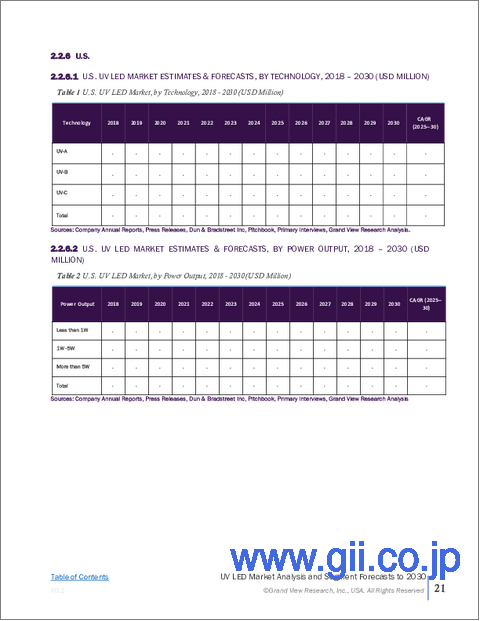
- Table 10 U.S. UV LED market, by technology, 2018 - 2030, (Revenue, USD Billion)
- Table 11 U.S. UV LED market, by power output, 2018 - 2030, (Revenue, USD Billion)
- Table 12 U.S. UV LED market, by application, 2018 - 2030, (Revenue, USD Billion)
- Table 13 U.S. UV LED market, by end use, 2018 - 2030, (Revenue, USD Billion)
- Table 14 Canada UV LED market, by technology, 2018 - 2030, (Revenue, USD Billion)
- Table 15 Canada UV LED market, by power output, 2018 - 2030, (Revenue, USD Billion)
- Table 16 Canada UV LED market, by application, 2018 - 2030, (Revenue, USD Billion)
- Table 17 Canada UV LED market, by end use, 2018 - 2030, (Revenue, USD Billion)
- Table 18 Mexico UV LED market, by technology, 2018 - 2030, (Revenue, USD Billion)
- Table 19 Mexico UV LED market, by power output, 2018 - 2030, (Revenue, USD Billion)
- Table 20 Mexico UV LED market, by application, 2018 - 2030, (Revenue, USD Billion)
- Table 21 Mexico UV LED market, by end use, 2018 - 2030, (Revenue, USD Billion)
- Table 22 Europe UV LED market, by technology, 2018 - 2030, (Revenue, USD Billion)
- Table 23 Europe UV LED market, by power output, 2018 - 2030, (Revenue, USD Billion)
- Table 24 Europe UV LED market, by application, 2018 - 2030, (Revenue, USD Billion)
- Table 25 Europe UV LED market, by end use, 2018 - 2030, (Revenue, USD Billion)
- Table 26 U.K. UV LED market, by technology, 2018 - 2030, (Revenue, USD Billion)
- Table 27 U.K. UV LED market, by power output, 2018 - 2030, (Revenue, USD Billion)
- Table 28 U.K. UV LED market, by application, 2018 - 2030, (Revenue, USD Billion)
- Table 29 U.K. UV LED market, by end use, 2018 - 2030, (Revenue, USD Billion)
- Table 30 Germany UV LED market, by technology, 2018 - 2030, (Revenue, USD Billion)
- Table 31 Germany UV LED market, by power output, 2018 - 2030, (Revenue, USD Billion)
- Table 32 Germany UV LED market, by application, 2018 - 2030, (Revenue, USD Billion)
- Table 33 Germany UV LED market, by end use, 2018 - 2030, (Revenue, USD Billion)
- Table 34 France UV LED market, by technology, 2018 - 2030, (Revenue, USD Billion)
- Table 35 France UV LED market, by power output, 2018 - 2030, (Revenue, USD Billion)
- Table 36 France UV LED market, by application, 2018 - 2030, (Revenue, USD Billion)
- Table 37 France UV LED market, by end use, 2018 - 2030, (Revenue, USD Billion)
- Table 38 Asia Pacific UV LED market, by technology, 2018 - 2030, (Revenue, USD Billion)
- Table 39 Asia Pacific UV LED market, by power output, 2018 - 2030, (Revenue, USD Billion)
- Table 40 Asia Pacific UV LED market, by application, 2018 - 2030, (Revenue, USD Billion)
- Table 41 Asia Pacific UV LED market, by end use, 2018 - 2030, (Revenue, USD Billion)
- Table 42 China UV LED market, by technology, 2018 - 2030, (Revenue,USD Billion)
- Table 43 China UV LED market, by power output, 2018 - 2030, (Revenue, USD Billion)
- Table 44 China UV LED market, by application, 2018 - 2030, (Revenue, USD Billion)
- Table 45 China UV LED market, by end use, 2018 - 2030, (Revenue, USD Billion)
- Table 46 India management market, by technology, 2018 - 2030, (Revenue, USD Billion)
- Table 47 India UV LED market, by power output, 2018 - 2030, (Revenue, USD Billion)
- Table 48 India UV LED market, by application, 2018 - 2030, (Revenue, USD Billion)
- Table 49 India UV LED market, by end use, 2018 - 2030, (Revenue, USD Billion)
- Table 50 Japan UV LED market, by technology, 2018 - 2030, (Revenue, USD Billion)
- Table 51 Japan UV LED market, by power output, 2018 - 2030, (Revenue, USD Billion)
- Table 52 Japan UV LED market, by application, 2018 - 2030, (Revenue, USD Billion)
- Table 53 Japan UV LED market, by end use, 2018 - 2030, (Revenue, USD Billion)
- Table 54 Australia UV LED market, by technology, 2018 - 2030, (Revenue, USD Billion)
- Table 55 Australia UV LED market, by power output, 2018 - 2030, (Revenue, USD Billion)
- Table 56 Australia UV LED market, by application, 2018 - 2030, (Revenue, USD Billion)
- Table 57 Australia UV LED market, by end use, 2018 - 2030, (Revenue, USD Billion)
- Table 58 South Korea UV LED market, by technology, 2018 - 2030, (Revenue, USD Billion)
- Table 59 South Korea UV LED market, by power output, 2018 - 2030, (Revenue, USD Billion)
- Table 60 South Korea UV LED market, by application, 2018 - 2030, (Revenue, USD Billion)
- Table 61 South Korea UV LED market, by end use, 2018 - 2030, (Revenue, USD Billion)
- Table 62 Latin America UV LED market, by technology, 2018 - 2030, (Revenue, USD Billion)
- Table 63 Latin America UV LED market, by power output, 2018 - 2030, (Revenue, USD Billion)
- Table 64 Latin America UV LED market, by application, 2018 - 2030, (Revenue, USD Billion)
- Table 65 Latin America UV LED market, by end use, 2018 - 2030, (Revenue, USD Billion)
- Table 66 Brazil UV LED market, by technology, 2018 - 2030, (Revenue, USD Billion)
- Table 67 Brazil UV LED market, by power output, 2018 - 2030, (Revenue, USD Billion)
- Table 68 Brazil UV LED market, by application, 2018 - 2030, (Revenue, USD Billion)
- Table 69 Brazil UV LED market, by end use, 2018 - 2030, (Revenue, USD Billion)
- Table 70 MEA UV LED market, by technology, 2018 - 2030, (Revenue, USD Billion)
- Table 71 MEA UV LED market, by power output, 2018 - 2030, (Revenue, USD Billion)
- Table 72 MEA UV LED market, by application, 2018 - 2030, (Revenue, USD Billion)
- Table 73 MEA UV LED market, by end use, 2018 - 2030, (Revenue, USD Billion)
- Table 74 UAE UV LED market, by technology, 2018 - 2030, (Revenue, USD Billion)
- Table 75 UAE UV LED market, by power output, 2018 - 2030, (Revenue, USD Billion)
- Table 76 UAE UV LED market, by application, 2018 - 2030, (Revenue, USD Billion)
- Table 77 UAE UV LED market, by end use, 2018 - 2030, (Revenue, USD Billion)
- Table 78 Kingdom of Saudi Arabia UV LED market, by technology, 2018 - 2030, (Revenue, USD Billion)
- Table 79 Kingdom of Saudi Arabia UV LED market, by power output, 2018 - 2030, (Revenue, USD Billion)
- Table 80 Kingdom of Saudi Arabia UV LED market, by application, 2018 - 2030, (Revenue, USD Billion)
- Table 81 Kingdom of Saudi Arabia UV LED market, by end use, 2018 - 2030, (Revenue, USD Billion)
- Table 82 South Africa UV LED market, by technology, 2018 - 2030, (Revenue, USD Billion)
- Table 83 South Africa UV LED market, by power output, 2018 - 2030, (Revenue, USD Billion)
- Table 84 South Africa UV LED market, by application, 2018 - 2030, (Revenue, USD Billion)
- Table 85 South Africa UV LED market, by end use, 2018 - 2030, (Revenue, USD Billion)
List of Figures
- Fig. 1 UV LED Market Segmentation
- Fig. 2 Market landscape
- Fig. 3 Information Procurement
- Fig. 4 Data Analysis Models
- Fig. 5 Market Formulation and Validation
- Fig. 6 Data Validating & Publishing
- Fig. 7 Market Snapshot
- Fig. 8 Segment Snapshot (1/3)
- Fig. 9 Segment Snapshot (2/3)
- Fig. 10 Competitive Landscape Snapshot
- Fig. 11 UV LED: Industry Value Chain Analysis
- Fig. 12 UV LED: Market Dynamics
- Fig. 13 UV LED: Porter's Five Forces Analysis
- Fig. 14 UV LED: PESTEL Analysis
- Fig. 15 UV LED Share by Technology, 2023 & 2030 (USD Billion)
- Fig. 16 UV-A Market Estimates and Forecasts, 2018 - 2030, (Revenue, USD Billion)
- Fig. 17 UV-B Market Estimates and Forecasts, 2018 - 2030, (Revenue, USD Billion)
- Fig. 18 UV LED, by Technology: Market Share, 2023 & 2030
- Fig. 19 UV-C Market Estimates and Forecasts, 2018 - 2030, (Revenue, USD Billion)
- Fig. 20 UV LED Share by Power Output, 2023 & 2030 (USD Billion)
- Fig. 21 UV LED Market, by Power Output: Market Share, 2023 & 2030
- Fig. 22 Less than 1W Market Estimates and Forecasts, 2018 - 2030, (Revenue, USD Billion)
- Fig. 23 1W -5W Market Estimates and Forecasts, 2018 - 2030, (Revenue, USD Billion)
- Fig. 24 More than 5W Market Estimates and Forecasts, 2018 - 2030, (Revenue, USD Billion)
- Fig. 25 UV LED Share by Application, 2023 & 2030 (USD Billion)
- Fig. 26 UV LED Market, by Application: Market Share, 2023 & 2030
- Fig. 27 UV curing Market Estimates and Forecasts, 2018 - 2030, (Revenue, USD Billion)
- Fig. 28 Medical light therapy Market Estimates and Forecasts, 2018 - 2030, (Revenue, USD Billion)
- Fig. 29 Disinfection & sterilization Market Estimates and Forecasts, 2018 - 2030, (Revenue, USD Billion)
- Fig. 30 Counterfeit detection Market Estimates and Forecasts, 2018 - 2030, (Revenue, USD Billion)
- Fig. 31 Optical sensing & instrumentation Market Estimates and Forecasts, 2018 - 2030, (Revenue, USD Billion)
- Fig. 32 Others Market Estimates and Forecasts, 2018 - 2030, (Revenue, USD Billion)
- Fig. 33 UV LED Share by End Use, 2023 & 2030 (USD Billion)
- Fig. 34 UV LED, by End Use: Market Share, 2023 & 2030
- Fig. 35 Industrial Market Estimates and Forecasts, 2018 - 2030, (Revenue, USD Billion)
- Fig. 36 Commercial Market Estimates and Forecasts, 2018 - 2030, (Revenue, USD Billion)
- Fig. 37 Residential Market Estimates and Forecasts, 2018 - 2030, (Revenue, USD Billion)
- Fig. 38 Agriculture Market Estimates and Forecasts, 2018 - 2030, (Revenue, USD Billion)
- Fig. 39 Regional Market place: Key Takeaways
- Fig. 40 North America UV LED Market Estimates and Forecasts, 2018 - 2030, (USD Billion)
- Fig. 41 U.S. UV LED Market Estimates and Forecasts, 2018 - 2030, (USD Billion)
- Fig. 42 Canada UV LED Market Estimates and Forecasts, 2018 - 2030, (USD Billion)
- Fig. 43 Mexico UV LED Market Estimates and Forecasts, 2018 - 2030, (USD Billion)
- Fig. 44 Europe UV LED Market Estimates and Forecasts, 2018 - 2030, (USD Billion)
- Fig. 45 U.K. UV LED Market Estimates and Forecasts, 2018 - 2030,) (USD Billion)
- Fig. 46 Germany UV LED Market Estimates and Forecasts, (2018 - 2030,) (USD Billion)
- Fig. 47 France UV LED Market Estimates and Forecasts, (2018 - 2030,) (USD Billion)
- Fig. 48 Asia Pacific UV LED Market Estimates and Forecast, 2018 - 2030 (USD Billion)
- Fig. 49 China UV LED Market Estimates and Forecasts, 2018 - 2030, (USD Billion)
- Fig. 50 India UV LED Market Estimates and Forecasts, 2018 - 2030, (USD Billion)
- Fig. 51 Japan UV LED Market Estimates and Forecasts, 2018 - 2030, (USD Billion)
- Fig. 52 Australia UV LED Market Estimates and Forecasts, 2018 - 2030, (USD Billion)
- Fig. 53 South Korea UV LED Market Estimates and Forecasts, 2018 - 2030, (USD Billion)
- Fig. 54 Latin America UV LED Market Estimates and Forecasts, 2018 - 2030, (USD Billion)
- Fig. 55 Brazil UV LED Market Estimates and Forecasts, 2018 - 2030, (USD Billion)
- Fig. 56 MEA UV LED Market Estimates and Forecasts, 2018 - 2030 (USD Billion)
- Fig. 57 Kingdom of Saudi Arabia UV LED Market Estimates and Forecasts, 2018 - 2030 (USD Billion)
- Fig. 58 UAE UV LED Market Estimates and Forecasts, 2018 - 2030 (USD Billion)
- Fig. 59 South Africa UV LED Market Estimates and Forecasts, 2018 - 2030 (USD Billion)
- Fig. 60 Key Company Categorization
- Fig. 61 Company Market Positioning
- Fig. 62 Key Company Market Share Analysis, 2023
- Fig. 63 Strategic Framework
UV LED Market Size & Trends:
The UV LED market size was estimated at USD 1.36 billion in 2023 and is anticipated to grow at a CAGR of 24.6% from 2024 to 2030. The growth of the market is driven by the rising demand for energy-efficient and environmentally friendly lighting solutions, along with the increasing adoption of UV LEDs in various applications such as disinfection and sterilization.
The growing awareness of the harmful effects of mercury-based UV lamps has accelerated the shift towards UV LED technology, which is mercury-free and offers longer lifespan and lower energy consumption. Additionally, advancements in UV LED technology, resulting in improved performance and cost-effectiveness, have further fueled market growth.
UV LEDs consume significantly less power compared to traditional UV lamps, making them an attractive option for a wide range of applications, including sterilization, medical devices, and water purification. The growing awareness of energy conservation and the need for sustainable technologies further boost the adoption of UV LEDs. For instance, in October 2023, UltraViolet Devices, Inc. (UVDI), a U.S.-based UV disinfection technology producer, announced the global availability of the new UVDI-GO UV LED Surface Sanitizer in healthcare settings. The UVDI-GO has shown over 99.99% effectiveness in deactivating common healthcare-associated microorganisms, from surfaces within 20 seconds. Its rapid action, safe application on surfaces, and portability allow trained healthcare professionals to sanitize surfaces efficiently.
Technological advancements and innovations in UV LED technology are also propelling market growth. Manufacturers are continuously improving the performance, efficiency, and lifespan of UV LEDs, making them more cost-effective and reliable. The development of new materials and improved manufacturing processes has led to the production of UV LEDs with higher power outputs and better thermal management. These advancements enable UV LEDs to be used in more demanding applications, such as industrial curing processes and advanced manufacturing, expanding their market potential. For instance, in May 2023, NICHIA CORPORATION, a Japanese LED manufacturer unveiled a new LED irradiation device for assessing UV sensitivity, including the inactivation of microorganisms. This innovative device is engineered to ensure precise and consistent evaluation of UV sensitivity, factoring in the electrical and thermal properties of the LEDs, the irradiance on the target surface, the distribution of irradiance, exposure duration, beam angle, reflections from adjacent materials, and the sample's temperature.
Furthermore, the increasing regulatory support and stringent government regulations regarding environmental safety are influencing the market positively. Traditional mercury-based UV lamps pose environmental and health hazards due to mercury content. Regulatory bodies worldwide are phasing out these mercury-based lamps, encouraging the adoption of UV LEDs as a safer and more environmentally friendly alternative. This regulatory push is creating new opportunities for UV LED manufacturers and driving market expansion. For example,Canada's SOR/2024-109 Regulations Amending the Products Containing Mercury Regulations aim to reduce mercury exposure risks to the environment and human health by prohibiting the manufacturing and import of most mercury-containing products, with exceptions like pest control products. Effective June 19, 2025, the amendments support Canada's National Strategy for Lamps Containing Mercury by gradually phasing out common mercury-containing lamps. New prohibitions on mercury lamps for general lighting are expected to be implemented in the coming years.
The COVID-19 pandemic highlighted the importance of effective sterilization and disinfection technologies, leading to a surge in demand for UV LED-based solutions. UV LEDs are used for sterilizing medical equipment, air, and surfaces, offering a chemical-free method to eliminate pathogens. This has accelerated the development and deployment of UV LED products in healthcare settings, contributing significantly to market growth.
Global UV LED Market Report Segmentation
This report forecasts revenue growth at global, regional, and country levels and provides an analysis of the latest industry trends in each of the sub-segments from 2018 to 2030. For this study, Grand View Research has segmented the UV LED market report based on technology, power output, application, end use, and region.
- Technology Outlook (Revenue, USD Billion, 2018 - 2030)
- UV-A
- UV-B
- UV-C
- Power Output Outlook (Revenue, USD Billion, 2018 - 2030)
- Less than 1W
- 1W -5W
- More than 5W
- Application Outlook (Revenue, USD Billion, 2018 - 2030)
- UV curing
- Medical light therapy
- Disinfection & sterilization
- Counterfeit detection
- Optical sensing & instrumentation
- Others
- End Use Outlook (Revenue, USD Billion, 2018 - 2030)
- Industrial
- Commercial
- Residential
- Agriculture
- Healthcare
- Regional Outlook (Revenue, USD Billion, 2018 - 2030)
- North America
- U.S.
- Canada
- Mexico
- Europe
- Germany
- UK
- France
- Asia Pacific
- China
- India
- Japan
- South Korea
- Australia
- Latin America
- Brazil
- Middle East & Africa
- U.A.E
- Kingdom of Saudi Arabia
- South Africa
Table of Contents
Chapter 1. Methodology and Scope
- 1.1. Market Segmentation and Scope
- 1.2. Market Definitions
- 1.3. Research Methodology
- 1.3.1. Information Procurement
- 1.3.2. Information or Data Analysis
- 1.3.3. Market Formulation & Data Visualization
- 1.3.4. Data Validation & Publishing
- 1.4. Research Scope and Assumptions
- 1.4.1. List of Data Sources
Chapter 2. Executive Summary
- 2.1. Market Outlook
- 2.2. Segment Outlook
- 2.3. Competitive Insights
Chapter 3. UV LED Variables, Trends, & Scope
- 3.1. Market Introduction/Lineage Outlook
- 3.2. Industry Value Chain Analysis
- 3.3. Market Dynamics
- 3.3.1. Market Drivers Analysis
- 3.3.2. Market Restraints Analysis
- 3.3.3. Industry Opportunities
- 3.4. UV LED Analysis Tools
- 3.4.1. Porter's Five Forces Analysis
- 3.4.1.1. Bargaining power of the suppliers
- 3.4.1.2. Bargaining power of the buyers
- 3.4.1.3. Threats of substitution
- 3.4.1.4. Threats from new entrants
- 3.4.1.5. Competitive rivalry
- 3.4.2. PESTEL Analysis
- 3.4.2.1. Political landscape
- 3.4.2.2. Economic and Social landscape
- 3.4.2.3. Technological landscape
- 3.4.2.4. Environmental landscape
- 3.4.2.5. Legal landscape
- 3.4.1. Porter's Five Forces Analysis
Chapter 4. UV LED: Technology Estimates & Trend Analysis
- 4.1. Segment Dashboard
- 4.2. UV LED: Technology Movement Analysis, USD Billion, 2023 & 2030
- 4.3. UV-A
- 4.3.1. Market size estimates and forecasts, 2018-2030 (USD Billion)
- 4.4. UV-B
- 4.4.1. Market size estimates and forecasts, 2018-2030 (USD Billion)
- 4.5. UV-C
- 4.5.1. Market size estimates and forecasts, 2018-2030 (USD Billion)
Chapter 5. UV LED: Power Output Estimates & Trend Analysis
- 5.1. Segment Dashboard
- 5.2. UV LED: Power Output Movement Analysis, USD Billion, 2023 & 2030
- 5.3. Less than 1W
- 5.3.1. Market size estimates and forecasts, 2018-2030 (USD Billion)
- 5.4. 1W -5W
- 5.4.1. Market size estimates and forecasts, 2018-2030 (USD Billion)
- 5.5. More than 5W
- 5.5.1. Market size estimates and forecasts, 2018-2030 (USD Billion)
Chapter 6. UV LED: Application Estimates & Trend Analysis
- 6.1. Segment Dashboard
- 6.2. UV LED: Application Movement Analysis, USD Billion, 2023 & 2030
- 6.3. UV curing
- 6.3.1. Market size estimates and forecasts, 2018-2030 (USD Billion)
- 6.4. Medical light therapy
- 6.4.1. Market size estimates and forecasts, 2018-2030 (USD Billion)
- 6.5. Disinfection & sterilization
- 6.5.1. Market size estimates and forecasts, 2018-2030 (USD Billion)
- 6.6. Counterfeit detection
- 6.6.1. Market size estimates and forecasts, 2018-2030 (USD Billion)
- 6.7. Optical sensing & instrumentation
- 6.7.1. Market size estimates and forecasts, 2018-2030 (USD Billion)
- 6.8. Others
- 6.8.1. Market size estimates and forecasts, 2018-2030 (USD Billion)
Chapter 7. UV LED: End Use Estimates & Trend Analysis
- 7.1. Segment Dashboard
- 7.2. UV LED: End Use Movement Analysis, USD Billion, 2023 & 2030
- 7.3. Industrial
- 7.3.1. Market size estimates and forecasts, 2018 - 2030 (USD Billion)
- 7.4. Commercial
- 7.4.1. Market size estimates and forecasts, 2018 - 2030 (USD Billion)
- 7.5. Residential
- 7.5.1. Market size estimates and forecasts, 2018 - 2030 (USD Billion)
- 7.6. Agriculture
- 7.6.1. Market size estimates and forecasts, 2018 - 2030 (USD Billion)
- 7.7. Healthcare
- 7.7.1. Market size estimates and forecasts, 2018 - 2030 (USD Billion)
Chapter 8. UV LED Market: Regional Estimates & Trend Analysis
- 8.1. UV LED Market Share, By Region, 2023 & 2030, USD Billion
- 8.2. North America
- 8.2.1. Market Estimates and Forecasts, 2018 - 2030 (USD Billion)
- 8.2.2. Market estimates and forecast by technology, 2018-2030 (Revenue, USD Billion)
- 8.2.3. Market estimates and forecast by power output, 2018-2030 (Revenue, USD Billion)
- 8.2.4. Market estimates and forecast by application, 2018-2030 (Revenue, USD Billion)
- 8.2.5. Market estimates and forecast by end use, 2018-2030 (Revenue, USD Billion)
- 8.2.6. U.S.
- 8.2.6.1. Market Estimates and Forecasts, 2018 - 2030 (USD Billion)
- 8.2.6.2. Market estimates and forecast by technology, 2018-2030 (Revenue, USD Billion)
- 8.2.6.3. Market estimates and forecast by power output, 2018-2030 (Revenue, USD Billion)
- 8.2.6.4. Market estimates and forecast by end use, 2018-2030 (Revenue, USD Billion)
- 8.2.7. Canada
- 8.2.7.1. Market Estimates and Forecasts, 2018 - 2030 (USD Billion)
- 8.2.7.2. Market estimates and forecast by technology, 2018-2030 (Revenue, USD Billion)
- 8.2.7.3. Market estimates and forecast by power output, 2018-2030 (Revenue, USD Billion)
- 8.2.7.4. Market estimates and forecast by application, 2018-2030 (Revenue, USD Billion)
- 8.2.7.5. Market estimates and forecast by end use, 2018-2030 (Revenue, USD Billion)
- 8.2.8. Mexico
- 8.2.8.1. Market Estimates and Forecasts, 2018 - 2030 (USD Billion)
- 8.2.8.2. Market estimates and forecast by technology, 2018-2030 (Revenue, USD Billion)
- 8.2.8.3. Market estimates and forecast by power output, 2018-2030 (Revenue, USD Billion)
- 8.2.8.4. Market estimates and forecast by application, 2018-2030 (Revenue, USD Billion)
- 8.2.8.5. Market estimates and forecast by end use, 2018-2030 (Revenue, USD Billion)
- 8.3. Europe
- 8.3.1. Market estimates and forecast by technology, 2018-2030 (Revenue, USD Billion)
- 8.3.2. Market estimates and forecast by power output, 2018-2030 (Revenue, USD Billion)
- 8.3.3. Market estimates and forecast by application, 2018-2030 (Revenue, USD Billion)
- 8.3.4. Market estimates and forecast by end use, 2018-2030 (Revenue, USD Billion)
- 8.3.5. UK
- 8.3.5.1. Market Estimates and Forecasts, 2018 - 2030 (USD Billion)
- 8.3.5.2. Market estimates and forecast by technology, 2018-2030 (Revenue, USD Billion)
- 8.3.5.3. Market estimates and forecast by power output, 2018-2030 (Revenue, USD Billion)
- 8.3.5.4. Market estimates and forecast by application, 2018-2030 (Revenue, USD Billion)
- 8.3.5.5. Market estimates and forecast by end use, 2018-2030 (Revenue, USD Billion)
- 8.3.6. Germany
- 8.3.6.1. Market Estimates and Forecasts, 2018 - 2030 (USD Billion)
- 8.3.6.2. Market estimates and forecast by technology, 2018-2030 (Revenue, USD Billion)
- 8.3.6.3. Market estimates and forecast by power output, 2018-2030 (Revenue, USD Billion)
- 8.3.6.4. Market estimates and forecast by application, 2018-2030 (Revenue, USD Billion)
- 8.3.6.5. Market estimates and forecast by end use, 2018-2030 (Revenue, USD Billion)
- 8.3.7. France
- 8.3.7.1. Market Estimates and Forecasts, 2018 - 2030 (USD Billion)
- 8.3.7.2. Market estimates and forecast by technology, 2018-2030 (Revenue, USD Billion)
- 8.3.7.3. Market estimates and forecast by power output, 2018-2030 (Revenue, USD Billion)
- 8.3.7.4. Market estimates and forecast by application, 2018-2030 (Revenue, USD Billion)
- 8.3.7.5. Market estimates and forecast by end use, 2018-2030 (Revenue, USD Billion)
- 8.4. Asia Pacific
- 8.4.1. Market Estimates and Forecasts, 2018 - 2030 (USD Billion)
- 8.4.2. Market estimates and forecast by technology, 2018-2030 (Revenue, USD Billion)
- 8.4.3. Market estimates and forecast by power output, 2018-2030 (Revenue, USD Billion)
- 8.4.4. Market estimates and forecast by application, 2018-2030 (Revenue, USD Billion)
- 8.4.5. Market estimates and forecast by end use, 2018-2030 (Revenue, USD Billion)
- 8.4.6. China
- 8.4.6.1. Market Estimates and Forecasts, 2018 - 2030 (USD Billion)
- 8.4.6.2. Market estimates and forecast by technology, 2018-2030 (Revenue, USD Billion)
- 8.4.6.3. Market estimates and forecast by power output, 2018-2030 (Revenue, USD Billion)
- 8.4.6.4. Market estimates and forecast by application, 2018-2030 (Revenue, USD Billion)
- 8.4.6.5. Market estimates and forecast by end use, 2018-2030 (Revenue, USD Billion)
- 8.4.7. India
- 8.4.7.1. Market Estimates and Forecasts, 2018 - 2030 (USD Billion)
- 8.4.7.2. Market estimates and forecast by technology, 2018-2030 (Revenue, USD Billion)
- 8.4.7.3. Market estimates and forecast by power output, 2018-2030 (Revenue, USD Billion)
- 8.4.7.4. Market estimates and forecast by application, 2018-2030 (Revenue, USD Billion)
- 8.4.7.5. Market estimates and forecast by end use, 2018-2030 (Revenue, USD Billion)
- 8.4.8. Japan
- 8.4.8.1. Market Estimates and Forecasts, 2018 - 2030 (USD Billion)
- 8.4.8.2. Market estimates and forecast by technology, 2018-2030 (Revenue, USD Billion)
- 8.4.8.3. Market estimates and forecast by power output, 2018-2030 (Revenue, USD Billion)
- 8.4.8.4. Market estimates and forecast by application, 2018-2030 (Revenue, USD Billion)
- 8.4.8.5. Market estimates and forecast by end use, 2018-2030 (Revenue, USD Billion)
- 8.4.9. Australia
- 8.4.9.1. Market Estimates and Forecasts, 2018 - 2030 (USD Billion)
- 8.4.9.2. Market estimates and forecast by technology, 2018-2030 (Revenue, USD Billion)
- 8.4.9.3. Market estimates and forecast by power output, 2018-2030 (Revenue, USD Billion)
- 8.4.9.4. Market estimates and forecast by application, 2018-2030 (Revenue, USD Billion)
- 8.4.9.5. Market estimates and forecast by end use, 2018-2030 (Revenue, USD Billion)
- 8.4.10. South Korea
- 8.4.10.1. Market Estimates and Forecasts, 2018 - 2030 (USD Billion)
- 8.4.10.2. Market estimates and forecast by technology, 2018-2030 (Revenue, USD Billion)
- 8.4.10.3. Market estimates and forecast by power output, 2018-2030 (Revenue, USD Billion)
- 8.4.10.4. Market estimates and forecast by application, 2018-2030 (Revenue, USD Billion)
- 8.4.10.5. Market estimates and forecast by end use, 2018-2030 (Revenue, USD Billion)
- 8.5. Latin America
- 8.5.1. Market Estimates and Forecasts, 2018 - 2030 (USD Billion)
- 8.5.2. Market estimates and forecast by technology, 2018-2030 (Revenue, USD Billion)
- 8.5.3. Market estimates and forecast by power output, 2018-2030 (Revenue, USD Billion)
- 8.5.4. Market estimates and forecast by application, 2018-2030 (Revenue, USD Billion)
- 8.5.5. Market estimates and forecast by end use, 2018-2030 (Revenue, USD Billion)
- 8.5.6. Brazil
- 8.5.6.1. Market Estimates and Forecasts, 2018 - 2030 (USD Billion)
- 8.5.6.2. Market estimates and forecast by technology, 2018-2030 (Revenue, USD Billion)
- 8.5.6.3. Market estimates and forecast by power output, 2018-2030 (Revenue, USD Billion)
- 8.5.6.4. Market estimates and forecast by application, 2018-2030 (Revenue, USD Billion)
- 8.5.6.5. Market estimates and forecast by end use, 2018-2030 (Revenue, USD Billion)
- 8.6. Middle East & Africa
- 8.6.1.1. Market Estimates and Forecasts, 2018 - 2030 (USD Billion)
- 8.6.1.2. Market estimates and forecast by technology, 2018-2030 (Revenue, USD Billion)
- 8.6.1.3. Market estimates and forecast by power output, 2018-2030 (Revenue, USD Billion)
- 8.6.1.4. Market estimates and forecast by application, 2018-2030 (Revenue, USD Billion)
- 8.6.1.5. Market estimates and forecast by end use, 2018-2030 (Revenue, USD Billion)
- 8.6.2. UAE
- 8.6.2.1. Market Estimates and Forecasts, 2018 - 2030 (USD Billion)
- 8.6.2.2. Market estimates and forecast by technology, 2018-2030 (Revenue, USD Billion)
- 8.6.2.3. Market estimates and forecast by power output, 2018-2030 (Revenue, USD Billion)
- 8.6.2.4. Market estimates and forecast by application, 2018-2030 (Revenue, USD Billion)
- 8.6.2.5. Market estimates and forecast by end use, 2018-2030 (Revenue, USD Billion)
- 8.6.3. Kingdom of Saudi Arabia
- 8.6.3.1. Market Estimates and Forecasts, 2018 - 2030 (USD Billion)
- 8.6.3.2. Market estimates and forecast by technology, 2018-2030 (Revenue, USD Billion)
- 8.6.3.3. Market estimates and forecast by power output, 2018-2030 (Revenue, USD Billion)
- 8.6.3.4. Market estimates and forecast by application, 2018-2030 (Revenue, USD Billion)
- 8.6.3.5. Market estimates and forecast by end use, 2018-2030 (Revenue, USD Billion)
- 8.6.4. South Africa
- 8.6.4.1. Market Estimates and Forecasts, 2018 - 2030 (USD Billion)
- 8.6.4.2. Market estimates and forecast by technology, 2018-2030 (Revenue, USD Billion)
- 8.6.4.3. Market estimates and forecast by power output, 2018-2030 (Revenue, USD Billion)
- 8.6.4.4. Market estimates and forecast by application, 2018-2030 (Revenue, USD Billion)
- 8.6.4.5. Market estimates and forecast by end use, 2018-2030 (Revenue, USD Billion)
Chapter 9. Competitive Landscape
- 9.1. Recent Developments & Impact Analysis by Key Market Participants
- 9.2. Company Categorization
- 9.3. Company Market Share Analysis
- 9.4. Company Heat Map Analysis
- 9.5. Strategy Mapping
- 9.5.1. Expansion
- 9.5.2. Mergers & Acquisition
- 9.5.3. Partnerships & Collaborations
- 9.5.4. New Product Launches
- 9.5.5. Research And Development
- 9.6. Company Profiles
- 9.6.1. Advanced Optoelectronic Technology, Inc.
- 9.6.1.1. Participant's Overview
- 9.6.1.2. Financial Performance
- 9.6.1.3. Product Benchmarking
- 9.6.1.4. Recent Developments
- 9.6.2. Crystal IS, Inc.
- 9.6.2.1. Participant's Overview
- 9.6.2.2. Financial Performance
- 9.6.2.3. Product Benchmarking
- 9.6.2.4. Recent Developments
- 9.6.3. EPISTAR Corporation
- 9.6.3.1. Participant's Overview
- 9.6.3.2. Financial Performance
- 9.6.3.3. Product Benchmarking
- 9.6.3.4. Recent Developments
- 9.6.4. Excelitas Noblelight
- 9.6.4.1. Participant's Overview
- 9.6.4.2. Financial Performance
- 9.6.4.3. Product Benchmarking
- 9.6.4.4. Recent Developments
- 9.6.5. LG Innotek
- 9.6.5.1. Participant's Overview
- 9.6.5.2. Financial Performance
- 9.6.5.3. Product Benchmarking
- 9.6.5.4. Recent Developments
- 9.6.6. Lumileds Holding B.V.
- 9.6.6.1. Participant's Overview
- 9.6.6.2. Financial Performance
- 9.6.6.3. Product Benchmarking
- 9.6.6.4. Recent Developments
- 9.6.7. NICHIA CORPORATION
- 9.6.7.1. Participant's Overview
- 9.6.7.2. Financial Performance
- 9.6.7.3. Product Benchmarking
- 9.6.7.4. Recent Developments
- 9.6.8. ams-OSRAM AG
- 9.6.8.1. Participant's Overview
- 9.6.8.2. Financial Performance
- 9.6.8.3. Product Benchmarking
- 9.6.8.4. Recent Developments
- 9.6.9. Phoseon Technology
- 9.6.9.1. Participant's Overview
- 9.6.9.2. Financial Performance
- 9.6.9.3. Product Benchmarking
- 9.6.9.4. Recent Developments
- 9.6.10. Semileds Corporation
- 9.6.10.1. Participant's Overview
- 9.6.10.2. Financial Performance
- 9.6.10.3. Product Benchmarking
- 9.6.10.4. Recent Developments
- 9.6.11. Sensor Electronic Technology, Inc. (SETi)
- 9.6.11.1. Participant's Overview
- 9.6.11.2. Financial Performance
- 9.6.11.3. Product Benchmarking
- 9.6.11.4. Recent Developments
- 9.6.12. Seoul Viosys Co., Ltd.
- 9.6.12.1. Participant's Overview
- 9.6.12.2. Financial Performance
- 9.6.12.3. Product Benchmarking
- 9.6.12.4. Recent Developments
- 9.6.13. STANLEY ELECTRIC CO., LTD.
- 9.6.13.1. Participant's Overview
- 9.6.13.2. Financial Performance
- 9.6.13.3. Product Benchmarking
- 9.6.13.4. Recent Developments
- 9.6.14. Ushio, Inc.
- 9.6.14.1. Participant's Overview
- 9.6.14.2. Financial Performance
- 9.6.14.3. Product Benchmarking
- 9.6.14.4. Recent Developments
- 9.6.15. Violumas
- 9.6.15.1. Participant's Overview
- 9.6.15.2. Financial Performance
- 9.6.15.3. Product Benchmarking
- 9.6.15.4. Recent Developments
- 9.6.1. Advanced Optoelectronic Technology, Inc.
