|
|
市場調査レポート
商品コード
1365840
量子フォトニクス市場:提供製品別、用途別、業界別:世界の機会分析と産業予測、2023-2032年Quantum Photonics Market By Offering, By Application, By Verticals : Global Opportunity Analysis and Industry Forecast, 2023-2032 |
||||||
|
|
|||||||
|
|||||||


| 量子フォトニクス市場:提供製品別、用途別、業界別:世界の機会分析と産業予測、2023-2032年 |
|
出版日: 2023年08月01日
発行: Allied Market Research
ページ情報: 英文 250 Pages
納期: 2~3営業日
|

- 全表示
- 概要
- 図表
- 目次
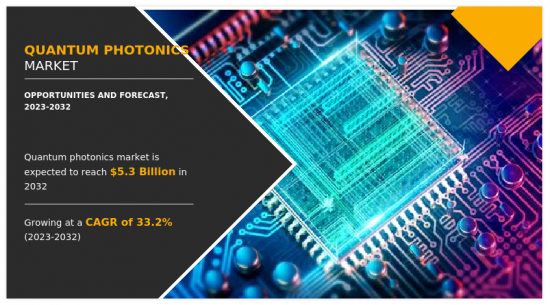
量子フォトニクス市場は、2022年には3億米ドルと評価され、2023年から2032年にかけてCAGR 33.2%で成長し、2032年には53億米ドルに達すると予測されています。
量子フォトニクスとは、量子力学の原理が支配する量子レベルでの個々の光子の研究、操作、利用を指します。量子フォトニクスは、重ね合わせやエンタングルメントといった光子のユニークな性質を利用し、高度な技術やアプリケーションを創出します。量子フォトニクスは、量子コンピューティング、量子通信、量子暗号、量子センシング、量子計測など様々な分野で重要な役割を果たしています。量子フォトニクスの目標は、光粒子の基本的な性質を活用し、情報処理、通信、精密測定において、古典的なフォトニックシステムの能力を超える、革新的な進歩を可能にすることです。
量子フォトニクスデバイスの製造に使用される原材料には、特殊な半導体、光学部品、超伝導材料などがあります。これらの材料は、特定の量子特性や光との相互作用を示すように慎重に設計されており、様々な量子技術やアプリケーションのために個々の光子の操作や制御を可能にしています。
量子フォトニクスの主なエンドユーザーには、通信、IT、防衛、金融、研究機関などがあります。これらの分野では、量子フォトニクス技術を安全な通信、量子コンピューティング、高度なセンシング、暗号技術、その他の革新的なアプリケーションに活用しています。
世界の量子フォトニクス市場の成長は、戦略的投資によってもたらされています。政府や民間企業からの多額の資金援助により、量子フォトニクス研究は進歩し、共同研究が盛んになり、商業化の取り組みが加速しています。こうした投資は優秀な人材を惹きつけ、強固な量子産業エコシステムを確立し、量子覇権を達成するための国際競争力を高める。さらに、セキュアで高性能なソリューションに対する需要の高まりは、量子フォトニクス市場にとって大きなビジネスチャンスとなっています。サイバーセキュリティのリスクが高まる中、量子フォトニクスの原理に基づく安全な通信や暗号システムのニーズが高まっています。さらに、量子フォトニクスは、古典的なコンピュータの能力を超える高度な問題を扱う量子コンピュータを通じて計算能力をシフトさせることができるため、予測期間中に有利なビジネスチャンスがもたらされます。
しかし、量子フォトニクスのスケーラビリティとアップグレード可能性には限界があり、市場の成長とシステムの強化に課題となる可能性があります。
量子フォトニクスの主な目標は、量子力学の原理を利用した先進技術やアプリケーションを開発するために、個々の光子の量子レベルでのユニークな特性を活用することです。量子フォトニクスは、量子システム内の光子を制御・操作することで、量子コンピューティング、量子通信、量子暗号、量子センシング、量子計測など、様々な分野で革新的な進歩を実現することを目指しています。
量子フォトニクス市場は、オファリング、アプリケーション、業界別、地域別に区分されます。オファリング別では、市場はシステムとサービスに分けられます。アプリケーション別では、市場は量子通信、量子コンピューティング、量子センシング、計測に分類されます。垂直分野別では、市場は銀行・金融、宇宙・防衛、ヘルスケア、輸送・物流、政府、その他に区分されます。
地域別では、北米(米国、カナダ、メキシコ)、欧州(英国、ドイツ、フランス、その他欧州地域)、アジア太平洋地域(中国、日本、インド、韓国、その他アジア太平洋地域)、ラテンアメリカ(中南米、中東・アフリカ)で分析しています。
- 本レポートでは、東芝、Xanadu、Quandela、ID Quantique、ORCA Computing Limited、PsiQuantum、Tundra Systems Global LTD.、Quix Quantum BV、IBM、MagiQ Technologiesなど、主要な量子フォトニクス市場プレイヤーの競合分析とプロファイルを掲載しています。市場プレイヤーは、量子フォトニクス市場での足場を拡大するために、製品投入、パートナーシップ、買収など様々な戦略を採用しています。
目次
第1章 イントロダクション
第2章 エグゼクティブサマリー
第3章 市場概要
- 市場の定義と範囲
- 主な調査結果
- 影響要因
- 主な投資機会
- ポーターのファイブフォース分析
- 市場力学
- 促進要因
- セキュアな通信に対する需要の増加
- 量子技術の進歩
- 抑制要因
- 製造プロセスの高コスト
- 機会
- 安全で高性能なソリューションへの需要の増加
- 促進要因
- COVID-19市場への影響分析
第4章 量子フォトニクス市場:提供製品別
- 概要
- システム
- サービス
第5章 量子フォトニクス市場:用途別
- 概要
- 量子通信
- 量子コンピューティング
- 量子センシングと量子計測
第6章 量子フォトニクス市場:業界別
- 概要
- 銀行・金融
- 宇宙・防衛
- ヘルスケア
- 運輸・物流
- 政府機関
- その他
第7章 量子フォトニクス市場,地域別
- 概要
- 北米
- 米国
- カナダ
- メキシコ
- 欧州
- ドイツ
- 英国
- フランス
- オランダ
- その他
- アジア太平洋
- 中国
- 日本
- インド
- 韓国
- その他
- ラテンアメリカ
- ラテンアメリカ
- 中東
- アフリカ
第8章 競合情勢
- イントロダクション
- 主要成功戦略
- 主要10社の製品マッピング
- 競合ダッシュボード
- 競合ヒートマップ
- 主要企業のポジショニング、2022年
第9章 企業プロファイル
- Toshiba Corporation
- Xanadu
- Quandela
- ID Quantique
- ORCA Computing Limited
- PsiQuantum
- TundraSystems Global LTD.
- Quix Quantum BV
- IBM Corporation
- MagiQ Technologies, Inc.
LIST OF TABLES
- TABLE 01. GLOBAL QUANTUM PHOTONICS MARKET, BY OFFERING, 2022-2032 ($BILLION)
- TABLE 02. QUANTUM PHOTONICS MARKET FOR SYSTEMS, BY REGION, 2022-2032 ($BILLION)
- TABLE 03. QUANTUM PHOTONICS MARKET FOR SERVICES, BY REGION, 2022-2032 ($BILLION)
- TABLE 04. GLOBAL QUANTUM PHOTONICS MARKET, BY APPLICATION, 2022-2032 ($BILLION)
- TABLE 05. QUANTUM PHOTONICS MARKET FOR QUANTUM COMMUNICATION, BY REGION, 2022-2032 ($BILLION)
- TABLE 06. QUANTUM PHOTONICS MARKET FOR QUANTUM COMPUTING, BY REGION, 2022-2032 ($BILLION)
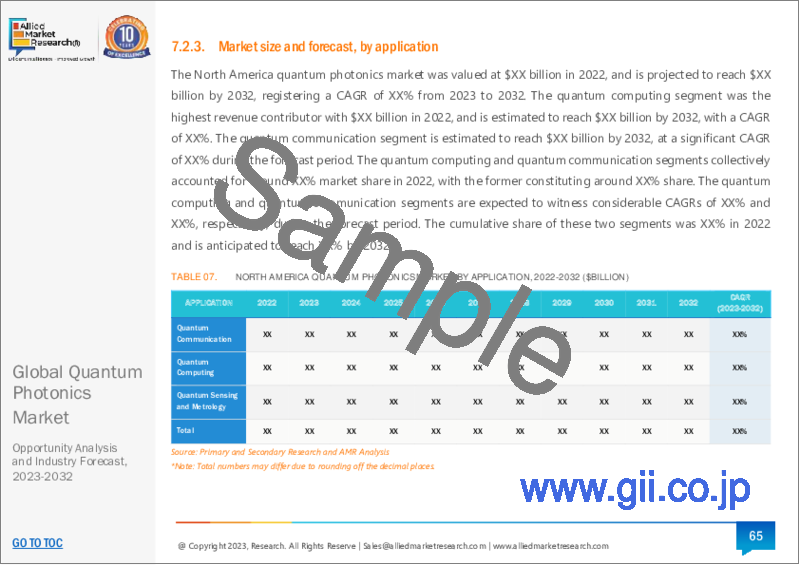
- TABLE 07. QUANTUM PHOTONICS MARKET FOR QUANTUM SENSING AND METROLOGY, BY REGION, 2022-2032 ($BILLION)
- TABLE 08. GLOBAL QUANTUM PHOTONICS MARKET, BY VERTICALS, 2022-2032 ($BILLION)
- TABLE 09. QUANTUM PHOTONICS MARKET FOR BANKING AND FINANCE, BY REGION, 2022-2032 ($BILLION)
- TABLE 10. QUANTUM PHOTONICS MARKET FOR SPACE AND DEFENSE, BY REGION, 2022-2032 ($BILLION)
- TABLE 11. QUANTUM PHOTONICS MARKET FOR HEALTHCARE, BY REGION, 2022-2032 ($BILLION)
- TABLE 12. QUANTUM PHOTONICS MARKET FOR TRANSPORTATION AND LOGISTICS, BY REGION, 2022-2032 ($BILLION)
- TABLE 13. QUANTUM PHOTONICS MARKET FOR GOVERNMENT, BY REGION, 2022-2032 ($BILLION)
- TABLE 14. QUANTUM PHOTONICS MARKET FOR OTHERS, BY REGION, 2022-2032 ($BILLION)
- TABLE 15. QUANTUM PHOTONICS MARKET, BY REGION, 2022-2032 ($BILLION)
- TABLE 16. NORTH AMERICA QUANTUM PHOTONICS MARKET, BY OFFERING, 2022-2032 ($BILLION)
- TABLE 17. NORTH AMERICA QUANTUM PHOTONICS MARKET, BY APPLICATION, 2022-2032 ($BILLION)
- TABLE 18. NORTH AMERICA QUANTUM PHOTONICS MARKET, BY VERTICALS, 2022-2032 ($BILLION)
- TABLE 19. NORTH AMERICA QUANTUM PHOTONICS MARKET, BY COUNTRY, 2022-2032 ($BILLION)
- TABLE 20. U.S. QUANTUM PHOTONICS MARKET, BY OFFERING, 2022-2032 ($BILLION)
- TABLE 21. U.S. QUANTUM PHOTONICS MARKET, BY APPLICATION, 2022-2032 ($BILLION)
- TABLE 22. U.S. QUANTUM PHOTONICS MARKET, BY VERTICALS, 2022-2032 ($BILLION)
- TABLE 23. CANADA QUANTUM PHOTONICS MARKET, BY OFFERING, 2022-2032 ($BILLION)
- TABLE 24. CANADA QUANTUM PHOTONICS MARKET, BY APPLICATION, 2022-2032 ($BILLION)
- TABLE 25. CANADA QUANTUM PHOTONICS MARKET, BY VERTICALS, 2022-2032 ($BILLION)
- TABLE 26. MEXICO QUANTUM PHOTONICS MARKET, BY OFFERING, 2022-2032 ($BILLION)
- TABLE 27. MEXICO QUANTUM PHOTONICS MARKET, BY APPLICATION, 2022-2032 ($BILLION)
- TABLE 28. MEXICO QUANTUM PHOTONICS MARKET, BY VERTICALS, 2022-2032 ($BILLION)
- TABLE 29. EUROPE QUANTUM PHOTONICS MARKET, BY OFFERING, 2022-2032 ($BILLION)
- TABLE 30. EUROPE QUANTUM PHOTONICS MARKET, BY APPLICATION, 2022-2032 ($BILLION)
- TABLE 31. EUROPE QUANTUM PHOTONICS MARKET, BY VERTICALS, 2022-2032 ($BILLION)
- TABLE 32. EUROPE QUANTUM PHOTONICS MARKET, BY COUNTRY, 2022-2032 ($BILLION)
- TABLE 33. GERMANY QUANTUM PHOTONICS MARKET, BY OFFERING, 2022-2032 ($BILLION)
- TABLE 34. GERMANY QUANTUM PHOTONICS MARKET, BY APPLICATION, 2022-2032 ($BILLION)
- TABLE 35. GERMANY QUANTUM PHOTONICS MARKET, BY VERTICALS, 2022-2032 ($BILLION)
- TABLE 36. UK QUANTUM PHOTONICS MARKET, BY OFFERING, 2022-2032 ($BILLION)
- TABLE 37. UK QUANTUM PHOTONICS MARKET, BY APPLICATION, 2022-2032 ($BILLION)
- TABLE 38. UK QUANTUM PHOTONICS MARKET, BY VERTICALS, 2022-2032 ($BILLION)
- TABLE 39. FRANCE QUANTUM PHOTONICS MARKET, BY OFFERING, 2022-2032 ($BILLION)
- TABLE 40. FRANCE QUANTUM PHOTONICS MARKET, BY APPLICATION, 2022-2032 ($BILLION)
- TABLE 41. FRANCE QUANTUM PHOTONICS MARKET, BY VERTICALS, 2022-2032 ($BILLION)
- TABLE 42. NETHERLANDS QUANTUM PHOTONICS MARKET, BY OFFERING, 2022-2032 ($BILLION)
- TABLE 43. NETHERLANDS QUANTUM PHOTONICS MARKET, BY APPLICATION, 2022-2032 ($BILLION)
- TABLE 44. NETHERLANDS QUANTUM PHOTONICS MARKET, BY VERTICALS, 2022-2032 ($BILLION)
- TABLE 45. REST OF EUROPE QUANTUM PHOTONICS MARKET, BY OFFERING, 2022-2032 ($BILLION)
- TABLE 46. REST OF EUROPE QUANTUM PHOTONICS MARKET, BY APPLICATION, 2022-2032 ($BILLION)
- TABLE 47. REST OF EUROPE QUANTUM PHOTONICS MARKET, BY VERTICALS, 2022-2032 ($BILLION)
- TABLE 48. ASIA-PACIFIC QUANTUM PHOTONICS MARKET, BY OFFERING, 2022-2032 ($BILLION)
- TABLE 49. ASIA-PACIFIC QUANTUM PHOTONICS MARKET, BY APPLICATION, 2022-2032 ($BILLION)
- TABLE 50. ASIA-PACIFIC QUANTUM PHOTONICS MARKET, BY VERTICALS, 2022-2032 ($BILLION)
- TABLE 51. ASIA-PACIFIC QUANTUM PHOTONICS MARKET, BY COUNTRY, 2022-2032 ($BILLION)
- TABLE 52. CHINA QUANTUM PHOTONICS MARKET, BY OFFERING, 2022-2032 ($BILLION)
- TABLE 53. CHINA QUANTUM PHOTONICS MARKET, BY APPLICATION, 2022-2032 ($BILLION)
- TABLE 54. CHINA QUANTUM PHOTONICS MARKET, BY VERTICALS, 2022-2032 ($BILLION)
- TABLE 55. JAPAN QUANTUM PHOTONICS MARKET, BY OFFERING, 2022-2032 ($BILLION)
- TABLE 56. JAPAN QUANTUM PHOTONICS MARKET, BY APPLICATION, 2022-2032 ($BILLION)
- TABLE 57. JAPAN QUANTUM PHOTONICS MARKET, BY VERTICALS, 2022-2032 ($BILLION)
- TABLE 58. INDIA QUANTUM PHOTONICS MARKET, BY OFFERING, 2022-2032 ($BILLION)
- TABLE 59. INDIA QUANTUM PHOTONICS MARKET, BY APPLICATION, 2022-2032 ($BILLION)
- TABLE 60. INDIA QUANTUM PHOTONICS MARKET, BY VERTICALS, 2022-2032 ($BILLION)
- TABLE 61. SOUTH KOREA QUANTUM PHOTONICS MARKET, BY OFFERING, 2022-2032 ($BILLION)
- TABLE 62. SOUTH KOREA QUANTUM PHOTONICS MARKET, BY APPLICATION, 2022-2032 ($BILLION)
- TABLE 63. SOUTH KOREA QUANTUM PHOTONICS MARKET, BY VERTICALS, 2022-2032 ($BILLION)
- TABLE 64. REST OF ASIA-PACIFIC QUANTUM PHOTONICS MARKET, BY OFFERING, 2022-2032 ($BILLION)
- TABLE 65. REST OF ASIA-PACIFIC QUANTUM PHOTONICS MARKET, BY APPLICATION, 2022-2032 ($BILLION)
- TABLE 66. REST OF ASIA-PACIFIC QUANTUM PHOTONICS MARKET, BY VERTICALS, 2022-2032 ($BILLION)
- TABLE 67. LAMEA QUANTUM PHOTONICS MARKET, BY OFFERING, 2022-2032 ($BILLION)
- TABLE 68. LAMEA QUANTUM PHOTONICS MARKET, BY APPLICATION, 2022-2032 ($BILLION)
- TABLE 69. LAMEA QUANTUM PHOTONICS MARKET, BY VERTICALS, 2022-2032 ($BILLION)
- TABLE 70. LAMEA QUANTUM PHOTONICS MARKET, BY COUNTRY, 2022-2032 ($BILLION)
- TABLE 71. LATIN AMERICA QUANTUM PHOTONICS MARKET, BY OFFERING, 2022-2032 ($BILLION)
- TABLE 72. LATIN AMERICA QUANTUM PHOTONICS MARKET, BY APPLICATION, 2022-2032 ($BILLION)
- TABLE 73. LATIN AMERICA QUANTUM PHOTONICS MARKET, BY VERTICALS, 2022-2032 ($BILLION)
- TABLE 74. MIDDLE EAST QUANTUM PHOTONICS MARKET, BY OFFERING, 2022-2032 ($BILLION)
- TABLE 75. MIDDLE EAST QUANTUM PHOTONICS MARKET, BY APPLICATION, 2022-2032 ($BILLION)
- TABLE 76. MIDDLE EAST QUANTUM PHOTONICS MARKET, BY VERTICALS, 2022-2032 ($BILLION)
- TABLE 77. AFRICA QUANTUM PHOTONICS MARKET, BY OFFERING, 2022-2032 ($BILLION)
- TABLE 78. AFRICA QUANTUM PHOTONICS MARKET, BY APPLICATION, 2022-2032 ($BILLION)
- TABLE 79. AFRICA QUANTUM PHOTONICS MARKET, BY VERTICALS, 2022-2032 ($BILLION)
- TABLE 80. TOSHIBA CORPORATION: KEY EXECUTIVES
- TABLE 81. TOSHIBA CORPORATION: COMPANY SNAPSHOT
- TABLE 82. TOSHIBA CORPORATION: PRODUCT SEGMENTS
- TABLE 83. TOSHIBA CORPORATION: PRODUCT PORTFOLIO
- TABLE 84. XANADU: KEY EXECUTIVES
- TABLE 85. XANADU: COMPANY SNAPSHOT
- TABLE 86. XANADU: PRODUCT SEGMENTS
- TABLE 87. XANADU: PRODUCT PORTFOLIO
- TABLE 88. XANADU: KEY STRATERGIES
- TABLE 89. QUANDELA: KEY EXECUTIVES
- TABLE 90. QUANDELA: COMPANY SNAPSHOT
- TABLE 91. QUANDELA: PRODUCT SEGMENTS
- TABLE 92. QUANDELA: PRODUCT PORTFOLIO
- TABLE 93. QUANDELA: KEY STRATERGIES
- TABLE 94. ID QUANTIQUE: KEY EXECUTIVES
- TABLE 95. ID QUANTIQUE: COMPANY SNAPSHOT
- TABLE 96. ID QUANTIQUE: PRODUCT SEGMENTS
- TABLE 97. ID QUANTIQUE: PRODUCT PORTFOLIO
- TABLE 98. ORCA COMPUTING LIMITED: KEY EXECUTIVES
- TABLE 99. ORCA COMPUTING LIMITED: COMPANY SNAPSHOT
- TABLE 100. ORCA COMPUTING LIMITED: PRODUCT SEGMENTS
- TABLE 101. ORCA COMPUTING LIMITED: PRODUCT PORTFOLIO
- TABLE 102. PSIQUANTUM: KEY EXECUTIVES
- TABLE 103. PSIQUANTUM: COMPANY SNAPSHOT
- TABLE 104. PSIQUANTUM: PRODUCT SEGMENTS
- TABLE 105. PSIQUANTUM: PRODUCT PORTFOLIO
- TABLE 106. TUNDRASYSTEMS GLOBAL LTD.: KEY EXECUTIVES
- TABLE 107. TUNDRASYSTEMS GLOBAL LTD.: COMPANY SNAPSHOT
- TABLE 108. TUNDRASYSTEMS GLOBAL LTD.: PRODUCT SEGMENTS
- TABLE 109. TUNDRASYSTEMS GLOBAL LTD.: PRODUCT PORTFOLIO
- TABLE 110. QUIX QUANTUM BV: KEY EXECUTIVES
- TABLE 111. QUIX QUANTUM BV: COMPANY SNAPSHOT
- TABLE 112. QUIX QUANTUM BV: PRODUCT SEGMENTS
- TABLE 113. QUIX QUANTUM BV: PRODUCT PORTFOLIO
- TABLE 114. IBM CORPORATION: KEY EXECUTIVES
- TABLE 115. IBM CORPORATION: COMPANY SNAPSHOT
- TABLE 116. IBM CORPORATION: SERVICE SEGMENTS
- TABLE 117. IBM CORPORATION: PRODUCT PORTFOLIO
- TABLE 118. MAGIQ TECHNOLOGIES, INC.: KEY EXECUTIVES
- TABLE 119. MAGIQ TECHNOLOGIES, INC.: COMPANY SNAPSHOT
- TABLE 120. MAGIQ TECHNOLOGIES, INC.: PRODUCT SEGMENTS
- TABLE 121. MAGIQ TECHNOLOGIES, INC.: PRODUCT PORTFOLIO
LIST OF FIGURES
- FIGURE 01. QUANTUM PHOTONICS MARKET, 2022-2032
- FIGURE 02. SEGMENTATION OF QUANTUM PHOTONICS MARKET,2022-2032
- FIGURE 03. TOP INVESTMENT POCKETS IN QUANTUM PHOTONICS MARKET (2023-2032)
- FIGURE 04. MODERATE TO HIGH BARGAINING POWER OF SUPPLIERS
- FIGURE 05. MODERATE THREAT OF NEW ENTRANTS
- FIGURE 06. LOW TO MODERATE THREAT OF SUBSTITUTES
- FIGURE 07. LOW TO HIGH INTENSITY OF RIVALRY
- FIGURE 08. MODERTE BARGAINING POWER OF BUYERS
- FIGURE 09. GLOBAL QUANTUM PHOTONICS MARKET:DRIVERS, RESTRAINTS AND OPPORTUNITIES
- FIGURE 10. QUANTUM PHOTONICS MARKET, BY OFFERING, 2022(%)
- FIGURE 11. COMPARATIVE SHARE ANALYSIS OF QUANTUM PHOTONICS MARKET FOR SYSTEMS, BY COUNTRY 2022 AND 2032(%)
- FIGURE 12. COMPARATIVE SHARE ANALYSIS OF QUANTUM PHOTONICS MARKET FOR SERVICES, BY COUNTRY 2022 AND 2032(%)
- FIGURE 13. QUANTUM PHOTONICS MARKET, BY APPLICATION, 2022(%)
- FIGURE 14. COMPARATIVE SHARE ANALYSIS OF QUANTUM PHOTONICS MARKET FOR QUANTUM COMMUNICATION, BY COUNTRY 2022 AND 2032(%)
- FIGURE 15. COMPARATIVE SHARE ANALYSIS OF QUANTUM PHOTONICS MARKET FOR QUANTUM COMPUTING, BY COUNTRY 2022 AND 2032(%)
- FIGURE 16. COMPARATIVE SHARE ANALYSIS OF QUANTUM PHOTONICS MARKET FOR QUANTUM SENSING AND METROLOGY, BY COUNTRY 2022 AND 2032(%)
- FIGURE 17. QUANTUM PHOTONICS MARKET, BY VERTICALS, 2022(%)
- FIGURE 18. COMPARATIVE SHARE ANALYSIS OF QUANTUM PHOTONICS MARKET FOR BANKING AND FINANCE, BY COUNTRY 2022 AND 2032(%)
- FIGURE 19. COMPARATIVE SHARE ANALYSIS OF QUANTUM PHOTONICS MARKET FOR SPACE AND DEFENSE, BY COUNTRY 2022 AND 2032(%)
- FIGURE 20. COMPARATIVE SHARE ANALYSIS OF QUANTUM PHOTONICS MARKET FOR HEALTHCARE, BY COUNTRY 2022 AND 2032(%)
- FIGURE 21. COMPARATIVE SHARE ANALYSIS OF QUANTUM PHOTONICS MARKET FOR TRANSPORTATION AND LOGISTICS, BY COUNTRY 2022 AND 2032(%)
- FIGURE 22. COMPARATIVE SHARE ANALYSIS OF QUANTUM PHOTONICS MARKET FOR GOVERNMENT, BY COUNTRY 2022 AND 2032(%)
- FIGURE 23. COMPARATIVE SHARE ANALYSIS OF QUANTUM PHOTONICS MARKET FOR OTHERS, BY COUNTRY 2022 AND 2032(%)
- FIGURE 24. QUANTUM PHOTONICS MARKET BY REGION, 2022(%)
- FIGURE 25. U.S. QUANTUM PHOTONICS MARKET, 2022-2032 ($BILLION)
- FIGURE 26. CANADA QUANTUM PHOTONICS MARKET, 2022-2032 ($BILLION)
- FIGURE 27. MEXICO QUANTUM PHOTONICS MARKET, 2022-2032 ($BILLION)
- FIGURE 28. GERMANY QUANTUM PHOTONICS MARKET, 2022-2032 ($BILLION)
- FIGURE 29. UK QUANTUM PHOTONICS MARKET, 2022-2032 ($BILLION)
- FIGURE 30. FRANCE QUANTUM PHOTONICS MARKET, 2022-2032 ($BILLION)
- FIGURE 31. NETHERLANDS QUANTUM PHOTONICS MARKET, 2022-2032 ($BILLION)
- FIGURE 32. REST OF EUROPE QUANTUM PHOTONICS MARKET, 2022-2032 ($BILLION)
- FIGURE 33. CHINA QUANTUM PHOTONICS MARKET, 2022-2032 ($BILLION)
- FIGURE 34. JAPAN QUANTUM PHOTONICS MARKET, 2022-2032 ($BILLION)
- FIGURE 35. INDIA QUANTUM PHOTONICS MARKET, 2022-2032 ($BILLION)
- FIGURE 36. SOUTH KOREA QUANTUM PHOTONICS MARKET, 2022-2032 ($BILLION)
- FIGURE 37. REST OF ASIA-PACIFIC QUANTUM PHOTONICS MARKET, 2022-2032 ($BILLION)
- FIGURE 38. LATIN AMERICA QUANTUM PHOTONICS MARKET, 2022-2032 ($BILLION)
- FIGURE 39. MIDDLE EAST QUANTUM PHOTONICS MARKET, 2022-2032 ($BILLION)
- FIGURE 40. AFRICA QUANTUM PHOTONICS MARKET, 2022-2032 ($BILLION)
- FIGURE 41. TOP WINNING STRATEGIES, BY YEAR (2022-2023)
- FIGURE 42. TOP WINNING STRATEGIES, BY DEVELOPMENT (2022-2023)
- FIGURE 43. TOP WINNING STRATEGIES, BY COMPANY (2022-2023)
- FIGURE 44. PRODUCT MAPPING OF TOP 10 PLAYERS
- FIGURE 45. COMPETITIVE DASHBOARD
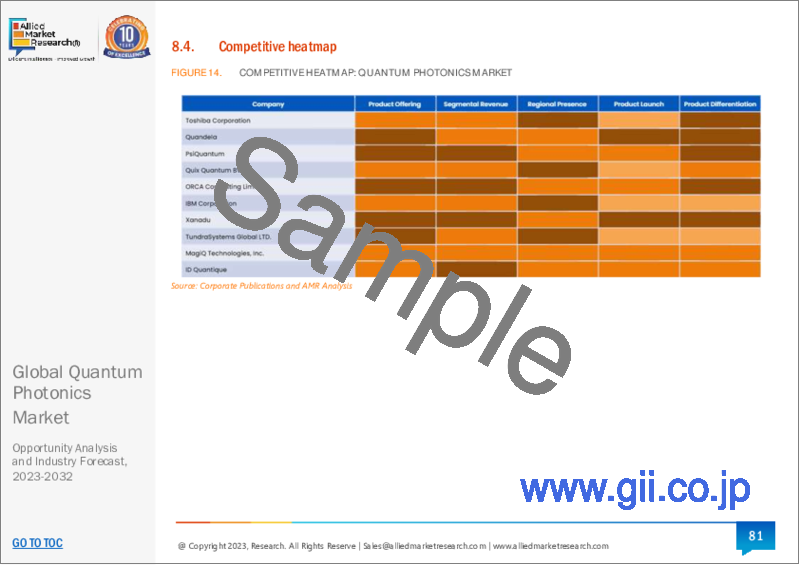
- FIGURE 46. COMPETITIVE HEATMAP: QUANTUM PHOTONICS MARKET
- FIGURE 47. TOP PLAYER POSITIONING, 2022
- FIGURE 48. TOSHIBA CORPORATION: NET SALES, 2020-2022 ($MILLION)
- FIGURE 49. IBM CORPORATION: NET REVENUE, 2020-2022 ($MILLION)
- FIGURE 50. IBM CORPORATION: RESEARCH & DEVELOPMENT EXPENDITURE, 2020-2022 ($MILLION)
- FIGURE 51. IBM CORPORATION: REVENUE SHARE BY SEGMENT, 2022 (%)
- FIGURE 52. IBM CORPORATION: REVENUE SHARE BY REGION, 2022 (%)
According to a new report published by Allied Market Research, titled, "Quantum Photonics Market," The quantum photonics market was valued at $0.30 billion in 2022, and is estimated to reach $5.3 billion by 2032, growing at a CAGR of 33.2% from 2023 to 2032.
Quantum photonics refers to the study, manipulation, and utilization of individual photons at the quantum level, where the principles of quantum mechanics govern their behavior. It involves harnessing the unique properties of photons, such as superposition and entanglement, to create advanced technologies and applications. Quantum photonics plays a crucial role in various fields, including quantum computing, quantum communication, quantum cryptography, quantum sensing, and quantum metrology. The goal of quantum photonics is to leverage the fundamental properties of light particles to enable transformative advancements in information processing, communication, and precision measurements that go beyond the capabilities of classical photonic systems.
Raw materials used to produce quantum photonics devices typically include specialized semiconductors, optical components, and superconducting materials. These materials are carefully engineered to exhibit specific quantum properties and interactions with light, enabling the manipulation and control of individual photons for various quantum technologies and applications.
The major end users of quantum photonics include industries such as telecommunications, information technology, defense, finance, and research institutions. These sectors leverage quantum photonics technologies for secure communication, quantum computing, advanced sensing, cryptography, and other transformative applications.
The growth of the global quantum photonics market is driven by strategic investments. With substantial financial support from governments and private entities, quantum photonics research advances, collaborations flourish, and commercialization efforts accelerate. These investments attract top talent, establish a robust quantum industry ecosystem, and enhance global competitiveness in achieving quantum supremacy. Furthermore, the growing demand for secure and high-performance solutions represents a substantial opportunity for the quantum photonics market. As cybersecurity risks escalate, the need for secure communication and cryptography systems based on quantum photonics principles is on the rise. Moreover, the ability of quantum photonics to shift computational power through quantum computers, which handle sophisticated issues beyond the capability of classical computers, offers lucrative opportunities during the forecast period.
However, limited scalability and upgradeability of quantum photonics can pose challenges for the market growth and enhancements of systems, potentially requiring a complete redesign or migration to more capable platforms.
The primary goal of quantum photonics is to leverage the unique properties of individual photons at the quantum level to develop advanced technologies and applications that exploit the principles of quantum mechanics. Quantum photonics aims to achieve transformative advancements in various fields, including quantum computing, quantum communication, quantum cryptography, quantum sensing, and quantum metrology by controlling and manipulating photons in quantum systems.
The quantum photonics market is segmented on the basis of offering, application, vertical, and region. By offering, the market is divided into systems and services. By application, the market is classified into quantum communication, quantum computing, quantum sensing, and metrology. By vertical, the market is segmented into banking and finance, space and defense, healthcare, transportation and logistics, government, and others.
By region, it is analyzed across North America (the U.S., Canada, and Mexico), Europe (UK, Germany, France, and rest of Europe), Asia-Pacific (China, Japan, India, South Korea, and rest of Asia-Pacific), and LAMEA (Latin America, the Middle East, and Africa).
- Competitive analysis and profiles of the major quantum photonics market players, such as Toshiba, Xanadu, Quandela, ID Quantique, ORCA Computing Limited, PsiQuantum, Tundra Systems Global LTD., Quix Quantum BV, IBM, and MagiQ Technologies are provided in this report. Market players have adopted various strategies such as product launch, partnerships, and acquisitions, to expand their foothold in the quantum photonics market.
Key Benefits For Stakeholders
- This report provides a quantitative analysis of the market segments, current trends, estimations, and dynamics of the quantum photonics market analysis from 2022 to 2032 to identify the prevailing quantum photonics market opportunities.
- The market research is offered along with information related to key drivers, restraints, and opportunities.
- Porter's five forces analysis highlights the potency of buyers and suppliers to enable stakeholders make profit-oriented business decisions and strengthen their supplier-buyer network.
- In-depth analysis of the quantum photonics market segmentation assists to determine the prevailing market opportunities.
- Major countries in each region are mapped according to their revenue contribution to the global market.
- Market player positioning facilitates benchmarking and provides a clear understanding of the present position of the market players.
- The report includes the analysis of the regional as well as global quantum photonics market trends, key players, market segments, application areas, and market growth strategies.
Additional benefits you will get with this purchase are:
- Quarterly Update and* (only available with a corporate license, on listed price)
- 5 additional Company Profile of client Choice pre- or Post-purchase, as a free update.
- Free Upcoming Version on the Purchase of Five and Enterprise User License.
- 16 analyst hours of support* (post-purchase, if you find additional data requirements upon review of the report, you may receive support amounting to 16 analyst hours to solve questions, and post-sale queries)
- 15% Free Customization* (in case the scope or segment of the report does not match your requirements, 20% is equivalent to 3 working days of free work, applicable once)
- Free data Pack on the Five and Enterprise User License. (Excel version of the report)
- Free Updated report if the report is 6-12 months old or older.
- 24-hour priority response*
- Free Industry updates and white papers.
Possible Customization with this report (with additional cost and timeline talk to the sales executive to know more)
- Product Life Cycles
- Market share analysis of players by products/segments
- Additional company profiles with specific to client's interest
- Additional country or region analysis- market size and forecast
- Expanded list for Company Profiles
- Key player details (including location, contact details, supplier/vendor network etc. in excel format)
- Market share analysis of players at global/region/country level
Key Market Segments
By Offering
- Systems
- Services
By Application
- Quantum Computing
- Quantum Sensing and Metrology
- Quantum Communication
By Verticals
- Banking and Finance
- Space and Defense
- Healthcare
- Transportation and Logistics
- Government
- Others
By Region
- North America
- U.S.
- Canada
- Mexico
- Europe
- Germany
- UK
- France
- Netherlands
- Rest of Europe
- Asia-Pacific
- China
- Japan
- India
- South Korea
- Rest of Asia-Pacific
- LAMEA
- Latin America
- Middle East
- Africa
Key Market Players:
- Toshiba Corporation
- PsiQuantum
- Quix Quantum BV
- IBM Corporation
- Xanadu
- ID Quantique
- Quandela
- ORCA Computing Limited
- TundraSystems Global LTD.
- MagiQ Technologies, Inc.
TABLE OF CONTENTS
CHAPTER 1: INTRODUCTION
- 1.1. Report description
- 1.2. Key market segments
- 1.3. Key benefits to the stakeholders
- 1.4. Research Methodology
- 1.4.1. Primary research
- 1.4.2. Secondary research
- 1.4.3. Analyst tools and models
CHAPTER 2: EXECUTIVE SUMMARY
- 2.1. CXO Perspective
CHAPTER 3: MARKET OVERVIEW
- 3.1. Market definition and scope
- 3.2. Key findings
- 3.2.1. Top impacting factors
- 3.2.2. Top investment pockets
- 3.3. Porter's five forces analysis
- 3.3.1. Moderate to high bargaining power of suppliers
- 3.3.2. Moderate threat of new entrants
- 3.3.3. Low to moderate threat of substitutes
- 3.3.4. Low to high intensity of rivalry
- 3.3.5. Moderte bargaining power of buyers
- 3.4. Market dynamics
- 3.4.1. Drivers
- 3.4.1.1. Increase in demand for secure communication
- 3.4.1.2. Advancements in quantum technologies
- 3.4.1. Drivers
- 3.4.2. Restraints
- 3.4.2.1. High cost in manufacturing process
- 3.4.3. Opportunities
- 3.4.3.1. Increase in demand for secure and high-performance solutions
- 3.5. COVID-19 Impact Analysis on the market
CHAPTER 4: QUANTUM PHOTONICS MARKET, BY OFFERING
- 4.1. Overview
- 4.1.1. Market size and forecast
- 4.2. Systems
- 4.2.1. Key market trends, growth factors and opportunities
- 4.2.2. Market size and forecast, by region
- 4.2.3. Market share analysis by country
- 4.3. Services
- 4.3.1. Key market trends, growth factors and opportunities
- 4.3.2. Market size and forecast, by region
- 4.3.3. Market share analysis by country
CHAPTER 5: QUANTUM PHOTONICS MARKET, BY APPLICATION
- 5.1. Overview
- 5.1.1. Market size and forecast
- 5.2. Quantum Communication
- 5.2.1. Key market trends, growth factors and opportunities
- 5.2.2. Market size and forecast, by region
- 5.2.3. Market share analysis by country
- 5.3. Quantum Computing
- 5.3.1. Key market trends, growth factors and opportunities
- 5.3.2. Market size and forecast, by region
- 5.3.3. Market share analysis by country
- 5.4. Quantum Sensing and Metrology
- 5.4.1. Key market trends, growth factors and opportunities
- 5.4.2. Market size and forecast, by region
- 5.4.3. Market share analysis by country
CHAPTER 6: QUANTUM PHOTONICS MARKET, BY VERTICALS
- 6.1. Overview
- 6.1.1. Market size and forecast
- 6.2. Banking and Finance
- 6.2.1. Key market trends, growth factors and opportunities
- 6.2.2. Market size and forecast, by region
- 6.2.3. Market share analysis by country
- 6.3. Space and Defense
- 6.3.1. Key market trends, growth factors and opportunities
- 6.3.2. Market size and forecast, by region
- 6.3.3. Market share analysis by country
- 6.4. Healthcare
- 6.4.1. Key market trends, growth factors and opportunities
- 6.4.2. Market size and forecast, by region
- 6.4.3. Market share analysis by country
- 6.5. Transportation and Logistics
- 6.5.1. Key market trends, growth factors and opportunities
- 6.5.2. Market size and forecast, by region
- 6.5.3. Market share analysis by country
- 6.6. Government
- 6.6.1. Key market trends, growth factors and opportunities
- 6.6.2. Market size and forecast, by region
- 6.6.3. Market share analysis by country
- 6.7. Others
- 6.7.1. Key market trends, growth factors and opportunities
- 6.7.2. Market size and forecast, by region
- 6.7.3. Market share analysis by country
CHAPTER 7: QUANTUM PHOTONICS MARKET, BY REGION
- 7.1. Overview
- 7.1.1. Market size and forecast By Region
- 7.2. North America
- 7.2.1. Key market trends, growth factors and opportunities
- 7.2.2. Market size and forecast, by Offering
- 7.2.3. Market size and forecast, by Application
- 7.2.4. Market size and forecast, by Verticals
- 7.2.5. Market size and forecast, by country
- 7.2.5.1. U.S.
- 7.2.5.1.1. Market size and forecast, by Offering
- 7.2.5.1.2. Market size and forecast, by Application
- 7.2.5.1.3. Market size and forecast, by Verticals
- 7.2.5.2. Canada
- 7.2.5.2.1. Market size and forecast, by Offering
- 7.2.5.2.2. Market size and forecast, by Application
- 7.2.5.2.3. Market size and forecast, by Verticals
- 7.2.5.3. Mexico
- 7.2.5.3.1. Market size and forecast, by Offering
- 7.2.5.3.2. Market size and forecast, by Application
- 7.2.5.3.3. Market size and forecast, by Verticals
- 7.3. Europe
- 7.3.1. Key market trends, growth factors and opportunities
- 7.3.2. Market size and forecast, by Offering
- 7.3.3. Market size and forecast, by Application
- 7.3.4. Market size and forecast, by Verticals
- 7.3.5. Market size and forecast, by country
- 7.3.5.1. Germany
- 7.3.5.1.1. Market size and forecast, by Offering
- 7.3.5.1.2. Market size and forecast, by Application
- 7.3.5.1.3. Market size and forecast, by Verticals
- 7.3.5.2. UK
- 7.3.5.2.1. Market size and forecast, by Offering
- 7.3.5.2.2. Market size and forecast, by Application
- 7.3.5.2.3. Market size and forecast, by Verticals
- 7.3.5.3. France
- 7.3.5.3.1. Market size and forecast, by Offering
- 7.3.5.3.2. Market size and forecast, by Application
- 7.3.5.3.3. Market size and forecast, by Verticals
- 7.3.5.4. Netherlands
- 7.3.5.4.1. Market size and forecast, by Offering
- 7.3.5.4.2. Market size and forecast, by Application
- 7.3.5.4.3. Market size and forecast, by Verticals
- 7.3.5.5. Rest of Europe
- 7.3.5.5.1. Market size and forecast, by Offering
- 7.3.5.5.2. Market size and forecast, by Application
- 7.3.5.5.3. Market size and forecast, by Verticals
- 7.4. Asia-Pacific
- 7.4.1. Key market trends, growth factors and opportunities
- 7.4.2. Market size and forecast, by Offering
- 7.4.3. Market size and forecast, by Application
- 7.4.4. Market size and forecast, by Verticals
- 7.4.5. Market size and forecast, by country
- 7.4.5.1. China
- 7.4.5.1.1. Market size and forecast, by Offering
- 7.4.5.1.2. Market size and forecast, by Application
- 7.4.5.1.3. Market size and forecast, by Verticals
- 7.4.5.2. Japan
- 7.4.5.2.1. Market size and forecast, by Offering
- 7.4.5.2.2. Market size and forecast, by Application
- 7.4.5.2.3. Market size and forecast, by Verticals
- 7.4.5.3. India
- 7.4.5.3.1. Market size and forecast, by Offering
- 7.4.5.3.2. Market size and forecast, by Application
- 7.4.5.3.3. Market size and forecast, by Verticals
- 7.4.5.4. South Korea
- 7.4.5.4.1. Market size and forecast, by Offering
- 7.4.5.4.2. Market size and forecast, by Application
- 7.4.5.4.3. Market size and forecast, by Verticals
- 7.4.5.5. Rest of Asia-Pacific
- 7.4.5.5.1. Market size and forecast, by Offering
- 7.4.5.5.2. Market size and forecast, by Application
- 7.4.5.5.3. Market size and forecast, by Verticals
- 7.5. LAMEA
- 7.5.1. Key market trends, growth factors and opportunities
- 7.5.2. Market size and forecast, by Offering
- 7.5.3. Market size and forecast, by Application
- 7.5.4. Market size and forecast, by Verticals
- 7.5.5. Market size and forecast, by country
- 7.5.5.1. Latin America
- 7.5.5.1.1. Market size and forecast, by Offering
- 7.5.5.1.2. Market size and forecast, by Application
- 7.5.5.1.3. Market size and forecast, by Verticals
- 7.5.5.2. Middle East
- 7.5.5.2.1. Market size and forecast, by Offering
- 7.5.5.2.2. Market size and forecast, by Application
- 7.5.5.2.3. Market size and forecast, by Verticals
- 7.5.5.3. Africa
- 7.5.5.3.1. Market size and forecast, by Offering
- 7.5.5.3.2. Market size and forecast, by Application
- 7.5.5.3.3. Market size and forecast, by Verticals
CHAPTER 8: COMPETITIVE LANDSCAPE
- 8.1. Introduction
- 8.2. Top winning strategies
- 8.3. Product Mapping of Top 10 Player
- 8.4. Competitive Dashboard
- 8.5. Competitive Heatmap
- 8.6. Top player positioning, 2022
CHAPTER 9: COMPANY PROFILES
- 9.1. Toshiba Corporation
- 9.1.1. Company overview
- 9.1.2. Key Executives
- 9.1.3. Company snapshot
- 9.1.4. Operating business segments
- 9.1.5. Product portfolio
- 9.1.6. Business performance
- 9.2. Xanadu
- 9.2.1. Company overview
- 9.2.2. Key Executives
- 9.2.3. Company snapshot
- 9.2.4. Operating business segments
- 9.2.5. Product portfolio
- 9.2.6. Key strategic moves and developments
- 9.3. Quandela
- 9.3.1. Company overview
- 9.3.2. Key Executives
- 9.3.3. Company snapshot
- 9.3.4. Operating business segments
- 9.3.5. Product portfolio
- 9.3.6. Key strategic moves and developments
- 9.4. ID Quantique
- 9.4.1. Company overview
- 9.4.2. Key Executives
- 9.4.3. Company snapshot
- 9.4.4. Operating business segments
- 9.4.5. Product portfolio
- 9.5. ORCA Computing Limited
- 9.5.1. Company overview
- 9.5.2. Key Executives
- 9.5.3. Company snapshot
- 9.5.4. Operating business segments
- 9.5.5. Product portfolio
- 9.6. PsiQuantum
- 9.6.1. Company overview
- 9.6.2. Key Executives
- 9.6.3. Company snapshot
- 9.6.4. Operating business segments
- 9.6.5. Product portfolio
- 9.7. TundraSystems Global LTD.
- 9.7.1. Company overview
- 9.7.2. Key Executives
- 9.7.3. Company snapshot
- 9.7.4. Operating business segments
- 9.7.5. Product portfolio
- 9.8. Quix Quantum BV
- 9.8.1. Company overview
- 9.8.2. Key Executives
- 9.8.3. Company snapshot
- 9.8.4. Operating business segments
- 9.8.5. Product portfolio
- 9.9. IBM Corporation
- 9.9.1. Company overview
- 9.9.2. Key Executives
- 9.9.3. Company snapshot
- 9.9.4. Operating business segments
- 9.9.5. Product portfolio
- 9.9.6. Business performance
- 9.10. MagiQ Technologies, Inc.
- 9.10.1. Company overview
- 9.10.2. Key Executives
- 9.10.3. Company snapshot
- 9.10.4. Operating business segments
- 9.10.5. Product portfolio
