
|
市場調査レポート
商品コード
1365776
メッセージングセキュリティ市場:コンポーネント別、通信モード別、展開モード別、エンドユーザー別:世界の機会分析と産業予測、2023~2032年Messaging Security Market By Component, By Communication Mode, By Deployment Mode, By End User : Global Opportunity Analysis and Industry Forecast, 2023-2032 |
||||||
|
|||||||

| メッセージングセキュリティ市場:コンポーネント別、通信モード別、展開モード別、エンドユーザー別:世界の機会分析と産業予測、2023~2032年 |
|
出版日: 2023年08月01日
発行: Allied Market Research
ページ情報: 英文 372 Pages
納期: 2~3営業日
|

- 全表示
- 概要
- 図表
- 目次
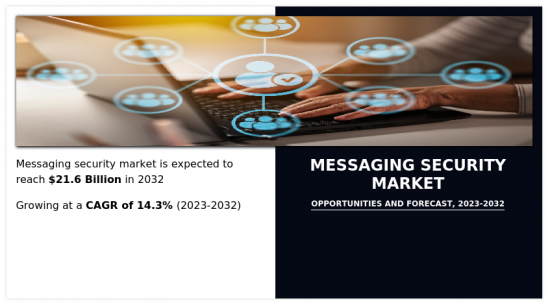
メッセージングセキュリティ市場の2022年の市場規模は59億米ドルで、2032年には216億米ドルに達し、2023年から2032年までのCAGRは14.3%で成長すると予測されています。
メッセージングセキュリティとしても知られるクラウドコンピューティング技術は、保護されたCPUエンクレーブを使って機密データを保護し、処理中の機密データを隔離します。許可されたプログラミングコードのみがエンクレーブにアクセスできるため、データと処理方法は隠され、クラウドプロバイダーを含む他のいかなるエンティティからもアクセスできないです。組織のリーダーがパブリッククラウドやハイブリッドクラウドサービスに依存するようになるにつれ、クラウドにおけるデータプライバシーの重要性は増しています。メッセージングセキュリティの主な目的は、クラウドに保存されたデータのセキュリティと機密性について、エグゼクティブに大きな保証を与えることです。その目的は、経営陣が最大限の機密データとコンピューティングワークロードをパブリッククラウドサービスに移行する動機付けを与えることです。信頼された実行環境(Trusted Execution Environment:TEEs)には、任意のコードの実行を許可するものもあれば、あまり機能を持たないものもあります。さらに、その適応性により、インフラやシステムは特定のセキュリティ要件を満たすようにカスタマイズされます。さらに、特定のTEEは、生産中に決定される設定コードを持つかもしれないです。信頼された実行環境を使用することで、メッセージングセキュリティソフトウェアは、データを保護することに加えて、コードを不正な第三者から保護します。このセキュリティの向上は、アルゴリズムや機密性の高い知的財産に対する高度な保護を提供します。
目次
第1章 イントロダクション
第2章 エグゼクティブサマリー
第3章 市場概要
- 市場の定義と範囲
- 主な調査結果
- 影響要因
- 主な投資機会
- ポーターのファイブフォース分析
- 市場力学
- 促進要因
- オンライン上の脅威の増加
- 規則や規制の必要性の増加
- 抑制要因
- セキュリティソリューションの導入コストの上昇と複雑化
- 機会
- クラウドプラットフォームの採用増加
- 促進要因
- COVID-19市場への影響分析
第4章 メッセージングセキュリティ市場:コンポーネント別
- 概要
- ソリューション
- サービス
第5章 メッセージングセキュリティ市場:通信モード別
- 概要
- 電子メール
- インスタントメッセージング
第6章 メッセージングセキュリティ市場:展開モード別
- 概要
- オンプレミス
- クラウド
第7章 メッセージングセキュリティ市場:エンドユーザー別
- 概要
- BFSI
- 政府・防衛
- 医療
- 小売・eコマース
- メディア・エンターテイメント
- 製造業
- その他
第8章 メッセージングセキュリティ市場:地域別
- 概要
- 北米
- 米国
- カナダ
- 欧州
- 英国
- ドイツ
- フランス
- イタリア
- スペイン
- その他
- アジア太平洋
- 中国
- 日本
- インド
- オーストラリア
- 韓国
- その他
- ラテンアメリカ
- ラテンアメリカ
- 中東
- アフリカ
第9章 競合情勢
- イントロダクション
- 主要成功戦略
- 主要10社の製品マッピング
- 競合ダッシュボード
- 競合ヒートマップ
- 主要企業のポジショニング、2022年
第10章 企業プロファイル
- McAfee, LLC
- Cisco Systems, Inc.
- Trend Micro Incorporated
- Microsoft Corporation
- Broadcom
- Proofpoint, Inc.
- Sophos Ltd.
- Barracuda Networks, Inc.
- F-Secure
- Check Point Software Technologies Ltd.
LIST OF TABLES
- TABLE 01. GLOBAL MESSAGING SECURITY MARKET, BY COMPONENT, 2022-2032 ($MILLION)
- TABLE 02. MESSAGING SECURITY MARKET FOR SOLUTION, BY REGION, 2022-2032 ($MILLION)
- TABLE 03. MESSAGING SECURITY MARKET FOR SERVICE, BY REGION, 2022-2032 ($MILLION)
- TABLE 04. GLOBAL MESSAGING SECURITY MARKET, BY COMMUNICATION MODE, 2022-2032 ($MILLION)
- TABLE 05. MESSAGING SECURITY MARKET FOR EMAIL, BY REGION, 2022-2032 ($MILLION)
- TABLE 06. MESSAGING SECURITY MARKET FOR INSTANT MESSAGING, BY REGION, 2022-2032 ($MILLION)
- TABLE 07. GLOBAL MESSAGING SECURITY MARKET, BY DEPLOYMENT MODE, 2022-2032 ($MILLION)
- TABLE 08. MESSAGING SECURITY MARKET FOR ON-PREMISE, BY REGION, 2022-2032 ($MILLION)
- TABLE 09. MESSAGING SECURITY MARKET FOR CLOUD, BY REGION, 2022-2032 ($MILLION)
- TABLE 10. GLOBAL MESSAGING SECURITY MARKET, BY END USER, 2022-2032 ($MILLION)
- TABLE 11. MESSAGING SECURITY MARKET FOR BFSI, BY REGION, 2022-2032 ($MILLION)
- TABLE 12. MESSAGING SECURITY MARKET FOR GOVERNMENT AND DEFENSE, BY REGION, 2022-2032 ($MILLION)
- TABLE 13. MESSAGING SECURITY MARKET FOR HEALTHCARE, BY REGION, 2022-2032 ($MILLION)
- TABLE 14. MESSAGING SECURITY MARKET FOR RETAIL AND E-COMMERCE, BY REGION, 2022-2032 ($MILLION)
- TABLE 15. MESSAGING SECURITY MARKET FOR MEDIA AND ENTERTAINMENT, BY REGION, 2022-2032 ($MILLION)
- TABLE 16. MESSAGING SECURITY MARKET FOR MANUFACTURING, BY REGION, 2022-2032 ($MILLION)
- TABLE 17. MESSAGING SECURITY MARKET FOR OTHERS, BY REGION, 2022-2032 ($MILLION)
- TABLE 18. MESSAGING SECURITY MARKET, BY REGION, 2022-2032 ($MILLION)
- TABLE 19. NORTH AMERICA MESSAGING SECURITY MARKET, BY COMPONENT, 2022-2032 ($MILLION)
- TABLE 20. NORTH AMERICA MESSAGING SECURITY MARKET, BY COMMUNICATION MODE, 2022-2032 ($MILLION)
- TABLE 21. NORTH AMERICA MESSAGING SECURITY MARKET, BY DEPLOYMENT MODE, 2022-2032 ($MILLION)
- TABLE 22. NORTH AMERICA MESSAGING SECURITY MARKET, BY END USER, 2022-2032 ($MILLION)
- TABLE 23. NORTH AMERICA MESSAGING SECURITY MARKET, BY COUNTRY, 2022-2032 ($MILLION)
- TABLE 24. U.S. MESSAGING SECURITY MARKET, BY COMPONENT, 2022-2032 ($MILLION)
- TABLE 25. U.S. MESSAGING SECURITY MARKET, BY COMMUNICATION MODE, 2022-2032 ($MILLION)
- TABLE 26. U.S. MESSAGING SECURITY MARKET, BY DEPLOYMENT MODE, 2022-2032 ($MILLION)
- TABLE 27. U.S. MESSAGING SECURITY MARKET, BY END USER, 2022-2032 ($MILLION)
- TABLE 28. CANADA MESSAGING SECURITY MARKET, BY COMPONENT, 2022-2032 ($MILLION)
- TABLE 29. CANADA MESSAGING SECURITY MARKET, BY COMMUNICATION MODE, 2022-2032 ($MILLION)
- TABLE 30. CANADA MESSAGING SECURITY MARKET, BY DEPLOYMENT MODE, 2022-2032 ($MILLION)
- TABLE 31. CANADA MESSAGING SECURITY MARKET, BY END USER, 2022-2032 ($MILLION)
- TABLE 32. EUROPE MESSAGING SECURITY MARKET, BY COMPONENT, 2022-2032 ($MILLION)
- TABLE 33. EUROPE MESSAGING SECURITY MARKET, BY COMMUNICATION MODE, 2022-2032 ($MILLION)
- TABLE 34. EUROPE MESSAGING SECURITY MARKET, BY DEPLOYMENT MODE, 2022-2032 ($MILLION)
- TABLE 35. EUROPE MESSAGING SECURITY MARKET, BY END USER, 2022-2032 ($MILLION)
- TABLE 36. EUROPE MESSAGING SECURITY MARKET, BY COUNTRY, 2022-2032 ($MILLION)
- TABLE 37. UK MESSAGING SECURITY MARKET, BY COMPONENT, 2022-2032 ($MILLION)
- TABLE 38. UK MESSAGING SECURITY MARKET, BY COMMUNICATION MODE, 2022-2032 ($MILLION)
- TABLE 39. UK MESSAGING SECURITY MARKET, BY DEPLOYMENT MODE, 2022-2032 ($MILLION)
- TABLE 40. UK MESSAGING SECURITY MARKET, BY END USER, 2022-2032 ($MILLION)
- TABLE 41. GERMANY MESSAGING SECURITY MARKET, BY COMPONENT, 2022-2032 ($MILLION)
- TABLE 42. GERMANY MESSAGING SECURITY MARKET, BY COMMUNICATION MODE, 2022-2032 ($MILLION)
- TABLE 43. GERMANY MESSAGING SECURITY MARKET, BY DEPLOYMENT MODE, 2022-2032 ($MILLION)
- TABLE 44. GERMANY MESSAGING SECURITY MARKET, BY END USER, 2022-2032 ($MILLION)
- TABLE 45. FRANCE MESSAGING SECURITY MARKET, BY COMPONENT, 2022-2032 ($MILLION)
- TABLE 46. FRANCE MESSAGING SECURITY MARKET, BY COMMUNICATION MODE, 2022-2032 ($MILLION)
- TABLE 47. FRANCE MESSAGING SECURITY MARKET, BY DEPLOYMENT MODE, 2022-2032 ($MILLION)
- TABLE 48. FRANCE MESSAGING SECURITY MARKET, BY END USER, 2022-2032 ($MILLION)
- TABLE 49. ITALY MESSAGING SECURITY MARKET, BY COMPONENT, 2022-2032 ($MILLION)
- TABLE 50. ITALY MESSAGING SECURITY MARKET, BY COMMUNICATION MODE, 2022-2032 ($MILLION)
- TABLE 51. ITALY MESSAGING SECURITY MARKET, BY DEPLOYMENT MODE, 2022-2032 ($MILLION)
- TABLE 52. ITALY MESSAGING SECURITY MARKET, BY END USER, 2022-2032 ($MILLION)
- TABLE 53. SPAIN MESSAGING SECURITY MARKET, BY COMPONENT, 2022-2032 ($MILLION)
- TABLE 54. SPAIN MESSAGING SECURITY MARKET, BY COMMUNICATION MODE, 2022-2032 ($MILLION)
- TABLE 55. SPAIN MESSAGING SECURITY MARKET, BY DEPLOYMENT MODE, 2022-2032 ($MILLION)
- TABLE 56. SPAIN MESSAGING SECURITY MARKET, BY END USER, 2022-2032 ($MILLION)
- TABLE 57. REST OF EUROPE MESSAGING SECURITY MARKET, BY COMPONENT, 2022-2032 ($MILLION)
- TABLE 58. REST OF EUROPE MESSAGING SECURITY MARKET, BY COMMUNICATION MODE, 2022-2032 ($MILLION)
- TABLE 59. REST OF EUROPE MESSAGING SECURITY MARKET, BY DEPLOYMENT MODE, 2022-2032 ($MILLION)
- TABLE 60. REST OF EUROPE MESSAGING SECURITY MARKET, BY END USER, 2022-2032 ($MILLION)
- TABLE 61. ASIA-PACIFIC MESSAGING SECURITY MARKET, BY COMPONENT, 2022-2032 ($MILLION)
- TABLE 62. ASIA-PACIFIC MESSAGING SECURITY MARKET, BY COMMUNICATION MODE, 2022-2032 ($MILLION)
- TABLE 63. ASIA-PACIFIC MESSAGING SECURITY MARKET, BY DEPLOYMENT MODE, 2022-2032 ($MILLION)
- TABLE 64. ASIA-PACIFIC MESSAGING SECURITY MARKET, BY END USER, 2022-2032 ($MILLION)
- TABLE 65. ASIA-PACIFIC MESSAGING SECURITY MARKET, BY COUNTRY, 2022-2032 ($MILLION)
- TABLE 66. CHINA MESSAGING SECURITY MARKET, BY COMPONENT, 2022-2032 ($MILLION)
- TABLE 67. CHINA MESSAGING SECURITY MARKET, BY COMMUNICATION MODE, 2022-2032 ($MILLION)
- TABLE 68. CHINA MESSAGING SECURITY MARKET, BY DEPLOYMENT MODE, 2022-2032 ($MILLION)
- TABLE 69. CHINA MESSAGING SECURITY MARKET, BY END USER, 2022-2032 ($MILLION)
- TABLE 70. JAPAN MESSAGING SECURITY MARKET, BY COMPONENT, 2022-2032 ($MILLION)
- TABLE 71. JAPAN MESSAGING SECURITY MARKET, BY COMMUNICATION MODE, 2022-2032 ($MILLION)
- TABLE 72. JAPAN MESSAGING SECURITY MARKET, BY DEPLOYMENT MODE, 2022-2032 ($MILLION)
- TABLE 73. JAPAN MESSAGING SECURITY MARKET, BY END USER, 2022-2032 ($MILLION)
- TABLE 74. INDIA MESSAGING SECURITY MARKET, BY COMPONENT, 2022-2032 ($MILLION)
- TABLE 75. INDIA MESSAGING SECURITY MARKET, BY COMMUNICATION MODE, 2022-2032 ($MILLION)
- TABLE 76. INDIA MESSAGING SECURITY MARKET, BY DEPLOYMENT MODE, 2022-2032 ($MILLION)
- TABLE 77. INDIA MESSAGING SECURITY MARKET, BY END USER, 2022-2032 ($MILLION)
- TABLE 78. AUSTRALIA MESSAGING SECURITY MARKET, BY COMPONENT, 2022-2032 ($MILLION)
- TABLE 79. AUSTRALIA MESSAGING SECURITY MARKET, BY COMMUNICATION MODE, 2022-2032 ($MILLION)
- TABLE 80. AUSTRALIA MESSAGING SECURITY MARKET, BY DEPLOYMENT MODE, 2022-2032 ($MILLION)
- TABLE 81. AUSTRALIA MESSAGING SECURITY MARKET, BY END USER, 2022-2032 ($MILLION)
- TABLE 82. SOUTH KOREA MESSAGING SECURITY MARKET, BY COMPONENT, 2022-2032 ($MILLION)
- TABLE 83. SOUTH KOREA MESSAGING SECURITY MARKET, BY COMMUNICATION MODE, 2022-2032 ($MILLION)
- TABLE 84. SOUTH KOREA MESSAGING SECURITY MARKET, BY DEPLOYMENT MODE, 2022-2032 ($MILLION)
- TABLE 85. SOUTH KOREA MESSAGING SECURITY MARKET, BY END USER, 2022-2032 ($MILLION)
- TABLE 86. REST OF ASIA-PACIFIC MESSAGING SECURITY MARKET, BY COMPONENT, 2022-2032 ($MILLION)
- TABLE 87. REST OF ASIA-PACIFIC MESSAGING SECURITY MARKET, BY COMMUNICATION MODE, 2022-2032 ($MILLION)
- TABLE 88. REST OF ASIA-PACIFIC MESSAGING SECURITY MARKET, BY DEPLOYMENT MODE, 2022-2032 ($MILLION)
- TABLE 89. REST OF ASIA-PACIFIC MESSAGING SECURITY MARKET, BY END USER, 2022-2032 ($MILLION)
- TABLE 90. LAMEA MESSAGING SECURITY MARKET, BY COMPONENT, 2022-2032 ($MILLION)
- TABLE 91. LAMEA MESSAGING SECURITY MARKET, BY COMMUNICATION MODE, 2022-2032 ($MILLION)
- TABLE 92. LAMEA MESSAGING SECURITY MARKET, BY DEPLOYMENT MODE, 2022-2032 ($MILLION)
- TABLE 93. LAMEA MESSAGING SECURITY MARKET, BY END USER, 2022-2032 ($MILLION)
- TABLE 94. LAMEA MESSAGING SECURITY MARKET, BY COUNTRY, 2022-2032 ($MILLION)
- TABLE 95. LATIN AMERICA MESSAGING SECURITY MARKET, BY COMPONENT, 2022-2032 ($MILLION)
- TABLE 96. LATIN AMERICA MESSAGING SECURITY MARKET, BY COMMUNICATION MODE, 2022-2032 ($MILLION)
- TABLE 97. LATIN AMERICA MESSAGING SECURITY MARKET, BY DEPLOYMENT MODE, 2022-2032 ($MILLION)
- TABLE 98. LATIN AMERICA MESSAGING SECURITY MARKET, BY END USER, 2022-2032 ($MILLION)
- TABLE 99. MIDDLE EAST MESSAGING SECURITY MARKET, BY COMPONENT, 2022-2032 ($MILLION)
- TABLE 100. MIDDLE EAST MESSAGING SECURITY MARKET, BY COMMUNICATION MODE, 2022-2032 ($MILLION)
- TABLE 101. MIDDLE EAST MESSAGING SECURITY MARKET, BY DEPLOYMENT MODE, 2022-2032 ($MILLION)
- TABLE 102. MIDDLE EAST MESSAGING SECURITY MARKET, BY END USER, 2022-2032 ($MILLION)
- TABLE 103. AFRICA MESSAGING SECURITY MARKET, BY COMPONENT, 2022-2032 ($MILLION)
- TABLE 104. AFRICA MESSAGING SECURITY MARKET, BY COMMUNICATION MODE, 2022-2032 ($MILLION)
- TABLE 105. AFRICA MESSAGING SECURITY MARKET, BY DEPLOYMENT MODE, 2022-2032 ($MILLION)
- TABLE 106. AFRICA MESSAGING SECURITY MARKET, BY END USER, 2022-2032 ($MILLION)
- TABLE 107. MCAFEE, LLC: KEY EXECUTIVES
- TABLE 108. MCAFEE, LLC: COMPANY SNAPSHOT
- TABLE 109. MCAFEE, LLC: PRODUCT SEGMENTS
- TABLE 110. MCAFEE, LLC: PRODUCT PORTFOLIO
- TABLE 111. CISCO SYSTEMS, INC.: KEY EXECUTIVES
- TABLE 112. CISCO SYSTEMS, INC.: COMPANY SNAPSHOT
- TABLE 113. CISCO SYSTEMS, INC.: SERVICE SEGMENTS
- TABLE 114. CISCO SYSTEMS, INC.: PRODUCT PORTFOLIO
- TABLE 115. CISCO SYSTEMS, INC.: KEY STRATERGIES
- TABLE 116. TREND MICRO INCORPORATED: KEY EXECUTIVES
- TABLE 117. TREND MICRO INCORPORATED: COMPANY SNAPSHOT
- TABLE 118. TREND MICRO INCORPORATED: SERVICE SEGMENTS
- TABLE 119. TREND MICRO INCORPORATED: PRODUCT PORTFOLIO
- TABLE 120. TREND MICRO INCORPORATED: KEY STRATERGIES
- TABLE 121. MICROSOFT CORPORATION: KEY EXECUTIVES
- TABLE 122. MICROSOFT CORPORATION: COMPANY SNAPSHOT
- TABLE 123. MICROSOFT CORPORATION: SERVICE SEGMENTS
- TABLE 124. MICROSOFT CORPORATION: PRODUCT PORTFOLIO
- TABLE 125. MICROSOFT CORPORATION: KEY STRATERGIES
- TABLE 126. BROADCOM: KEY EXECUTIVES
- TABLE 127. BROADCOM: COMPANY SNAPSHOT
- TABLE 128. BROADCOM: SERVICE SEGMENTS
- TABLE 129. BROADCOM: PRODUCT PORTFOLIO
- TABLE 130. BROADCOM: KEY STRATERGIES
- TABLE 131. PROOFPOINT, INC.: KEY EXECUTIVES
- TABLE 132. PROOFPOINT, INC.: COMPANY SNAPSHOT
- TABLE 133. PROOFPOINT, INC.: SERVICE SEGMENTS
- TABLE 134. PROOFPOINT, INC.: PRODUCT PORTFOLIO
- TABLE 135. PROOFPOINT, INC.: KEY STRATERGIES
- TABLE 136. SOPHOS LTD.: KEY EXECUTIVES
- TABLE 137. SOPHOS LTD.: COMPANY SNAPSHOT
- TABLE 138. SOPHOS LTD.: SERVICE SEGMENTS
- TABLE 139. SOPHOS LTD.: PRODUCT PORTFOLIO
- TABLE 140. SOPHOS LTD.: KEY STRATERGIES
- TABLE 141. BARRACUDA NETWORKS, INC.: KEY EXECUTIVES
- TABLE 142. BARRACUDA NETWORKS, INC.: COMPANY SNAPSHOT
- TABLE 143. BARRACUDA NETWORKS, INC.: SERVICE SEGMENTS
- TABLE 144. BARRACUDA NETWORKS, INC.: PRODUCT PORTFOLIO
- TABLE 145. BARRACUDA NETWORKS, INC.: KEY STRATERGIES
- TABLE 146. F-SECURE: KEY EXECUTIVES
- TABLE 147. F-SECURE: COMPANY SNAPSHOT
- TABLE 148. F-SECURE: SERVICE SEGMENTS
- TABLE 149. F-SECURE: PRODUCT PORTFOLIO
- TABLE 150. F-SECURE: KEY STRATERGIES
- TABLE 151. CHECK POINT SOFTWARE TECHNOLOGIES LTD.: KEY EXECUTIVES
- TABLE 152. CHECK POINT SOFTWARE TECHNOLOGIES LTD.: COMPANY SNAPSHOT
- TABLE 153. CHECK POINT SOFTWARE TECHNOLOGIES LTD.: SERVICE SEGMENTS
- TABLE 154. CHECK POINT SOFTWARE TECHNOLOGIES LTD.: PRODUCT PORTFOLIO
- TABLE 155. CHECK POINT SOFTWARE TECHNOLOGIES LTD.: KEY STRATERGIES
LIST OF FIGURES
- FIGURE 01. MESSAGING SECURITY MARKET, 2022-2032
- FIGURE 02. SEGMENTATION OF MESSAGING SECURITY MARKET,2022-2032
- FIGURE 03. TOP INVESTMENT POCKETS IN MESSAGING SECURITY MARKET (2023-2032)
- FIGURE 04. LOW BARGAINING POWER OF SUPPLIERS
- FIGURE 05. LOW THREAT OF NEW ENTRANTS
- FIGURE 06. LOW THREAT OF SUBSTITUTES
- FIGURE 07. LOW INTENSITY OF RIVALRY
- FIGURE 08. LOW BARGAINING POWER OF BUYERS
- FIGURE 09. GLOBAL MESSAGING SECURITY MARKET:DRIVERS, RESTRAINTS AND OPPORTUNITIES
- FIGURE 10. MESSAGING SECURITY MARKET, BY COMPONENT, 2022(%)
- FIGURE 11. COMPARATIVE SHARE ANALYSIS OF MESSAGING SECURITY MARKET FOR SOLUTION, BY COUNTRY 2022 AND 2032(%)
- FIGURE 12. COMPARATIVE SHARE ANALYSIS OF MESSAGING SECURITY MARKET FOR SERVICE, BY COUNTRY 2022 AND 2032(%)
- FIGURE 13. MESSAGING SECURITY MARKET, BY COMMUNICATION MODE, 2022(%)
- FIGURE 14. COMPARATIVE SHARE ANALYSIS OF MESSAGING SECURITY MARKET FOR EMAIL, BY COUNTRY 2022 AND 2032(%)
- FIGURE 15. COMPARATIVE SHARE ANALYSIS OF MESSAGING SECURITY MARKET FOR INSTANT MESSAGING, BY COUNTRY 2022 AND 2032(%)
- FIGURE 16. MESSAGING SECURITY MARKET, BY DEPLOYMENT MODE, 2022(%)
- FIGURE 17. COMPARATIVE SHARE ANALYSIS OF MESSAGING SECURITY MARKET FOR ON-PREMISE, BY COUNTRY 2022 AND 2032(%)
- FIGURE 18. COMPARATIVE SHARE ANALYSIS OF MESSAGING SECURITY MARKET FOR CLOUD, BY COUNTRY 2022 AND 2032(%)
- FIGURE 19. MESSAGING SECURITY MARKET, BY END USER, 2022(%)
- FIGURE 20. COMPARATIVE SHARE ANALYSIS OF MESSAGING SECURITY MARKET FOR BFSI, BY COUNTRY 2022 AND 2032(%)
- FIGURE 21. COMPARATIVE SHARE ANALYSIS OF MESSAGING SECURITY MARKET FOR GOVERNMENT AND DEFENSE, BY COUNTRY 2022 AND 2032(%)
- FIGURE 22. COMPARATIVE SHARE ANALYSIS OF MESSAGING SECURITY MARKET FOR HEALTHCARE, BY COUNTRY 2022 AND 2032(%)
- FIGURE 23. COMPARATIVE SHARE ANALYSIS OF MESSAGING SECURITY MARKET FOR RETAIL AND E-COMMERCE, BY COUNTRY 2022 AND 2032(%)
- FIGURE 24. COMPARATIVE SHARE ANALYSIS OF MESSAGING SECURITY MARKET FOR MEDIA AND ENTERTAINMENT, BY COUNTRY 2022 AND 2032(%)
- FIGURE 25. COMPARATIVE SHARE ANALYSIS OF MESSAGING SECURITY MARKET FOR MANUFACTURING, BY COUNTRY 2022 AND 2032(%)
- FIGURE 26. COMPARATIVE SHARE ANALYSIS OF MESSAGING SECURITY MARKET FOR OTHERS, BY COUNTRY 2022 AND 2032(%)
- FIGURE 27. MESSAGING SECURITY MARKET BY REGION, 2022(%)
- FIGURE 28. U.S. MESSAGING SECURITY MARKET, 2022-2032 ($MILLION)
- FIGURE 29. CANADA MESSAGING SECURITY MARKET, 2022-2032 ($MILLION)
- FIGURE 30. UK MESSAGING SECURITY MARKET, 2022-2032 ($MILLION)
- FIGURE 31. GERMANY MESSAGING SECURITY MARKET, 2022-2032 ($MILLION)
- FIGURE 32. FRANCE MESSAGING SECURITY MARKET, 2022-2032 ($MILLION)
- FIGURE 33. ITALY MESSAGING SECURITY MARKET, 2022-2032 ($MILLION)
- FIGURE 34. SPAIN MESSAGING SECURITY MARKET, 2022-2032 ($MILLION)
- FIGURE 35. REST OF EUROPE MESSAGING SECURITY MARKET, 2022-2032 ($MILLION)
- FIGURE 36. CHINA MESSAGING SECURITY MARKET, 2022-2032 ($MILLION)
- FIGURE 37. JAPAN MESSAGING SECURITY MARKET, 2022-2032 ($MILLION)
- FIGURE 38. INDIA MESSAGING SECURITY MARKET, 2022-2032 ($MILLION)
- FIGURE 39. AUSTRALIA MESSAGING SECURITY MARKET, 2022-2032 ($MILLION)
- FIGURE 40. SOUTH KOREA MESSAGING SECURITY MARKET, 2022-2032 ($MILLION)
- FIGURE 41. REST OF ASIA-PACIFIC MESSAGING SECURITY MARKET, 2022-2032 ($MILLION)
- FIGURE 42. LATIN AMERICA MESSAGING SECURITY MARKET, 2022-2032 ($MILLION)
- FIGURE 43. MIDDLE EAST MESSAGING SECURITY MARKET, 2022-2032 ($MILLION)
- FIGURE 44. AFRICA MESSAGING SECURITY MARKET, 2022-2032 ($MILLION)
- FIGURE 45. TOP WINNING STRATEGIES, BY YEAR (2021-2023)
- FIGURE 46. TOP WINNING STRATEGIES, BY DEVELOPMENT (2021-2023)
- FIGURE 47. TOP WINNING STRATEGIES, BY COMPANY (2021-2023)
- FIGURE 48. PRODUCT MAPPING OF TOP 10 PLAYERS
- FIGURE 49. COMPETITIVE DASHBOARD
- FIGURE 50. COMPETITIVE HEATMAP: MESSAGING SECURITY MARKET
- FIGURE 51. TOP PLAYER POSITIONING, 2022
- FIGURE 52. CISCO SYSTEMS, INC.: NET REVENUE, 2020-2022 ($MILLION)
- FIGURE 53. CISCO SYSTEMS, INC.: RESEARCH & DEVELOPMENT EXPENDITURE, 2020-2022 ($MILLION)
- FIGURE 54. CISCO SYSTEMS, INC.: REVENUE SHARE BY SEGMENT, 2022 (%)
- FIGURE 55. TREND MICRO INCORPORATED: NET REVENUE, 2019-2021 ($MILLION)
- FIGURE 56. TREND MICRO INCORPORATED: REVENUE SHARE BY REGION, 2021 (%)
- FIGURE 57. MICROSOFT CORPORATION: NET REVENUE, 2020-2022 ($MILLION)
- FIGURE 58. MICROSOFT CORPORATION: RESEARCH & DEVELOPMENT EXPENDITURE, 2020-2022 ($MILLION)
- FIGURE 59. MICROSOFT CORPORATION: REVENUE SHARE BY SEGMENT, 2022 (%)
- FIGURE 60. MICROSOFT CORPORATION: REVENUE SHARE BY REGION, 2022 (%)
- FIGURE 61. BROADCOM: NET REVENUE, 2020-2022 ($MILLION)
- FIGURE 62. BROADCOM: RESEARCH & DEVELOPMENT EXPENDITURE, 2020-2022 ($MILLION)
- FIGURE 63. BROADCOM: REVENUE SHARE BY SEGMENT, 2022 (%)
- FIGURE 64. BROADCOM: REVENUE SHARE BY REGION, 2022 (%)
- FIGURE 65. PROOFPOINT, INC.: SALES REVENUE, 2018-2020 ($MILLION)
- FIGURE 66. PROOFPOINT, INC.: REVENUE SHARE BY REGION, 2020 (%)
- FIGURE 67. BARRACUDA NETWORKS, INC.: NET REVENUE, 2019-2021 ($MILLION)
- FIGURE 68. BARRACUDA NETWORKS, INC.: REVENUE SHARE BY SEGMENT, 2021 (%)
- FIGURE 69. F-SECURE: NET REVENUE, 2019-2021 ($MILLION)
- FIGURE 70. F-SECURE: RESEARCH & DEVELOPMENT EXPENDITURE, 2019-2021 ($MILLION)
- FIGURE 71. F-SECURE: REVENUE SHARE BY REGION, 2021 (%)
- FIGURE 72. CHECK POINT SOFTWARE TECHNOLOGIES LTD.: NET REVENUE, 2020-2022 ($MILLION)
- FIGURE 73. CHECK POINT SOFTWARE TECHNOLOGIES LTD.: REVENUE SHARE BY REGION, 2022 (%)
According to a new report published by Allied Market Research, titled, "Messaging Security Market," The messaging security market was valued at $5.9 billion in 2022, and is estimated to reach $21.6 billion by 2032, growing at a CAGR of 14.3% from 2023 to 2032. Cloud computing technology, also known as messaging security, protects sensitive data using a protected CPU enclave to isolate sensitive data during processing. The data and processing methods are hidden and inaccessible to any other entity, including the cloud provider, as only authorized programming code has access to the enclave. Data privacy in the cloud is more important as organizational leaders depend more on public and hybrid cloud services. The major goal of messaging security is to give executives greater assurance about the security and confidentiality of their cloud-stored data. Its purpose is to motivate executives to move their maximum sensitive data and computing workloads to public cloud services. Some trusted execution environments (TEEs) permit the execution of arbitrary code while others have less capabilities. Moreover, due to its adaptability, the infrastructure or system is customized to fulfil certain security requirements. Furthermore, certain TEEs might have set codes that are determined during production. Using a trusted execution environment, messaging security software protects the code from unauthorized parties in addition to securing the data. This improved security offers advanced protection for algorithms and sensitive intellectual property.
The messaging security market is segmented on the basis of component, communication mode, deployment mode, end user, and region. On the basis of component, it is classified into solution and services. On the basis of communication mode, it is categorized into email and instant messaging. On the basis of deployment mode, it is segregated into on-premise and cloud. On the basis of end user, it is fragmented into BFSI, retail & e-commerce, healthcare, government and defense, media and entertainment, manufacturing, and others. Region-wise, it is analyzed across North America, Europe, Asia-Pacific, and LAMEA.
The global messaging security industry is dominated by key players such as Mcafee, Llc, Cisco Systems, Inc., Trend Micro Incorporated, Microsoft Corporation, Broadcom, Proofpoint, Inc., Sophos Ltd., Barracuda Networks, Inc., F-Secure, and Check Point Software Technologies Ltd. These players have adopted various strategies to increase their market penetration and strengthen their position in the messaging security market.
Key Benefits for Stakeholders
- This report provides a quantitative analysis of the market segments, current trends, estimations, and dynamics of the messaging security market analysis from 2022 to 2032 to identify the prevailing messaging security market opportunities.
- The market research is offered along with information related to key drivers, restraints, and opportunities.
- Porter's five forces analysis highlights the potency of buyers and suppliers to enable stakeholders make profit-oriented business decisions and strengthen their supplier-buyer network.
- In-depth analysis of the messaging security market segmentation assists to determine the prevailing market opportunities.
- Major countries in each region are mapped according to their revenue contribution to the global market.
- Market player positioning facilitates benchmarking and provides a clear understanding of the present position of the market players.
- The report includes the analysis of the regional as well as global messaging security market trends, key players, market segments, application areas, and market growth strategies.
Additional benefits you will get with this purchase are:
- Quarterly Update and* (only available with a corporate license, on listed price)
- 5 additional Company Profile of client Choice pre- or Post-purchase, as a free update.
- Free Upcoming Version on the Purchase of Five and Enterprise User License.
- 16 analyst hours of support* (post-purchase, if you find additional data requirements upon review of the report, you may receive support amounting to 16 analyst hours to solve questions, and post-sale queries)
- 15% Free Customization* (in case the scope or segment of the report does not match your requirements, 20% is equivalent to 3 working days of free work, applicable once)
- Free data Pack on the Five and Enterprise User License. (Excel version of the report)
- Free Updated report if the report is 6-12 months old or older.
- 24-hour priority response*
- Free Industry updates and white papers.
Possible Customization with this report (with additional cost and timeline talk to the sales executive to know more)
- Senario Analysis & Growth Trend Comparision
- Regulatory Guidelines
- Additional company profiles with specific to client's interest
- Criss-cross segment analysis- market size and forecast
- Expanded list for Company Profiles
- Historic market data
- Key player details (including location, contact details, supplier/vendor network etc. in excel format)
- Market share analysis of players at global/region/country level
- SWOT Analysis
Key Market Segments
By Component
- Solution
- Service
By Communication Mode
- Instant Messaging
By Deployment Mode
- On-premise
- Cloud
By End User
- BFSI
- Government and Defense
- Healthcare
- Retail and E-commerce
- Media and Entertainment
- Manufacturing
- Others
By Region
- North America
- U.S.
- Canada
- Europe
- UK
- Germany
- France
- Italy
- Spain
- Rest of Europe
- Asia-Pacific
- China
- Japan
- India
- Australia
- South Korea
- Rest of Asia-Pacific
- LAMEA
- Latin America
- Middle East
- Africa
Key Market Players:
- McAfee, LLC
- Cisco Systems, Inc.
- Trend Micro Incorporated
- Microsoft Corporation
- Broadcom
- Proofpoint, Inc.
- Sophos Ltd.
- Barracuda Networks, Inc.
- Check Point Software Technologies Ltd.
- F-Secure
TABLE OF CONTENTS
CHAPTER 1: INTRODUCTION
- 1.1. Report description
- 1.2. Key market segments
- 1.3. Key benefits to the stakeholders
- 1.4. Research Methodology
- 1.4.1. Primary research
- 1.4.2. Secondary research
- 1.4.3. Analyst tools and models
CHAPTER 2: EXECUTIVE SUMMARY
- 2.1. CXO Perspective
CHAPTER 3: MARKET OVERVIEW
- 3.1. Market definition and scope
- 3.2. Key findings
- 3.2.1. Top impacting factors
- 3.2.2. Top investment pockets
- 3.3. Porter's five forces analysis
- 3.3.1. Low bargaining power of suppliers
- 3.3.2. Low threat of new entrants
- 3.3.3. Low threat of substitutes
- 3.3.4. Low intensity of rivalry
- 3.3.5. Low bargaining power of buyers
- 3.4. Market dynamics
- 3.4.1. Drivers
- 3.4.1.1. Rise in online threats
- 3.4.1.2. Increase in need of rules and regulations
- 3.4.1. Drivers
- 3.4.2. Restraints
- 3.4.2.1. Rise in cost of implementation and complexity of security solutions
- 3.4.3. Opportunities
- 3.4.3.1. Rise in adoption of cloud platform
- 3.5. COVID-19 Impact Analysis on the market
CHAPTER 4: MESSAGING SECURITY MARKET, BY COMPONENT
- 4.1. Overview
- 4.1.1. Market size and forecast
- 4.2. Solution
- 4.2.1. Key market trends, growth factors and opportunities
- 4.2.2. Market size and forecast, by region
- 4.2.3. Market share analysis by country
- 4.3. Service
- 4.3.1. Key market trends, growth factors and opportunities
- 4.3.2. Market size and forecast, by region
- 4.3.3. Market share analysis by country
CHAPTER 5: MESSAGING SECURITY MARKET, BY COMMUNICATION MODE
- 5.1. Overview
- 5.1.1. Market size and forecast
- 5.2. Email
- 5.2.1. Key market trends, growth factors and opportunities
- 5.2.2. Market size and forecast, by region
- 5.2.3. Market share analysis by country
- 5.3. Instant Messaging
- 5.3.1. Key market trends, growth factors and opportunities
- 5.3.2. Market size and forecast, by region
- 5.3.3. Market share analysis by country
CHAPTER 6: MESSAGING SECURITY MARKET, BY DEPLOYMENT MODE
- 6.1. Overview
- 6.1.1. Market size and forecast
- 6.2. On-premise
- 6.2.1. Key market trends, growth factors and opportunities
- 6.2.2. Market size and forecast, by region
- 6.2.3. Market share analysis by country
- 6.3. Cloud
- 6.3.1. Key market trends, growth factors and opportunities
- 6.3.2. Market size and forecast, by region
- 6.3.3. Market share analysis by country
CHAPTER 7: MESSAGING SECURITY MARKET, BY END USER
- 7.1. Overview
- 7.1.1. Market size and forecast
- 7.2. BFSI
- 7.2.1. Key market trends, growth factors and opportunities
- 7.2.2. Market size and forecast, by region
- 7.2.3. Market share analysis by country
- 7.3. Government and Defense
- 7.3.1. Key market trends, growth factors and opportunities
- 7.3.2. Market size and forecast, by region
- 7.3.3. Market share analysis by country
- 7.4. Healthcare
- 7.4.1. Key market trends, growth factors and opportunities
- 7.4.2. Market size and forecast, by region
- 7.4.3. Market share analysis by country
- 7.5. Retail and E-commerce
- 7.5.1. Key market trends, growth factors and opportunities
- 7.5.2. Market size and forecast, by region
- 7.5.3. Market share analysis by country
- 7.6. Media and Entertainment
- 7.6.1. Key market trends, growth factors and opportunities
- 7.6.2. Market size and forecast, by region
- 7.6.3. Market share analysis by country
- 7.7. Manufacturing
- 7.7.1. Key market trends, growth factors and opportunities
- 7.7.2. Market size and forecast, by region
- 7.7.3. Market share analysis by country
- 7.8. Others
- 7.8.1. Key market trends, growth factors and opportunities
- 7.8.2. Market size and forecast, by region
- 7.8.3. Market share analysis by country
CHAPTER 8: MESSAGING SECURITY MARKET, BY REGION
- 8.1. Overview
- 8.1.1. Market size and forecast By Region
- 8.2. North America
- 8.2.1. Key market trends, growth factors and opportunities
- 8.2.2. Market size and forecast, by Component
- 8.2.3. Market size and forecast, by Communication Mode
- 8.2.4. Market size and forecast, by Deployment Mode
- 8.2.5. Market size and forecast, by End User
- 8.2.6. Market size and forecast, by country
- 8.2.6.1. U.S.
- 8.2.6.1.1. Market size and forecast, by Component
- 8.2.6.1.2. Market size and forecast, by Communication Mode
- 8.2.6.1.3. Market size and forecast, by Deployment Mode
- 8.2.6.1.4. Market size and forecast, by End User
- 8.2.6.2. Canada
- 8.2.6.2.1. Market size and forecast, by Component
- 8.2.6.2.2. Market size and forecast, by Communication Mode
- 8.2.6.2.3. Market size and forecast, by Deployment Mode
- 8.2.6.2.4. Market size and forecast, by End User
- 8.3. Europe
- 8.3.1. Key market trends, growth factors and opportunities
- 8.3.2. Market size and forecast, by Component
- 8.3.3. Market size and forecast, by Communication Mode
- 8.3.4. Market size and forecast, by Deployment Mode
- 8.3.5. Market size and forecast, by End User
- 8.3.6. Market size and forecast, by country
- 8.3.6.1. UK
- 8.3.6.1.1. Market size and forecast, by Component
- 8.3.6.1.2. Market size and forecast, by Communication Mode
- 8.3.6.1.3. Market size and forecast, by Deployment Mode
- 8.3.6.1.4. Market size and forecast, by End User
- 8.3.6.2. Germany
- 8.3.6.2.1. Market size and forecast, by Component
- 8.3.6.2.2. Market size and forecast, by Communication Mode
- 8.3.6.2.3. Market size and forecast, by Deployment Mode
- 8.3.6.2.4. Market size and forecast, by End User
- 8.3.6.3. France
- 8.3.6.3.1. Market size and forecast, by Component
- 8.3.6.3.2. Market size and forecast, by Communication Mode
- 8.3.6.3.3. Market size and forecast, by Deployment Mode
- 8.3.6.3.4. Market size and forecast, by End User
- 8.3.6.4. Italy
- 8.3.6.4.1. Market size and forecast, by Component
- 8.3.6.4.2. Market size and forecast, by Communication Mode
- 8.3.6.4.3. Market size and forecast, by Deployment Mode
- 8.3.6.4.4. Market size and forecast, by End User
- 8.3.6.5. Spain
- 8.3.6.5.1. Market size and forecast, by Component
- 8.3.6.5.2. Market size and forecast, by Communication Mode
- 8.3.6.5.3. Market size and forecast, by Deployment Mode
- 8.3.6.5.4. Market size and forecast, by End User
- 8.3.6.6. Rest of Europe
- 8.3.6.6.1. Market size and forecast, by Component
- 8.3.6.6.2. Market size and forecast, by Communication Mode
- 8.3.6.6.3. Market size and forecast, by Deployment Mode
- 8.3.6.6.4. Market size and forecast, by End User
- 8.4. Asia-Pacific
- 8.4.1. Key market trends, growth factors and opportunities
- 8.4.2. Market size and forecast, by Component
- 8.4.3. Market size and forecast, by Communication Mode
- 8.4.4. Market size and forecast, by Deployment Mode
- 8.4.5. Market size and forecast, by End User
- 8.4.6. Market size and forecast, by country
- 8.4.6.1. China
- 8.4.6.1.1. Market size and forecast, by Component
- 8.4.6.1.2. Market size and forecast, by Communication Mode
- 8.4.6.1.3. Market size and forecast, by Deployment Mode
- 8.4.6.1.4. Market size and forecast, by End User
- 8.4.6.2. Japan
- 8.4.6.2.1. Market size and forecast, by Component
- 8.4.6.2.2. Market size and forecast, by Communication Mode
- 8.4.6.2.3. Market size and forecast, by Deployment Mode
- 8.4.6.2.4. Market size and forecast, by End User
- 8.4.6.3. India
- 8.4.6.3.1. Market size and forecast, by Component
- 8.4.6.3.2. Market size and forecast, by Communication Mode
- 8.4.6.3.3. Market size and forecast, by Deployment Mode
- 8.4.6.3.4. Market size and forecast, by End User
- 8.4.6.4. Australia
- 8.4.6.4.1. Market size and forecast, by Component
- 8.4.6.4.2. Market size and forecast, by Communication Mode
- 8.4.6.4.3. Market size and forecast, by Deployment Mode
- 8.4.6.4.4. Market size and forecast, by End User
- 8.4.6.5. South Korea
- 8.4.6.5.1. Market size and forecast, by Component
- 8.4.6.5.2. Market size and forecast, by Communication Mode
- 8.4.6.5.3. Market size and forecast, by Deployment Mode
- 8.4.6.5.4. Market size and forecast, by End User
- 8.4.6.6. Rest of Asia-Pacific
- 8.4.6.6.1. Market size and forecast, by Component
- 8.4.6.6.2. Market size and forecast, by Communication Mode
- 8.4.6.6.3. Market size and forecast, by Deployment Mode
- 8.4.6.6.4. Market size and forecast, by End User
- 8.5. LAMEA
- 8.5.1. Key market trends, growth factors and opportunities
- 8.5.2. Market size and forecast, by Component
- 8.5.3. Market size and forecast, by Communication Mode
- 8.5.4. Market size and forecast, by Deployment Mode
- 8.5.5. Market size and forecast, by End User
- 8.5.6. Market size and forecast, by country
- 8.5.6.1. Latin America
- 8.5.6.1.1. Market size and forecast, by Component
- 8.5.6.1.2. Market size and forecast, by Communication Mode
- 8.5.6.1.3. Market size and forecast, by Deployment Mode
- 8.5.6.1.4. Market size and forecast, by End User
- 8.5.6.2. Middle East
- 8.5.6.2.1. Market size and forecast, by Component
- 8.5.6.2.2. Market size and forecast, by Communication Mode
- 8.5.6.2.3. Market size and forecast, by Deployment Mode
- 8.5.6.2.4. Market size and forecast, by End User
- 8.5.6.3. Africa
- 8.5.6.3.1. Market size and forecast, by Component
- 8.5.6.3.2. Market size and forecast, by Communication Mode
- 8.5.6.3.3. Market size and forecast, by Deployment Mode
- 8.5.6.3.4. Market size and forecast, by End User
CHAPTER 9: COMPETITIVE LANDSCAPE
- 9.1. Introduction
- 9.2. Top winning strategies
- 9.3. Product Mapping of Top 10 Player
- 9.4. Competitive Dashboard
- 9.5. Competitive Heatmap
- 9.6. Top player positioning, 2022
CHAPTER 10: COMPANY PROFILES
- 10.1. McAfee, LLC
- 10.1.1. Company overview
- 10.1.2. Key Executives
- 10.1.3. Company snapshot
- 10.1.4. Operating business segments
- 10.1.5. Product portfolio
- 10.2. Cisco Systems, Inc.
- 10.2.1. Company overview
- 10.2.2. Key Executives
- 10.2.3. Company snapshot
- 10.2.4. Operating business segments
- 10.2.5. Product portfolio
- 10.2.6. Business performance
- 10.2.7. Key strategic moves and developments
- 10.3. Trend Micro Incorporated
- 10.3.1. Company overview
- 10.3.2. Key Executives
- 10.3.3. Company snapshot
- 10.3.4. Operating business segments
- 10.3.5. Product portfolio
- 10.3.6. Business performance
- 10.3.7. Key strategic moves and developments
- 10.4. Microsoft Corporation
- 10.4.1. Company overview
- 10.4.2. Key Executives
- 10.4.3. Company snapshot
- 10.4.4. Operating business segments
- 10.4.5. Product portfolio
- 10.4.6. Business performance
- 10.4.7. Key strategic moves and developments
- 10.5. Broadcom
- 10.5.1. Company overview
- 10.5.2. Key Executives
- 10.5.3. Company snapshot
- 10.5.4. Operating business segments
- 10.5.5. Product portfolio
- 10.5.6. Business performance
- 10.5.7. Key strategic moves and developments
- 10.6. Proofpoint, Inc.
- 10.6.1. Company overview
- 10.6.2. Key Executives
- 10.6.3. Company snapshot
- 10.6.4. Operating business segments
- 10.6.5. Product portfolio
- 10.6.6. Business performance
- 10.6.7. Key strategic moves and developments
- 10.7. Sophos Ltd.
- 10.7.1. Company overview
- 10.7.2. Key Executives
- 10.7.3. Company snapshot
- 10.7.4. Operating business segments
- 10.7.5. Product portfolio
- 10.7.6. Key strategic moves and developments
- 10.8. Barracuda Networks, Inc.
- 10.8.1. Company overview
- 10.8.2. Key Executives
- 10.8.3. Company snapshot
- 10.8.4. Operating business segments
- 10.8.5. Product portfolio
- 10.8.6. Business performance
- 10.8.7. Key strategic moves and developments
- 10.9. F-Secure
- 10.9.1. Company overview
- 10.9.2. Key Executives
- 10.9.3. Company snapshot
- 10.9.4. Operating business segments
- 10.9.5. Product portfolio
- 10.9.6. Business performance
- 10.9.7. Key strategic moves and developments
- 10.10. Check Point Software Technologies Ltd.
- 10.10.1. Company overview
- 10.10.2. Key Executives
- 10.10.3. Company snapshot
- 10.10.4. Operating business segments
- 10.10.5. Product portfolio
- 10.10.6. Business performance
- 10.10.7. Key strategic moves and developments
