|
|
市場調査レポート
商品コード
1365711
イメージセンサー市場:技術別、用途別:世界の機会分析と産業予測、2023~2032年Image Sensor Market By Technology, By Application : Global Opportunity Analysis and Industry Forecast, 2023-2032 |
||||||
|
|
|||||||
|
|||||||


| イメージセンサー市場:技術別、用途別:世界の機会分析と産業予測、2023~2032年 |
|
出版日: 2023年08月01日
発行: Allied Market Research
ページ情報: 英文 253 Pages
納期: 2~3営業日
|

- 全表示
- 概要
- 図表
- 目次
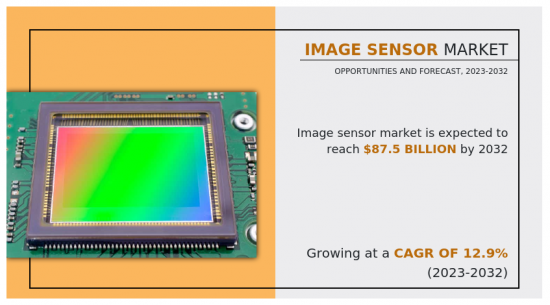
イメージセンサー市場は、2022年に263億米ドルと評価され、2023年から2032年にかけてCAGR 12.9%で成長し、2032年には875億米ドルに達すると推定されています。
イメージセンサーは、光学画像または視覚データを電子信号に変換する半導体デバイスであり、カメラ、カムコーダー、その他のイメージングシステムなどのデバイスにおいてデジタルイメージングの基礎を形成します。ピクセルと呼ばれる個々の感光素子の配列で構成され、光強度を識別・定量化して画像や動画のデジタル描写を生成します。イメージセンサーは、電荷結合素子(CCD)と相補型金属酸化膜半導体(CMOS)の2種類に分類され、それぞれに特徴や用途があります。これらのセンサーは、視覚情報を取り込み、電子信号に変換する上で重要な役割を果たしています。
世界のイメージセンサー市場の成長は、自動車におけるADASシステムの採用増加によって牽引されています。車線変更検出、モーショントラッキング、ADASといった高度な自動車機能の統合が、自動車分野における画像センサーの需要を促進すると予想されています。自動車メーカーは、自律走行、リアビュー、フロントビュー、サラウンドビューモニタリングなどの複数の機能を提供するために、最新の自動車製品に高解像度イメージセンサーを使用しています。さらに、セキュリティや監視への投資が増加していることも、イメージセンサー市場の参入企業にチャンスをもたらしています。例えば、AmbarellaはON Semiconductorと提携し、セキュリティ、監視、車載アプリケーション向けの高度な画像ソリューションを開発しています。この提携は、アンバレラのビデオ処理に関する専門知識とオン・セミコンダクターのセンサー能力を活用し、特にスマートシティ、公共安全、産業監視などの分野で高まるセキュリティと監視システムの強化需要に応える最先端のイメージセンサー技術を生み出すことを目的としています。しかし、原材料の入手可能性が限られていることは、サプライチェーンの混乱、生産コストの増加、市場需要への対応の遅れにつながる可能性があるため、イメージセンサー市場の抑制要因となっています。イメージセンサーの製造に必要不可欠な原材料の不足や変動は、生産能力の妨げとなり、値ごろ感にも影響するため、普及が制限され、市場成長の妨げとなります。
イメージセンサーの主な機能は、光などの光学データを取り込み、電子信号に変換して処理、記憶、デジタル画像や動画として表示することです。カメラやビデオカメラなど様々な画像機器の「ビジョン」として機能するイメージセンサーは、視覚世界をデジタルフォーマットに変換し、現代技術による操作、分析、共有を可能にします。グリッド内の個々のピクセルの光強度を検出・測定することで、イメージセンサーは視覚シーンのデジタル描写の生成を容易にし、多様な用途や産業における視覚コンテンツのキャプチャ、保持、インタラクションを可能にします。
イメージセンサー市場は、技術、アプリケーション、地域によって区分されます。技術別では、市場はCMOSイメージセンサーとCCDイメージセンサーに区分されます。用途別では、民生用電子機器、防衛・航空宇宙、医療、産業、車載、セキュリティ・監視に二分されます。
地域別では、北米(米国、カナダ、メキシコ)、欧州(英国、ドイツ、フランス、その他の欧州地域)、アジア太平洋(中国、日本、インド、台湾、韓国、その他のアジア太平洋)、ラテンアメリカ(中南米、中東・アフリカ)に分けて分析しています。
- キヤノン株式会社、Samsung Electronics Co.Ltd.、ON Semiconductor Corporation、Sony Group、STMicroelectronics NV、OMNIVISION、GalaxyCore Shanghai Limited Corporation、SK hynix Inc.、PixArt Imaging Inc.、Panasonic Holding Corporationなどの主要なイメージセンサー企業の分析およびプロファイルを掲載しています。2022年に主要市場参入企業が採用したのは、製品投入と買収事業戦略です。
目次
第1章 イントロダクション
第2章 エグゼクティブサマリー
第3章 市場概要
- 市場の定義と範囲
- 主な調査結果
- 影響要因
- 主な投資機会
- ポーターのファイブフォース分析
- 市場力学
- 促進要因
- モバイル機器における複数カメラの需要拡大
- 自動車におけるADASシステムの採用増加
- バイオメディカル用途でのイメージセンサーの使用急増
- 抑制要因
- イメージセンサーの製造コストが高い
- 機会
- イメージセンサー技術の進歩
- セキュリティと監視への投資の増加
- 促進要因
- COVID-19市場への影響分析
第4章 イメージセンサー市場:技術別
- 概要
- CMOSイメージセンサー
- CMOSイメージセンサーのイメージセンサー市場
- CCDイメージセンサー
第5章 イメージセンサー市場:用途別
- 概要
- コンシューマー・エレクトロニクス
- 防衛・航空宇宙
- 医療
- 産業用
- 自動車
- セキュリティと監視
第6章 画像センサー市場:地域別
- 概要
- 北米
- 米国
- カナダ
- メキシコ
- 欧州
- 英国
- ドイツ
- フランス
- その他
- アジア太平洋
- 中国
- 日本
- インド
- 台湾
- 韓国
- その他
- ラテンアメリカ・中東・アフリカ
- ラテンアメリカ
- 中東
- アフリカ
第7章 競合情勢
- イントロダクション
- 主要成功戦略
- 主要10社の製品マッピング
- 競合ダッシュボード
- 競合ヒートマップ
- 主要企業のポジショニング、2022年
第8章 企業プロファイル
- Canon Inc.
- Samsung Electronics Co. Ltd
- ON Semiconductor Corporation
- Sony Group Corporation
- STMicroelectronics NV.
- OMNIVISION
- GalaxyCore Shanghai Limited Corporation
- SK HYNIX INC.
- PixArt Imaging Inc.
- Panasonic Corporation
LIST OF TABLES
- TABLE 01. GLOBAL IMAGE SENSOR MARKET, BY TECHNOLOGY, 2022-2032 ($MILLION)
- TABLE 02. IMAGE SENSOR MARKET FOR CMOS IMAGE SENSORS, BY REGION, 2022-2032 ($MILLION)
- TABLE 03. GLOBAL CMOS IMAGE SENSORS IMAGE SENSOR MARKET, BY CMOS IMAGE SENSORS, 2022-2032 ($MILLION)
- TABLE 04. IMAGE SENSOR MARKET FOR FSI, BY REGION, 2022-2032 ($MILLION)
- TABLE 05. IMAGE SENSOR MARKET FOR BSI, BY REGION, 2022-2032 ($MILLION)
- TABLE 06. IMAGE SENSOR MARKET FOR CCD IMAGE SENSORS, BY REGION, 2022-2032 ($MILLION)
- TABLE 07. GLOBAL IMAGE SENSOR MARKET, BY APPLICATION, 2022-2032 ($MILLION)
- TABLE 08. IMAGE SENSOR MARKET FOR CONSUMER ELECTRONICS, BY REGION, 2022-2032 ($MILLION)
- TABLE 09. IMAGE SENSOR MARKET FOR DEFENSE AND AEROSPACE, BY REGION, 2022-2032 ($MILLION)
- TABLE 10. IMAGE SENSOR MARKET FOR MEDICAL, BY REGION, 2022-2032 ($MILLION)
- TABLE 11. IMAGE SENSOR MARKET FOR INDUSTRIAL, BY REGION, 2022-2032 ($MILLION)
- TABLE 12. IMAGE SENSOR MARKET FOR AUTOMOTIVE, BY REGION, 2022-2032 ($MILLION)
- TABLE 13. IMAGE SENSOR MARKET FOR SECURITY AND SURVEILLANCE, BY REGION, 2022-2032 ($MILLION)
- TABLE 14. IMAGE SENSOR MARKET, BY REGION, 2022-2032 ($MILLION)
- TABLE 15. NORTH AMERICA IMAGE SENSOR MARKET, BY TECHNOLOGY, 2022-2032 ($MILLION)
- TABLE 16. NORTH AMERICA CMOS IMAGE SENSORS IMAGE SENSOR MARKET, BY CMOS IMAGE SENSORS, 2022-2032 ($MILLION)
- TABLE 17. NORTH AMERICA IMAGE SENSOR MARKET, BY APPLICATION, 2022-2032 ($MILLION)
- TABLE 18. NORTH AMERICA IMAGE SENSOR MARKET, BY COUNTRY, 2022-2032 ($MILLION)
- TABLE 19. U.S. IMAGE SENSOR MARKET, BY TECHNOLOGY, 2022-2032 ($MILLION)
- TABLE 20. U.S. CMOS IMAGE SENSORS IMAGE SENSOR MARKET, BY CMOS IMAGE SENSORS, 2022-2032 ($MILLION)
- TABLE 21. U.S. IMAGE SENSOR MARKET, BY APPLICATION, 2022-2032 ($MILLION)
- TABLE 22. CANADA IMAGE SENSOR MARKET, BY TECHNOLOGY, 2022-2032 ($MILLION)
- TABLE 23. CANADA CMOS IMAGE SENSORS IMAGE SENSOR MARKET, BY CMOS IMAGE SENSORS, 2022-2032 ($MILLION)
- TABLE 24. CANADA IMAGE SENSOR MARKET, BY APPLICATION, 2022-2032 ($MILLION)
- TABLE 25. MEXICO IMAGE SENSOR MARKET, BY TECHNOLOGY, 2022-2032 ($MILLION)
- TABLE 26. MEXICO CMOS IMAGE SENSORS IMAGE SENSOR MARKET, BY CMOS IMAGE SENSORS, 2022-2032 ($MILLION)
- TABLE 27. MEXICO IMAGE SENSOR MARKET, BY APPLICATION, 2022-2032 ($MILLION)
- TABLE 28. EUROPE IMAGE SENSOR MARKET, BY TECHNOLOGY, 2022-2032 ($MILLION)
- TABLE 29. EUROPE CMOS IMAGE SENSORS IMAGE SENSOR MARKET, BY CMOS IMAGE SENSORS, 2022-2032 ($MILLION)
- TABLE 30. EUROPE IMAGE SENSOR MARKET, BY APPLICATION, 2022-2032 ($MILLION)
- TABLE 31. EUROPE IMAGE SENSOR MARKET, BY COUNTRY, 2022-2032 ($MILLION)
- TABLE 32. UK IMAGE SENSOR MARKET, BY TECHNOLOGY, 2022-2032 ($MILLION)
- TABLE 33. UK CMOS IMAGE SENSORS IMAGE SENSOR MARKET, BY CMOS IMAGE SENSORS, 2022-2032 ($MILLION)
- TABLE 34. UK IMAGE SENSOR MARKET, BY APPLICATION, 2022-2032 ($MILLION)
- TABLE 35. GERMANY IMAGE SENSOR MARKET, BY TECHNOLOGY, 2022-2032 ($MILLION)
- TABLE 36. GERMANY CMOS IMAGE SENSORS IMAGE SENSOR MARKET, BY CMOS IMAGE SENSORS, 2022-2032 ($MILLION)
- TABLE 37. GERMANY IMAGE SENSOR MARKET, BY APPLICATION, 2022-2032 ($MILLION)
- TABLE 38. FRANCE IMAGE SENSOR MARKET, BY TECHNOLOGY, 2022-2032 ($MILLION)
- TABLE 39. FRANCE CMOS IMAGE SENSORS IMAGE SENSOR MARKET, BY CMOS IMAGE SENSORS, 2022-2032 ($MILLION)
- TABLE 40. FRANCE IMAGE SENSOR MARKET, BY APPLICATION, 2022-2032 ($MILLION)
- TABLE 41. REST OF EUROPE IMAGE SENSOR MARKET, BY TECHNOLOGY, 2022-2032 ($MILLION)
- TABLE 42. REST OF EUROPE CMOS IMAGE SENSORS IMAGE SENSOR MARKET, BY CMOS IMAGE SENSORS, 2022-2032 ($MILLION)
- TABLE 43. REST OF EUROPE IMAGE SENSOR MARKET, BY APPLICATION, 2022-2032 ($MILLION)
- TABLE 44. ASIA-PACIFIC IMAGE SENSOR MARKET, BY TECHNOLOGY, 2022-2032 ($MILLION)
- TABLE 45. ASIA-PACIFIC CMOS IMAGE SENSORS IMAGE SENSOR MARKET, BY CMOS IMAGE SENSORS, 2022-2032 ($MILLION)
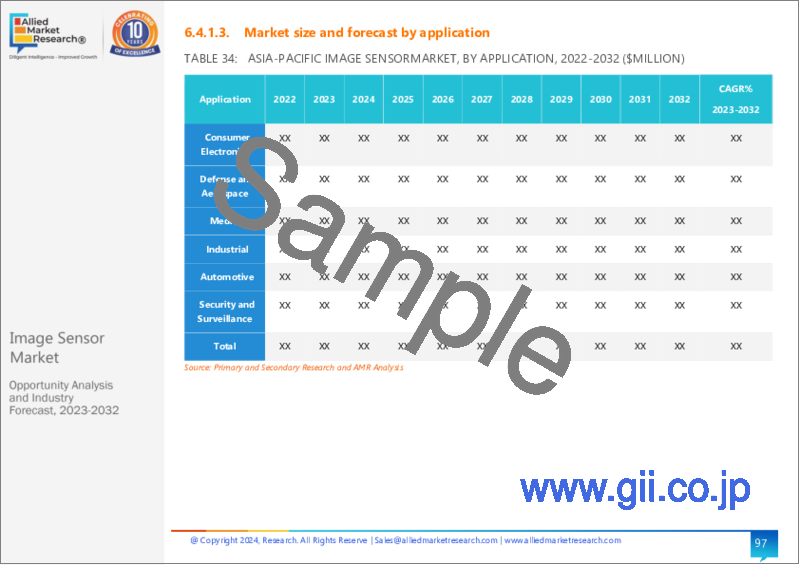
- TABLE 46. ASIA-PACIFIC IMAGE SENSOR MARKET, BY APPLICATION, 2022-2032 ($MILLION)
- TABLE 47. ASIA-PACIFIC IMAGE SENSOR MARKET, BY COUNTRY, 2022-2032 ($MILLION)
- TABLE 48. CHINA IMAGE SENSOR MARKET, BY TECHNOLOGY, 2022-2032 ($MILLION)
- TABLE 49. CHINA CMOS IMAGE SENSORS IMAGE SENSOR MARKET, BY CMOS IMAGE SENSORS, 2022-2032 ($MILLION)
- TABLE 50. CHINA IMAGE SENSOR MARKET, BY APPLICATION, 2022-2032 ($MILLION)
- TABLE 51. JAPAN IMAGE SENSOR MARKET, BY TECHNOLOGY, 2022-2032 ($MILLION)
- TABLE 52. JAPAN CMOS IMAGE SENSORS IMAGE SENSOR MARKET, BY CMOS IMAGE SENSORS, 2022-2032 ($MILLION)
- TABLE 53. JAPAN IMAGE SENSOR MARKET, BY APPLICATION, 2022-2032 ($MILLION)
- TABLE 54. INDIA IMAGE SENSOR MARKET, BY TECHNOLOGY, 2022-2032 ($MILLION)
- TABLE 55. INDIA CMOS IMAGE SENSORS IMAGE SENSOR MARKET, BY CMOS IMAGE SENSORS, 2022-2032 ($MILLION)
- TABLE 56. INDIA IMAGE SENSOR MARKET, BY APPLICATION, 2022-2032 ($MILLION)
- TABLE 57. TAIWAN IMAGE SENSOR MARKET, BY TECHNOLOGY, 2022-2032 ($MILLION)
- TABLE 58. TAIWAN CMOS IMAGE SENSORS IMAGE SENSOR MARKET, BY CMOS IMAGE SENSORS, 2022-2032 ($MILLION)
- TABLE 59. TAIWAN IMAGE SENSOR MARKET, BY APPLICATION, 2022-2032 ($MILLION)
- TABLE 60. SOUTH KOREA IMAGE SENSOR MARKET, BY TECHNOLOGY, 2022-2032 ($MILLION)
- TABLE 61. SOUTH KOREA CMOS IMAGE SENSORS IMAGE SENSOR MARKET, BY CMOS IMAGE SENSORS, 2022-2032 ($MILLION)
- TABLE 62. SOUTH KOREA IMAGE SENSOR MARKET, BY APPLICATION, 2022-2032 ($MILLION)
- TABLE 63. REST OF ASIA-PACIFIC IMAGE SENSOR MARKET, BY TECHNOLOGY, 2022-2032 ($MILLION)
- TABLE 64. REST OF ASIA-PACIFIC CMOS IMAGE SENSORS IMAGE SENSOR MARKET, BY CMOS IMAGE SENSORS, 2022-2032 ($MILLION)
- TABLE 65. REST OF ASIA-PACIFIC IMAGE SENSOR MARKET, BY APPLICATION, 2022-2032 ($MILLION)
- TABLE 66. LAMEA IMAGE SENSOR MARKET, BY TECHNOLOGY, 2022-2032 ($MILLION)
- TABLE 67. LAMEA CMOS IMAGE SENSORS IMAGE SENSOR MARKET, BY CMOS IMAGE SENSORS, 2022-2032 ($MILLION)
- TABLE 68. LAMEA IMAGE SENSOR MARKET, BY APPLICATION, 2022-2032 ($MILLION)
- TABLE 69. LAMEA IMAGE SENSOR MARKET, BY COUNTRY, 2022-2032 ($MILLION)
- TABLE 70. LATIN AMERICA IMAGE SENSOR MARKET, BY TECHNOLOGY, 2022-2032 ($MILLION)
- TABLE 71. LATIN AMERICA CMOS IMAGE SENSORS IMAGE SENSOR MARKET, BY CMOS IMAGE SENSORS, 2022-2032 ($MILLION)
- TABLE 72. LATIN AMERICA IMAGE SENSOR MARKET, BY APPLICATION, 2022-2032 ($MILLION)
- TABLE 73. MIDDLE EAST IMAGE SENSOR MARKET, BY TECHNOLOGY, 2022-2032 ($MILLION)
- TABLE 74. MIDDLE EAST CMOS IMAGE SENSORS IMAGE SENSOR MARKET, BY CMOS IMAGE SENSORS, 2022-2032 ($MILLION)
- TABLE 75. MIDDLE EAST IMAGE SENSOR MARKET, BY APPLICATION, 2022-2032 ($MILLION)
- TABLE 76. AFRICA IMAGE SENSOR MARKET, BY TECHNOLOGY, 2022-2032 ($MILLION)
- TABLE 77. AFRICA CMOS IMAGE SENSORS IMAGE SENSOR MARKET, BY CMOS IMAGE SENSORS, 2022-2032 ($MILLION)
- TABLE 78. AFRICA IMAGE SENSOR MARKET, BY APPLICATION, 2022-2032 ($MILLION)
- TABLE 79. CANON INC.: KEY EXECUTIVES
- TABLE 80. CANON INC.: COMPANY SNAPSHOT
- TABLE 81. CANON INC.: PRODUCT SEGMENTS
- TABLE 82. CANON INC.: PRODUCT PORTFOLIO
- TABLE 83. CANON INC.: KEY STRATERGIES
- TABLE 84. SAMSUNG ELECTRONICS CO. LTD: KEY EXECUTIVES
- TABLE 85. SAMSUNG ELECTRONICS CO. LTD: COMPANY SNAPSHOT
- TABLE 86. SAMSUNG ELECTRONICS CO. LTD: PRODUCT SEGMENTS
- TABLE 87. SAMSUNG ELECTRONICS CO. LTD: PRODUCT PORTFOLIO
- TABLE 88. ON SEMICONDUCTOR CORPORATION: KEY EXECUTIVES
- TABLE 89. ON SEMICONDUCTOR CORPORATION: COMPANY SNAPSHOT
- TABLE 90. ON SEMICONDUCTOR CORPORATION: PRODUCT SEGMENTS
- TABLE 91. ON SEMICONDUCTOR CORPORATION: PRODUCT PORTFOLIO
- TABLE 92. SONY GROUP CORPORATION: KEY EXECUTIVES
- TABLE 93. SONY GROUP CORPORATION: COMPANY SNAPSHOT
- TABLE 94. SONY GROUP CORPORATION: SERVICE SEGMENTS
- TABLE 95. SONY GROUP CORPORATION: PRODUCT PORTFOLIO
- TABLE 96. SONY GROUP CORPORATION: KEY STRATERGIES
- TABLE 97. STMICROELECTRONICS NV.: KEY EXECUTIVES
- TABLE 98. STMICROELECTRONICS NV.: COMPANY SNAPSHOT
- TABLE 99. STMICROELECTRONICS NV.: PRODUCT SEGMENTS
- TABLE 100. STMICROELECTRONICS NV.: PRODUCT PORTFOLIO
- TABLE 101. STMICROELECTRONICS NV.: KEY STRATERGIES
- TABLE 102. OMNIVISION: KEY EXECUTIVES
- TABLE 103. OMNIVISION: COMPANY SNAPSHOT
- TABLE 104. OMNIVISION: PRODUCT SEGMENTS
- TABLE 105. OMNIVISION: PRODUCT PORTFOLIO
- TABLE 106. OMNIVISION: KEY STRATERGIES
- TABLE 107. GALAXYCORE SHANGHAI LIMITED CORPORATION: KEY EXECUTIVES
- TABLE 108. GALAXYCORE SHANGHAI LIMITED CORPORATION: COMPANY SNAPSHOT
- TABLE 109. GALAXYCORE SHANGHAI LIMITED CORPORATION: PRODUCT SEGMENTS
- TABLE 110. GALAXYCORE SHANGHAI LIMITED CORPORATION: PRODUCT PORTFOLIO
- TABLE 111. SK HYNIX INC.: KEY EXECUTIVES
- TABLE 112. SK HYNIX INC.: COMPANY SNAPSHOT
- TABLE 113. SK HYNIX INC.: SERVICE SEGMENTS
- TABLE 114. SK HYNIX INC.: PRODUCT PORTFOLIO
- TABLE 115. SK HYNIX INC.: KEY STRATERGIES
- TABLE 116. PIXART IMAGING INC.: KEY EXECUTIVES
- TABLE 117. PIXART IMAGING INC.: COMPANY SNAPSHOT
- TABLE 118. PIXART IMAGING INC.: PRODUCT SEGMENTS
- TABLE 119. PIXART IMAGING INC.: PRODUCT PORTFOLIO
- TABLE 120. PANASONIC CORPORATION: KEY EXECUTIVES
- TABLE 121. PANASONIC CORPORATION: COMPANY SNAPSHOT
- TABLE 122. PANASONIC CORPORATION: PRODUCT SEGMENTS
- TABLE 123. PANASONIC CORPORATION: PRODUCT PORTFOLIO
LIST OF FIGURES
- FIGURE 01. IMAGE SENSOR MARKET, 2022-2032
- FIGURE 02. SEGMENTATION OF IMAGE SENSOR MARKET,2022-2032
- FIGURE 03. TOP INVESTMENT POCKETS IN IMAGE SENSOR MARKET (2023-2032)
- FIGURE 04. MODERATE TO HIGH BARGAINING POWER OF SUPPLIERS
- FIGURE 05. LOW TO HIGHTHREAT OF NEW ENTRANTS
- FIGURE 06. MODERATE THREAT OF SUBSTITUTES
- FIGURE 07. LOW TO HIGH INTENSITY OF RIVALRY
- FIGURE 08. LOW TO HIGH BARGAINING POWER OF BUYERS
- FIGURE 09. GLOBAL IMAGE SENSOR MARKET:DRIVERS, RESTRAINTS AND OPPORTUNITIES
- FIGURE 10. IMAGE SENSOR MARKET, BY TECHNOLOGY, 2022(%)
- FIGURE 11. COMPARATIVE SHARE ANALYSIS OF IMAGE SENSOR MARKET FOR CMOS IMAGE SENSORS, BY COUNTRY 2022 AND 2032(%)
- FIGURE 12. COMPARATIVE SHARE ANALYSIS OF IMAGE SENSOR MARKET FOR CCD IMAGE SENSORS, BY COUNTRY 2022 AND 2032(%)
- FIGURE 13. IMAGE SENSOR MARKET, BY APPLICATION, 2022(%)
- FIGURE 14. COMPARATIVE SHARE ANALYSIS OF IMAGE SENSOR MARKET FOR CONSUMER ELECTRONICS, BY COUNTRY 2022 AND 2032(%)
- FIGURE 15. COMPARATIVE SHARE ANALYSIS OF IMAGE SENSOR MARKET FOR DEFENSE AND AEROSPACE, BY COUNTRY 2022 AND 2032(%)
- FIGURE 16. COMPARATIVE SHARE ANALYSIS OF IMAGE SENSOR MARKET FOR MEDICAL, BY COUNTRY 2022 AND 2032(%)
- FIGURE 17. COMPARATIVE SHARE ANALYSIS OF IMAGE SENSOR MARKET FOR INDUSTRIAL, BY COUNTRY 2022 AND 2032(%)
- FIGURE 18. COMPARATIVE SHARE ANALYSIS OF IMAGE SENSOR MARKET FOR AUTOMOTIVE, BY COUNTRY 2022 AND 2032(%)
- FIGURE 19. COMPARATIVE SHARE ANALYSIS OF IMAGE SENSOR MARKET FOR SECURITY AND SURVEILLANCE, BY COUNTRY 2022 AND 2032(%)
- FIGURE 20. IMAGE SENSOR MARKET BY REGION, 2022(%)
- FIGURE 21. U.S. IMAGE SENSOR MARKET, 2022-2032 ($MILLION)
- FIGURE 22. CANADA IMAGE SENSOR MARKET, 2022-2032 ($MILLION)
- FIGURE 23. MEXICO IMAGE SENSOR MARKET, 2022-2032 ($MILLION)
- FIGURE 24. UK IMAGE SENSOR MARKET, 2022-2032 ($MILLION)
- FIGURE 25. GERMANY IMAGE SENSOR MARKET, 2022-2032 ($MILLION)
- FIGURE 26. FRANCE IMAGE SENSOR MARKET, 2022-2032 ($MILLION)
- FIGURE 27. REST OF EUROPE IMAGE SENSOR MARKET, 2022-2032 ($MILLION)
- FIGURE 28. CHINA IMAGE SENSOR MARKET, 2022-2032 ($MILLION)
- FIGURE 29. JAPAN IMAGE SENSOR MARKET, 2022-2032 ($MILLION)
- FIGURE 30. INDIA IMAGE SENSOR MARKET, 2022-2032 ($MILLION)
- FIGURE 31. TAIWAN IMAGE SENSOR MARKET, 2022-2032 ($MILLION)
- FIGURE 32. SOUTH KOREA IMAGE SENSOR MARKET, 2022-2032 ($MILLION)
- FIGURE 33. REST OF ASIA-PACIFIC IMAGE SENSOR MARKET, 2022-2032 ($MILLION)
- FIGURE 34. LATIN AMERICA IMAGE SENSOR MARKET, 2022-2032 ($MILLION)
- FIGURE 35. MIDDLE EAST IMAGE SENSOR MARKET, 2022-2032 ($MILLION)
- FIGURE 36. AFRICA IMAGE SENSOR MARKET, 2022-2032 ($MILLION)
- FIGURE 37. TOP WINNING STRATEGIES, BY YEAR (2020-2023)
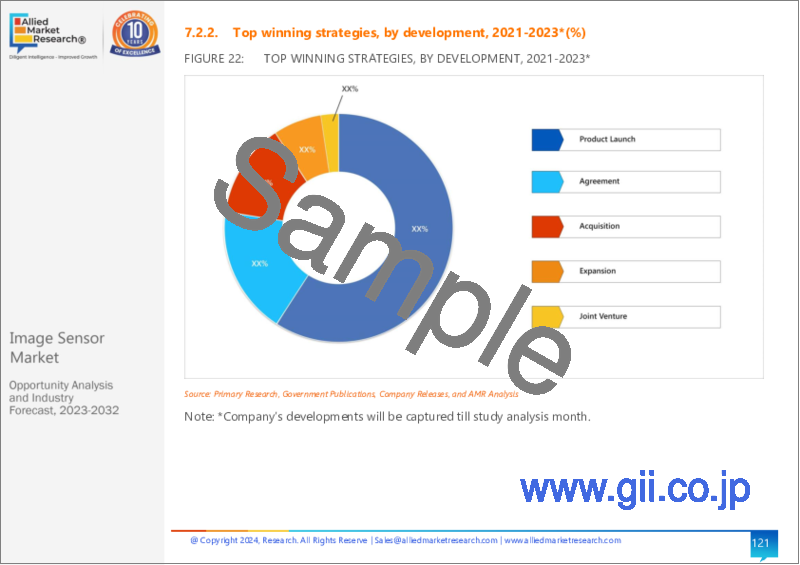
- FIGURE 38. TOP WINNING STRATEGIES, BY DEVELOPMENT (2020-2023)
- FIGURE 39. TOP WINNING STRATEGIES, BY COMPANY (2020-2023)
- FIGURE 40. PRODUCT MAPPING OF TOP 10 PLAYERS
- FIGURE 41. COMPETITIVE DASHBOARD
- FIGURE 42. COMPETITIVE HEATMAP: IMAGE SENSOR MARKET
- FIGURE 43. TOP PLAYER POSITIONING, 2022
- FIGURE 44. SAMSUNG ELECTRONICS CO. LTD: NET REVENUE, 2020-2022 ($BILLION)
- FIGURE 45. SAMSUNG ELECTRONICS CO. LTD: RESEARCH & DEVELOPMENT EXPENDITURE, 2020-2022 ($BILLION)
- FIGURE 46. SAMSUNG ELECTRONICS CO. LTD: REVENUE SHARE BY SEGMENT, 2022 (%)
- FIGURE 47. SAMSUNG ELECTRONICS CO. LTD: REVENUE SHARE BY REGION, 2022 (%)
- FIGURE 48. ON SEMICONDUCTOR CORPORATION: NET REVENUE, 2020-2022 ($MILLION)
- FIGURE 49. ON SEMICONDUCTOR CORPORATION: REVENUE SHARE BY SEGMENT, 2022 (%)
- FIGURE 50. ON SEMICONDUCTOR CORPORATION: REVENUE SHARE BY REGION, 2022 (%)
- FIGURE 51. SONY GROUP CORPORATION: NET SALES, 2019-2021 ($BILLION)
- FIGURE 52. SONY GROUP CORPORATION: REVENUE SHARE BY REGION, 2021 (%)
- FIGURE 53. STMICROELECTRONICS NV.: RESEARCH & DEVELOPMENT EXPENDITURE, 2020-2022 ($MILLION)
- FIGURE 54. STMICROELECTRONICS NV.: NET SALES, 2020-2022 ($MILLION)
- FIGURE 55. STMICROELECTRONICS NV.: REVENUE SHARE BY SEGMENT, 2022 (%)
- FIGURE 56. STMICROELECTRONICS NV.: REVENUE SHARE BY REGION, 2022 (%)
- FIGURE 57. OMNIVISION: NET REVENUE, 2019-2021 ($MILLION)
- FIGURE 58. SK HYNIX INC.: NET REVENUE, 2020-2022 ($MILLION)
- FIGURE 59. PIXART IMAGING INC.: NET REVENUE, 2020-2022 ($MILLION)
- FIGURE 60. PIXART IMAGING INC.: REVENUE SHARE BY SEGMENT, 2022 (%)
- FIGURE 61. PANASONIC CORPORATION: NET REVENUE, 2020-2022 ($MILLION)
- FIGURE 62. PANASONIC CORPORATION: REVENUE SHARE BY SEGMENT, 2022 (%)
- FIGURE 63. PANASONIC CORPORATION: REVENUE SHARE BY REGION, 2022 (%)
According to a new report published by Allied Market Research, titled, "Image Sensor Market," The image sensor market was valued at $26.3 billion in 2022, and is estimated to reach $87.5 billion by 2032, growing at a CAGR of 12.9% from 2023 to 2032.
An image sensor is a semiconductor device that transforms optical images or visual data into electronic signals, forming the basis of digital imaging in devices such as cameras, camcorders, and other imaging systems. It comprises an arrangement of individual light-sensitive elements called pixels, which identify and quantify light intensity to generate digital renditions of images or videos. Image sensors are classified into two types such as charge-coupled devices (CCD) and complementary metal-oxide-semiconductor (CMOS), each with its own set of characteristics and applications. These sensors play an important role in capturing and translating visual information into electronic signals.
The growth of the global image sensor market is driven by an increase in adoption of ADAS systems in automobiles. Integration of advanced automotive features such as lane change detection, motion tracking, and ADAS is expected to fuel the demand for image sensors in the automobile sector. Automakers are using high-resolution image sensors in their latest vehicle products to offer multiple features such as autonomous driving, rear view, front view, and surround view monitoring. Furthermore, increasing investments in security and surveillance opens an opportunity for the image sensor market players. For instance, Ambarella partnered with ON Semiconductor to develop advanced imaging solutions for security, surveillance, and automotive applications. This collaboration aims to leverage Ambarella's expertise in video processing and ON Semiconductor's sensor capabilities to create cutting-edge image sensor technologies that cater to the growing demand for enhanced security and surveillance systems, particularly in sectors such as smart cities, public safety, and industrial monitoring. However, the limited availability of raw materials poses a restraint for the image sensor market as it can lead to supply chain disruptions, increased production costs, and potential delays in meeting market demand. Shortages or fluctuations in essential materials required for manufacturing image sensors can hinder production capabilities and affect affordability, limiting widespread adoption and hindering market growth.
The primary function of an image sensor is to capture optical data, such as light, and transform it into electronic signals for processing, storage, and display as digital images or videos. Serving as the "vision" of various imaging devices such as cameras and camcorders, image sensors translate the visual world into digital format, enabling manipulation, analysis, and sharing through modern technology. Through the detection and measurement of light intensity on individual pixels within their grid, image sensors facilitate the generation of digital depictions of visual scenes, enabling the capture, retention, and interaction with visual content across diverse applications and industries.
The image sensor market is segmented on the basis of technology, application, and region. By technology, the market is segmented into CMOS image sensor, and CCD image sensor. By application, the market is bifurcated into consumer electronics, defense & aerospace, medical, industrial, automotive, and security & surveillance.
By region, it is analyzed across North America (the U.S., Canada, and Mexico), Europe (UK, Germany, France, and the rest of Europe), Asia-Pacific (China, Japan, India, Taiwan, South Korea, and rest of Asia-Pacific), and LAMEA (Latin America, the Middle East, and Africa).
- Competitive analysis and profiles of the major image sensor market players, such as Canon Inc., Samsung Electronics Co. Ltd., ON Semiconductor Corporation, Sony Group, STMicroelectronics NV, OMNIVISION, GalaxyCore Shanghai Limited Corporation, SK hynix Inc., PixArt Imaging Inc., and Panasonic Holding Corporation are provided in this report. Product launch and acquisition business strategies were adopted by the major market players in 2022.
Key Benefits For Stakeholders
- This report provides a quantitative analysis of the market segments, current trends, estimations, and dynamics of the image sensor market analysis from 2022 to 2032 to identify the prevailing image sensor market opportunities.
- The market research is offered along with information related to key drivers, restraints, and opportunities.
- Porter's five forces analysis highlights the potency of buyers and suppliers to enable stakeholders make profit-oriented business decisions and strengthen their supplier-buyer network.
- In-depth analysis of the image sensor market segmentation assists to determine the prevailing market opportunities.
- Major countries in each region are mapped according to their revenue contribution to the global market.
- Market player positioning facilitates benchmarking and provides a clear understanding of the present position of the market players.
- The report includes the analysis of the regional as well as global image sensor market trends, key players, market segments, application areas, and market growth strategies.
Additional benefits you will get with this purchase are:
- Quarterly Update and* (only available with a corporate license, on listed price)
- 5 additional Company Profile of client Choice pre- or Post-purchase, as a free update.
- Free Upcoming Version on the Purchase of Five and Enterprise User License.
- 16 analyst hours of support* (post-purchase, if you find additional data requirements upon review of the report, you may receive support amounting to 16 analyst hours to solve questions, and post-sale queries)
- 15% Free Customization* (in case the scope or segment of the report does not match your requirements, 20% is equivalent to 3 working days of free work, applicable once)
- Free data Pack on the Five and Enterprise User License. (Excel version of the report)
- Free Updated report if the report is 6-12 months old or older.
- 24-hour priority response*
- Free Industry updates and white papers.
Possible Customization with this report (with additional cost and timeline talk to the sales executive to know more)
- Product Life Cycles
- Market share analysis of players by products/segments
- Additional company profiles with specific to client's interest
- Additional country or region analysis- market size and forecast
- Key player details (including location, contact details, supplier/vendor network etc. in excel format)
- Market share analysis of players at global/region/country level
Key Market Segments
By Technology
- CCD image sensors
- CMOS image sensors
- CMOS image sensors
- FSI
- BSI
By Application
- Consumer Electronics
- Defense and Aerospace
- Medical
- Industrial
- Automotive
- Security and Surveillance
By Region
- North America
- U.S.
- Canada
- Mexico
- Europe
- UK
- Germany
- France
- Rest of Europe
- Asia-Pacific
- China
- Japan
- India
- Taiwan
- South Korea
- Rest of Asia-Pacific
- LAMEA
- Latin America
- Middle East
- Africa
Key Market Players:
- Canon Inc.
- Samsung Electronics Co. Ltd
- Sony Group Corporation
- STMicroelectronics NV.
- SK HYNIX INC.
- Panasonic Corporation
- PixArt Imaging Inc.
- OMNIVISION
- ON Semiconductor Corporation
- GalaxyCore Shanghai Limited Corporation
TABLE OF CONTENTS
CHAPTER 1: INTRODUCTION
- 1.1. Report description
- 1.2. Key market segments
- 1.3. Key benefits to the stakeholders
- 1.4. Research Methodology
- 1.4.1. Primary research
- 1.4.2. Secondary research
- 1.4.3. Analyst tools and models
CHAPTER 2: EXECUTIVE SUMMARY
- 2.1. CXO Perspective
CHAPTER 3: MARKET OVERVIEW
- 3.1. Market definition and scope
- 3.2. Key findings
- 3.2.1. Top impacting factors
- 3.2.2. Top investment pockets
- 3.3. Porter's five forces analysis
- 3.3.1. Moderate to high bargaining power of suppliers
- 3.3.2. Low to highthreat of new entrants
- 3.3.3. Moderate threat of substitutes
- 3.3.4. Low to high intensity of rivalry
- 3.3.5. Low to high bargaining power of buyers
- 3.4. Market dynamics
- 3.4.1. Drivers
- 3.4.1.1. Growing demand for multiple cameras in mobile devices
- 3.4.1.2. Increase in adoption of ADAS system in automobile
- 3.4.1.3. Surge in use of image sensors for biomedical applications
- 3.4.1. Drivers
- 3.4.2. Restraints
- 3.4.2.1. High cost of manufacturing image sensors
- 3.4.3. Opportunities
- 3.4.3.1. Advancements in image sensor technology
- 3.4.3.2. Increasing investments in security and surveillance
- 3.5. COVID-19 Impact Analysis on the market
CHAPTER 4: IMAGE SENSOR MARKET, BY TECHNOLOGY
- 4.1. Overview
- 4.1.1. Market size and forecast
- 4.2. CMOS image sensors
- 4.2.1. Key market trends, growth factors and opportunities
- 4.2.2. Market size and forecast, by region
- 4.2.3. Market share analysis by country
- 4.2.4. CMOS image sensors Image Sensor Market by CMOS image sensors
- 4.2.4.1. FSI Market size and forecast, by region
- 4.2.4.2. FSI Market size and forecast, by country
- 4.2.4.3. BSI Market size and forecast, by region
- 4.2.4.4. BSI Market size and forecast, by country
- 4.3. CCD image sensors
- 4.3.1. Key market trends, growth factors and opportunities
- 4.3.2. Market size and forecast, by region
- 4.3.3. Market share analysis by country
CHAPTER 5: IMAGE SENSOR MARKET, BY APPLICATION
- 5.1. Overview
- 5.1.1. Market size and forecast
- 5.2. Consumer Electronics
- 5.2.1. Key market trends, growth factors and opportunities
- 5.2.2. Market size and forecast, by region
- 5.2.3. Market share analysis by country
- 5.3. Defense and Aerospace
- 5.3.1. Key market trends, growth factors and opportunities
- 5.3.2. Market size and forecast, by region
- 5.3.3. Market share analysis by country
- 5.4. Medical
- 5.4.1. Key market trends, growth factors and opportunities
- 5.4.2. Market size and forecast, by region
- 5.4.3. Market share analysis by country
- 5.5. Industrial
- 5.5.1. Key market trends, growth factors and opportunities
- 5.5.2. Market size and forecast, by region
- 5.5.3. Market share analysis by country
- 5.6. Automotive
- 5.6.1. Key market trends, growth factors and opportunities
- 5.6.2. Market size and forecast, by region
- 5.6.3. Market share analysis by country
- 5.7. Security and Surveillance
- 5.7.1. Key market trends, growth factors and opportunities
- 5.7.2. Market size and forecast, by region
- 5.7.3. Market share analysis by country
CHAPTER 6: IMAGE SENSOR MARKET, BY REGION
- 6.1. Overview
- 6.1.1. Market size and forecast By Region
- 6.2. North America
- 6.2.1. Key market trends, growth factors and opportunities
- 6.2.2. Market size and forecast, by Technology
- 6.2.2.1. North America CMOS image sensors Image Sensor Market by CMOS image sensors
- 6.2.3. Market size and forecast, by Application
- 6.2.4. Market size and forecast, by country
- 6.2.4.1. U.S.
- 6.2.4.1.1. Market size and forecast, by Technology
- 6.2.4.1.1.1. U.S. CMOS image sensors Image Sensor Market by CMOS image sensors
- 6.2.4.1.2. Market size and forecast, by Application
- 6.2.4.2. Canada
- 6.2.4.2.1. Market size and forecast, by Technology
- 6.2.4.2.1.1. Canada CMOS image sensors Image Sensor Market by CMOS image sensors
- 6.2.4.2.2. Market size and forecast, by Application
- 6.2.4.3. Mexico
- 6.2.4.3.1. Market size and forecast, by Technology
- 6.2.4.3.1.1. Mexico CMOS image sensors Image Sensor Market by CMOS image sensors
- 6.2.4.3.2. Market size and forecast, by Application
- 6.3. Europe
- 6.3.1. Key market trends, growth factors and opportunities
- 6.3.2. Market size and forecast, by Technology
- 6.3.2.1. Europe CMOS image sensors Image Sensor Market by CMOS image sensors
- 6.3.3. Market size and forecast, by Application
- 6.3.4. Market size and forecast, by country
- 6.3.4.1. UK
- 6.3.4.1.1. Market size and forecast, by Technology
- 6.3.4.1.1.1. UK CMOS image sensors Image Sensor Market by CMOS image sensors
- 6.3.4.1.2. Market size and forecast, by Application
- 6.3.4.2. Germany
- 6.3.4.2.1. Market size and forecast, by Technology
- 6.3.4.2.1.1. Germany CMOS image sensors Image Sensor Market by CMOS image sensors
- 6.3.4.2.2. Market size and forecast, by Application
- 6.3.4.3. France
- 6.3.4.3.1. Market size and forecast, by Technology
- 6.3.4.3.1.1. France CMOS image sensors Image Sensor Market by CMOS image sensors
- 6.3.4.3.2. Market size and forecast, by Application
- 6.3.4.4. Rest of Europe
- 6.3.4.4.1. Market size and forecast, by Technology
- 6.3.4.4.1.1. Rest of Europe CMOS image sensors Image Sensor Market by CMOS image sensors
- 6.3.4.4.2. Market size and forecast, by Application
- 6.4. Asia-Pacific
- 6.4.1. Key market trends, growth factors and opportunities
- 6.4.2. Market size and forecast, by Technology
- 6.4.2.1. Asia-Pacific CMOS image sensors Image Sensor Market by CMOS image sensors
- 6.4.3. Market size and forecast, by Application
- 6.4.4. Market size and forecast, by country
- 6.4.4.1. China
- 6.4.4.1.1. Market size and forecast, by Technology
- 6.4.4.1.1.1. China CMOS image sensors Image Sensor Market by CMOS image sensors
- 6.4.4.1.2. Market size and forecast, by Application
- 6.4.4.2. Japan
- 6.4.4.2.1. Market size and forecast, by Technology
- 6.4.4.2.1.1. Japan CMOS image sensors Image Sensor Market by CMOS image sensors
- 6.4.4.2.2. Market size and forecast, by Application
- 6.4.4.3. India
- 6.4.4.3.1. Market size and forecast, by Technology
- 6.4.4.3.1.1. India CMOS image sensors Image Sensor Market by CMOS image sensors
- 6.4.4.3.2. Market size and forecast, by Application
- 6.4.4.4. Taiwan
- 6.4.4.4.1. Market size and forecast, by Technology
- 6.4.4.4.1.1. Taiwan CMOS image sensors Image Sensor Market by CMOS image sensors
- 6.4.4.4.2. Market size and forecast, by Application
- 6.4.4.5. South Korea
- 6.4.4.5.1. Market size and forecast, by Technology
- 6.4.4.5.1.1. South Korea CMOS image sensors Image Sensor Market by CMOS image sensors
- 6.4.4.5.2. Market size and forecast, by Application
- 6.4.4.6. Rest of Asia-Pacific
- 6.4.4.6.1. Market size and forecast, by Technology
- 6.4.4.6.1.1. Rest of Asia-Pacific CMOS image sensors Image Sensor Market by CMOS image sensors
- 6.4.4.6.2. Market size and forecast, by Application
- 6.5. LAMEA
- 6.5.1. Key market trends, growth factors and opportunities
- 6.5.2. Market size and forecast, by Technology
- 6.5.2.1. LAMEA CMOS image sensors Image Sensor Market by CMOS image sensors
- 6.5.3. Market size and forecast, by Application
- 6.5.4. Market size and forecast, by country
- 6.5.4.1. Latin America
- 6.5.4.1.1. Market size and forecast, by Technology
- 6.5.4.1.1.1. Latin America CMOS image sensors Image Sensor Market by CMOS image sensors
- 6.5.4.1.2. Market size and forecast, by Application
- 6.5.4.2. Middle East
- 6.5.4.2.1. Market size and forecast, by Technology
- 6.5.4.2.1.1. Middle East CMOS image sensors Image Sensor Market by CMOS image sensors
- 6.5.4.2.2. Market size and forecast, by Application
- 6.5.4.3. Africa
- 6.5.4.3.1. Market size and forecast, by Technology
- 6.5.4.3.1.1. Africa CMOS image sensors Image Sensor Market by CMOS image sensors
- 6.5.4.3.2. Market size and forecast, by Application
CHAPTER 7: COMPETITIVE LANDSCAPE
- 7.1. Introduction
- 7.2. Top winning strategies
- 7.3. Product Mapping of Top 10 Player
- 7.4. Competitive Dashboard
- 7.5. Competitive Heatmap
- 7.6. Top player positioning, 2022
CHAPTER 8: COMPANY PROFILES
- 8.1. Canon Inc.
- 8.1.1. Company overview
- 8.1.2. Key Executives
- 8.1.3. Company snapshot
- 8.1.4. Operating business segments
- 8.1.5. Product portfolio
- 8.1.6. Key strategic moves and developments
- 8.2. Samsung Electronics Co. Ltd
- 8.2.1. Company overview
- 8.2.2. Key Executives
- 8.2.3. Company snapshot
- 8.2.4. Operating business segments
- 8.2.5. Product portfolio
- 8.2.6. Business performance
- 8.3. ON Semiconductor Corporation
- 8.3.1. Company overview
- 8.3.2. Key Executives
- 8.3.3. Company snapshot
- 8.3.4. Operating business segments
- 8.3.5. Product portfolio
- 8.3.6. Business performance
- 8.4. Sony Group Corporation
- 8.4.1. Company overview
- 8.4.2. Key Executives
- 8.4.3. Company snapshot
- 8.4.4. Operating business segments
- 8.4.5. Product portfolio
- 8.4.6. Business performance
- 8.4.7. Key strategic moves and developments
- 8.5. STMicroelectronics NV.
- 8.5.1. Company overview
- 8.5.2. Key Executives
- 8.5.3. Company snapshot
- 8.5.4. Operating business segments
- 8.5.5. Product portfolio
- 8.5.6. Business performance
- 8.5.7. Key strategic moves and developments
- 8.6. OMNIVISION
- 8.6.1. Company overview
- 8.6.2. Key Executives
- 8.6.3. Company snapshot
- 8.6.4. Operating business segments
- 8.6.5. Product portfolio
- 8.6.6. Business performance
- 8.6.7. Key strategic moves and developments
- 8.7. GalaxyCore Shanghai Limited Corporation
- 8.7.1. Company overview
- 8.7.2. Key Executives
- 8.7.3. Company snapshot
- 8.7.4. Operating business segments
- 8.7.5. Product portfolio
- 8.8. SK HYNIX INC.
- 8.8.1. Company overview
- 8.8.2. Key Executives
- 8.8.3. Company snapshot
- 8.8.4. Operating business segments
- 8.8.5. Product portfolio
- 8.8.6. Business performance
- 8.8.7. Key strategic moves and developments
- 8.9. PixArt Imaging Inc.
- 8.9.1. Company overview
- 8.9.2. Key Executives
- 8.9.3. Company snapshot
- 8.9.4. Operating business segments
- 8.9.5. Product portfolio
- 8.9.6. Business performance
- 8.10. Panasonic Corporation
- 8.10.1. Company overview
- 8.10.2. Key Executives
- 8.10.3. Company snapshot
- 8.10.4. Operating business segments
- 8.10.5. Product portfolio
- 8.10.6. Business performance