 |
市場調査レポート
商品コード
1365578
コーティング添加剤市場:タイプ別、機能別、配合別、最終使用産業別:世界の機会分析と産業予測、2023~2032年Coating Additives Market By Type, By Function, By Formulation, By End Use Industry : Global Opportunity Analysis and Industry Forecast, 2023-2032 |
||||||

| コーティング添加剤市場:タイプ別、機能別、配合別、最終使用産業別:世界の機会分析と産業予測、2023~2032年 |
|
出版日: 2023年07月01日
発行: Allied Market Research
ページ情報: 英文 469 Pages
納期: 2~3営業日
|
- 全表示
- 概要
- 図表
- 目次
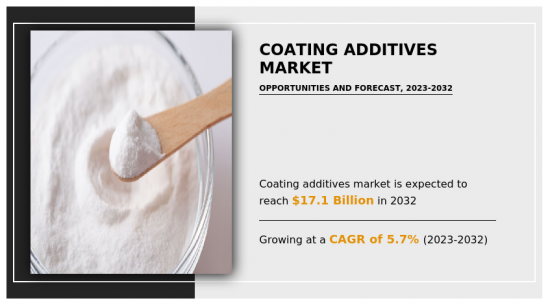
Allied Market Researchの最新レポート「コーティング添加剤市場」によると、コーティング添加剤市場は2022年に100億米ドルと評価され、2023年から2032年にかけてCAGR 5.7%で成長し、2032年には171億米ドルに達すると推定されています。
技術的に高度なコーティング剤は、増粘剤、乳化剤、分散剤、顔料、消泡剤、レベリング剤、光安定剤、硬化触媒、その他の添加剤を含む複雑な処方物となっています。これらの添加剤は樹脂の特性を向上させる。消泡とは、塗膜やコーティングの泡立ちを抑えたり、泡立ちを防止したりする技術です。湿潤と分散は、凝集除去効果を利用して塗膜を安定化させる。レオロジー改質とは、外部応力によって材料の構造や流動性を変化させ、塗膜表面の厚みや粘度を改善することです。殺生物剤は、湿度の高い環境や汚染によって発生する真菌や藻類の繁殖などの微生物学的劣化から塗膜を保護します。衝撃改質は、主にシートや包装フィルムなどの表面変形を抑えるために使用されます。乾燥、表面改質、レベリング、沈降防止、たるみ防止、その他の機能はすべてこれらの添加剤によって行われます。
エンドユーザー産業における用途の増加
コーティング添加剤は、コーティングの性能をコントロールするのに役立つため、コーティングの調合において最も重要な内容物のひとつです。添加剤を使用することで、コーティングや樹脂の自然な特性を変化させ、より高品質の完成品を提供することができます。これらの添加剤の用途は、家具や建築から自動車用コーティングまで多岐にわたる。コーティング配合物のレオロジー、濡れ性、分散性、防汚性、消泡性を改良するために、コーティング添加剤の使用が増加しています。環境規制の強化に伴い、水性コーティングや粉体コーティングの使用への注目が高まっています。世界のコーティング添加剤市場は、建築、自動車、工業、木材・家具など様々な産業からの需要が増加しています。
コーティング添加剤は、化学的に設計された特殊な機能グループであり、多くの産業で応用されています。これらの機能によって性能が向上するため、コーティング剤への使用はますます一般的になっています。これらの機能は、濡れ性、分散性、レオロジー、UVカット、耐薬品性、高温安定性などの優れた化学的特性を製剤に付与します。過酷な条件下で多くの工業分野で広く使用されています。アーキテクチャでは、コーティングの製造と塗布において、非常に効果的な添加剤の使用が不可欠です。ドイツに本社を置くCHTが開発・製造する建築用コーティング、コンクリート、工業用コーティング、印刷インキ用の添加剤は、所望の製品特性を調整したり、所望の要件に従って製造・塗布工程にプラスの影響を与えるのに大きな効果を発揮します。自動車産業では、添加剤は自動車に独特の外観を与え、顧客にとって好ましいものとなります。
この業界では、斬新なコーティング添加剤が発売されました。自動車部品に高輝度仕上げや他の有彩色、鏡面仕上げを提供するものもあっています。したがって、コーティング添加剤の需要は予測期間中に増加します。さらに、建設業界では、内外装用コーティング、インフラ用保護コーティング、床材や屋根材用コーティングなど、建築用コーティングが広く使用されています。コーティング添加剤は、これらのコーティングの耐久性、耐候性、接着性、外観を向上させるために使用されます。都市化やインフラ整備を背景に建設業界が成長を続けるなか、コーティング添加剤の需要は増加すると予想されます。
さらに、コーティングは基材を保護し、表面特性を高め、機能的な利点を提供するために、さまざまな工業製造工程で広く使用されています。機械、設備、電子機器、家電製品、金属加工などの産業は、美観、耐食性、耐薬品性、耐摩耗性を向上させるためにコーティングを利用しています。コーティング添加剤はこれらの特性を向上させるために使用され、工業生産が拡大するにつれて、コーティング添加剤の需要は伸びています。さらに、海洋産業は、海洋構造物、船舶、海洋施設を腐食、汚損、過酷な海洋環境から保護するためにコーティングに依存しています。コーティング添加剤は、海洋コーティングの性能と寿命を向上させるために使用され、防汚、耐腐食性、紫外線保護などの特典を提供します。海洋インフラと海運活動の成長に伴い、海洋分野におけるコーティング添加剤の需要は増加すると予想されます。
目次
第1章 イントロダクション
第2章 エグゼクティブサマリー
第3章 市場概要
- 市場の定義と範囲
- 主な調査結果
- 影響要因
- 主な投資機会
- ポーターのファイブフォース分析
- 市場力学
- 促進要因
- 低VOCコーティング添加剤に対する支持的な環境規制
- エンドユーザー産業における用途の増加
- 建設業界におけるコーティング添加剤の高い需要
- 抑制要因
- 厳しい環境規制
- 機会
- エコ建設における水性および粉体ベースのコーティング添加剤需要の増加
- 促進要因
- COVID-19市場への影響分析
- バリューチェーン分析
- 価格分析
- 主要規制分析
- 特許情勢
第4章 コーティング添加剤市場:タイプ別
- 概要
- アクリル
- フッ素樹脂
- ウレタン
- 金属添加剤
- その他
第5章 コーティング添加剤市場:機能別
- 概要
- 発泡防止
- 湿潤・分散
- レオロジー改質
- 殺生物剤
- 衝撃改質
- その他
第6章 コーティング添加剤市場:配合別
- 概要
- 水系コーティング
- 溶剤型コーティング
- 無溶剤コーティング
- 粉体コーティング
- 放射線硬化型コーティング
第7章 コーティング添加剤市場:最終使用産業別
- 概要
- アーキテクチャ
- 工業用
- 自動車
- 木材・家具
- その他
第8章 コーティング添加剤市場:地域別
- 概要
- 北米
- 米国
- カナダ
- メキシコ
- 欧州
- ドイツ
- フランス
- 英国
- イタリア
- その他
- アジア太平洋
- 中国
- インド
- 日本
- その他
- ラテンアメリカ・中東・アフリカ
- ブラジル
- サウジアラビア
- 南アフリカ
- その他
第9章 競争情勢
- イントロダクション
- 主要成功戦略
- 主要10企業の製品マッピング
- 競合ダッシュボード
- 競合ヒートマップ
- 主要企業のポジショニング、2022年
第10章 企業プロファイル
- Arkema
- BASF SE
- CLARIANT
- Dow
- Eastman Chemical Company
- Evonik Industries AG
- LANXESS
- Momentive
- Solvay
- Ashland
LIST OF TABLES
- TABLE 01. GLOBAL COATING ADDITIVES MARKET, BY TYPE, 2022-2032 ($MILLION)
- TABLE 02. GLOBAL COATING ADDITIVES MARKET, BY TYPE, 2022-2032 (KILOTON)
- TABLE 03. COATING ADDITIVES MARKET FOR ACRYLIC, BY REGION, 2022-2032 ($MILLION)
- TABLE 04. COATING ADDITIVES MARKET FOR ACRYLIC, BY REGION, 2022-2032 (KILOTON)
- TABLE 05. COATING ADDITIVES MARKET FOR FLUOROPOLYMERS, BY REGION, 2022-2032 ($MILLION)
- TABLE 06. COATING ADDITIVES MARKET FOR FLUOROPOLYMERS, BY REGION, 2022-2032 (KILOTON)
- TABLE 07. COATING ADDITIVES MARKET FOR URETHANES, BY REGION, 2022-2032 ($MILLION)
- TABLE 08. COATING ADDITIVES MARKET FOR URETHANES, BY REGION, 2022-2032 (KILOTON)
- TABLE 09. COATING ADDITIVES MARKET FOR METALLIC ADDITIVES, BY REGION, 2022-2032 ($MILLION)
- TABLE 10. COATING ADDITIVES MARKET FOR METALLIC ADDITIVES, BY REGION, 2022-2032 (KILOTON)
- TABLE 11. COATING ADDITIVES MARKET FOR OTHERS, BY REGION, 2022-2032 ($MILLION)
- TABLE 12. COATING ADDITIVES MARKET FOR OTHERS, BY REGION, 2022-2032 (KILOTON)
- TABLE 13. GLOBAL COATING ADDITIVES MARKET, BY FUNCTION, 2022-2032 ($MILLION)
- TABLE 14. GLOBAL COATING ADDITIVES MARKET, BY FUNCTION, 2022-2032 (KILOTON)
- TABLE 15. COATING ADDITIVES MARKET FOR ANTI FOAMING, BY REGION, 2022-2032 ($MILLION)
- TABLE 16. COATING ADDITIVES MARKET FOR ANTI FOAMING, BY REGION, 2022-2032 (KILOTON)
- TABLE 17. COATING ADDITIVES MARKET FOR WETTING AND DISPERSION, BY REGION, 2022-2032 ($MILLION)
- TABLE 18. COATING ADDITIVES MARKET FOR WETTING AND DISPERSION, BY REGION, 2022-2032 (KILOTON)
- TABLE 19. COATING ADDITIVES MARKET FOR RHEOLOGY MODIFICATION, BY REGION, 2022-2032 ($MILLION)
- TABLE 20. COATING ADDITIVES MARKET FOR RHEOLOGY MODIFICATION, BY REGION, 2022-2032 (KILOTON)
- TABLE 21. COATING ADDITIVES MARKET FOR BIOCIDES, BY REGION, 2022-2032 ($MILLION)
- TABLE 22. COATING ADDITIVES MARKET FOR BIOCIDES, BY REGION, 2022-2032 (KILOTON)
- TABLE 23. COATING ADDITIVES MARKET FOR IMPACT MODIFICATION, BY REGION, 2022-2032 ($MILLION)
- TABLE 24. COATING ADDITIVES MARKET FOR IMPACT MODIFICATION, BY REGION, 2022-2032 (KILOTON)
- TABLE 25. COATING ADDITIVES MARKET FOR OTHERS, BY REGION, 2022-2032 ($MILLION)
- TABLE 26. COATING ADDITIVES MARKET FOR OTHERS, BY REGION, 2022-2032 (KILOTON)
- TABLE 27. GLOBAL COATING ADDITIVES MARKET, BY FORMULATION, 2022-2032 ($MILLION)
- TABLE 28. GLOBAL COATING ADDITIVES MARKET, BY FORMULATION, 2022-2032 (KILOTON)
- TABLE 29. COATING ADDITIVES MARKET FOR WATER BORNE COATING, BY REGION, 2022-2032 ($MILLION)
- TABLE 30. COATING ADDITIVES MARKET FOR WATER BORNE COATING, BY REGION, 2022-2032 (KILOTON)
- TABLE 31. COATING ADDITIVES MARKET FOR SOLVENT BORNE COATING, BY REGION, 2022-2032 ($MILLION)
- TABLE 32. COATING ADDITIVES MARKET FOR SOLVENT BORNE COATING, BY REGION, 2022-2032 (KILOTON)
- TABLE 33. COATING ADDITIVES MARKET FOR SOLVENTLESS COATING, BY REGION, 2022-2032 ($MILLION)
- TABLE 34. COATING ADDITIVES MARKET FOR SOLVENTLESS COATING, BY REGION, 2022-2032 (KILOTON)
- TABLE 35. COATING ADDITIVES MARKET FOR POWDER COATING, BY REGION, 2022-2032 ($MILLION)
- TABLE 36. COATING ADDITIVES MARKET FOR POWDER COATING, BY REGION, 2022-2032 (KILOTON)
- TABLE 37. COATING ADDITIVES MARKET FOR RADIATION CURABLE COATING, BY REGION, 2022-2032 ($MILLION)
- TABLE 38. COATING ADDITIVES MARKET FOR RADIATION CURABLE COATING, BY REGION, 2022-2032 (KILOTON)
- TABLE 39. GLOBAL COATING ADDITIVES MARKET, BY END USE INDUSTRY, 2022-2032 ($MILLION)
- TABLE 40. GLOBAL COATING ADDITIVES MARKET, BY END USE INDUSTRY, 2022-2032 (KILOTON)
- TABLE 41. COATING ADDITIVES MARKET FOR ARCHITECTURAL, BY REGION, 2022-2032 ($MILLION)
- TABLE 42. COATING ADDITIVES MARKET FOR ARCHITECTURAL, BY REGION, 2022-2032 (KILOTON)
- TABLE 43. COATING ADDITIVES MARKET FOR INDUSTRIAL, BY REGION, 2022-2032 ($MILLION)
- TABLE 44. COATING ADDITIVES MARKET FOR INDUSTRIAL, BY REGION, 2022-2032 (KILOTON)
- TABLE 45. COATING ADDITIVES MARKET FOR AUTOMOTIVE, BY REGION, 2022-2032 ($MILLION)
- TABLE 46. COATING ADDITIVES MARKET FOR AUTOMOTIVE, BY REGION, 2022-2032 (KILOTON)
- TABLE 47. COATING ADDITIVES MARKET FOR WOOD AND FURNITURE, BY REGION, 2022-2032 ($MILLION)
- TABLE 48. COATING ADDITIVES MARKET FOR WOOD AND FURNITURE, BY REGION, 2022-2032 (KILOTON)
- TABLE 49. COATING ADDITIVES MARKET FOR OTHERS, BY REGION, 2022-2032 ($MILLION)
- TABLE 50. COATING ADDITIVES MARKET FOR OTHERS, BY REGION, 2022-2032 (KILOTON)
- TABLE 51. COATING ADDITIVES MARKET, BY REGION, 2022-2032 ($MILLION)
- TABLE 52. COATING ADDITIVES MARKET, BY REGION, 2022-2032 (KILOTON)
- TABLE 53. NORTH AMERICA COATING ADDITIVES MARKET, BY TYPE, 2022-2032 ($MILLION)
- TABLE 54. NORTH AMERICA COATING ADDITIVES MARKET, BY TYPE, 2022-2032 (KILOTON)
- TABLE 55. NORTH AMERICA COATING ADDITIVES MARKET, BY FUNCTION, 2022-2032 ($MILLION)
- TABLE 56. NORTH AMERICA COATING ADDITIVES MARKET, BY FUNCTION, 2022-2032 (KILOTON)
- TABLE 57. NORTH AMERICA COATING ADDITIVES MARKET, BY FORMULATION, 2022-2032 ($MILLION)
- TABLE 58. NORTH AMERICA COATING ADDITIVES MARKET, BY FORMULATION, 2022-2032 (KILOTON)
- TABLE 59. NORTH AMERICA COATING ADDITIVES MARKET, BY END USE INDUSTRY, 2022-2032 ($MILLION)
- TABLE 60. NORTH AMERICA COATING ADDITIVES MARKET, BY END USE INDUSTRY, 2022-2032 (KILOTON)
- TABLE 61. NORTH AMERICA COATING ADDITIVES MARKET, BY COUNTRY, 2022-2032 ($MILLION)
- TABLE 62. NORTH AMERICA COATING ADDITIVES MARKET, BY COUNTRY, 2022-2032 (KILOTON)
- TABLE 63. U.S. COATING ADDITIVES MARKET, BY TYPE, 2022-2032 ($MILLION)
- TABLE 64. U.S. COATING ADDITIVES MARKET, BY TYPE, 2022-2032 (KILOTON)
- TABLE 65. U.S. COATING ADDITIVES MARKET, BY FUNCTION, 2022-2032 ($MILLION)
- TABLE 66. U.S. COATING ADDITIVES MARKET, BY FUNCTION, 2022-2032 (KILOTON)
- TABLE 67. U.S. COATING ADDITIVES MARKET, BY FORMULATION, 2022-2032 ($MILLION)
- TABLE 68. U.S. COATING ADDITIVES MARKET, BY FORMULATION, 2022-2032 (KILOTON)
- TABLE 69. U.S. COATING ADDITIVES MARKET, BY END USE INDUSTRY, 2022-2032 ($MILLION)
- TABLE 70. U.S. COATING ADDITIVES MARKET, BY END USE INDUSTRY, 2022-2032 (KILOTON)
- TABLE 71. CANADA COATING ADDITIVES MARKET, BY TYPE, 2022-2032 ($MILLION)
- TABLE 72. CANADA COATING ADDITIVES MARKET, BY TYPE, 2022-2032 (KILOTON)
- TABLE 73. CANADA COATING ADDITIVES MARKET, BY FUNCTION, 2022-2032 ($MILLION)
- TABLE 74. CANADA COATING ADDITIVES MARKET, BY FUNCTION, 2022-2032 (KILOTON)
- TABLE 75. CANADA COATING ADDITIVES MARKET, BY FORMULATION, 2022-2032 ($MILLION)
- TABLE 76. CANADA COATING ADDITIVES MARKET, BY FORMULATION, 2022-2032 (KILOTON)
- TABLE 77. CANADA COATING ADDITIVES MARKET, BY END USE INDUSTRY, 2022-2032 ($MILLION)
- TABLE 78. CANADA COATING ADDITIVES MARKET, BY END USE INDUSTRY, 2022-2032 (KILOTON)
- TABLE 79. MEXICO COATING ADDITIVES MARKET, BY TYPE, 2022-2032 ($MILLION)
- TABLE 80. MEXICO COATING ADDITIVES MARKET, BY TYPE, 2022-2032 (KILOTON)
- TABLE 81. MEXICO COATING ADDITIVES MARKET, BY FUNCTION, 2022-2032 ($MILLION)
- TABLE 82. MEXICO COATING ADDITIVES MARKET, BY FUNCTION, 2022-2032 (KILOTON)
- TABLE 83. MEXICO COATING ADDITIVES MARKET, BY FORMULATION, 2022-2032 ($MILLION)
- TABLE 84. MEXICO COATING ADDITIVES MARKET, BY FORMULATION, 2022-2032 (KILOTON)
- TABLE 85. MEXICO COATING ADDITIVES MARKET, BY END USE INDUSTRY, 2022-2032 ($MILLION)
- TABLE 86. MEXICO COATING ADDITIVES MARKET, BY END USE INDUSTRY, 2022-2032 (KILOTON)
- TABLE 87. EUROPE COATING ADDITIVES MARKET, BY TYPE, 2022-2032 ($MILLION)
- TABLE 88. EUROPE COATING ADDITIVES MARKET, BY TYPE, 2022-2032 (KILOTON)
- TABLE 89. EUROPE COATING ADDITIVES MARKET, BY FUNCTION, 2022-2032 ($MILLION)
- TABLE 90. EUROPE COATING ADDITIVES MARKET, BY FUNCTION, 2022-2032 (KILOTON)
- TABLE 91. EUROPE COATING ADDITIVES MARKET, BY FORMULATION, 2022-2032 ($MILLION)
- TABLE 92. EUROPE COATING ADDITIVES MARKET, BY FORMULATION, 2022-2032 (KILOTON)
- TABLE 93. EUROPE COATING ADDITIVES MARKET, BY END USE INDUSTRY, 2022-2032 ($MILLION)
- TABLE 94. EUROPE COATING ADDITIVES MARKET, BY END USE INDUSTRY, 2022-2032 (KILOTON)
- TABLE 95. EUROPE COATING ADDITIVES MARKET, BY COUNTRY, 2022-2032 ($MILLION)
- TABLE 96. EUROPE COATING ADDITIVES MARKET, BY COUNTRY, 2022-2032 (KILOTON)
- TABLE 97. GERMANY COATING ADDITIVES MARKET, BY TYPE, 2022-2032 ($MILLION)
- TABLE 98. GERMANY COATING ADDITIVES MARKET, BY TYPE, 2022-2032 (KILOTON)
- TABLE 99. GERMANY COATING ADDITIVES MARKET, BY FUNCTION, 2022-2032 ($MILLION)
- TABLE 100. GERMANY COATING ADDITIVES MARKET, BY FUNCTION, 2022-2032 (KILOTON)
- TABLE 101. GERMANY COATING ADDITIVES MARKET, BY FORMULATION, 2022-2032 ($MILLION)
- TABLE 102. GERMANY COATING ADDITIVES MARKET, BY FORMULATION, 2022-2032 (KILOTON)
- TABLE 103. GERMANY COATING ADDITIVES MARKET, BY END USE INDUSTRY, 2022-2032 ($MILLION)
- TABLE 104. GERMANY COATING ADDITIVES MARKET, BY END USE INDUSTRY, 2022-2032 (KILOTON)
- TABLE 105. FRANCE COATING ADDITIVES MARKET, BY TYPE, 2022-2032 ($MILLION)
- TABLE 106. FRANCE COATING ADDITIVES MARKET, BY TYPE, 2022-2032 (KILOTON)
- TABLE 107. FRANCE COATING ADDITIVES MARKET, BY FUNCTION, 2022-2032 ($MILLION)
- TABLE 108. FRANCE COATING ADDITIVES MARKET, BY FUNCTION, 2022-2032 (KILOTON)
- TABLE 109. FRANCE COATING ADDITIVES MARKET, BY FORMULATION, 2022-2032 ($MILLION)
- TABLE 110. FRANCE COATING ADDITIVES MARKET, BY FORMULATION, 2022-2032 (KILOTON)
- TABLE 111. FRANCE COATING ADDITIVES MARKET, BY END USE INDUSTRY, 2022-2032 ($MILLION)
- TABLE 112. FRANCE COATING ADDITIVES MARKET, BY END USE INDUSTRY, 2022-2032 (KILOTON)
- TABLE 113. UK COATING ADDITIVES MARKET, BY TYPE, 2022-2032 ($MILLION)
- TABLE 114. UK COATING ADDITIVES MARKET, BY TYPE, 2022-2032 (KILOTON)
- TABLE 115. UK COATING ADDITIVES MARKET, BY FUNCTION, 2022-2032 ($MILLION)
- TABLE 116. UK COATING ADDITIVES MARKET, BY FUNCTION, 2022-2032 (KILOTON)
- TABLE 117. UK COATING ADDITIVES MARKET, BY FORMULATION, 2022-2032 ($MILLION)
- TABLE 118. UK COATING ADDITIVES MARKET, BY FORMULATION, 2022-2032 (KILOTON)
- TABLE 119. UK COATING ADDITIVES MARKET, BY END USE INDUSTRY, 2022-2032 ($MILLION)
- TABLE 120. UK COATING ADDITIVES MARKET, BY END USE INDUSTRY, 2022-2032 (KILOTON)
- TABLE 121. ITALY COATING ADDITIVES MARKET, BY TYPE, 2022-2032 ($MILLION)
- TABLE 122. ITALY COATING ADDITIVES MARKET, BY TYPE, 2022-2032 (KILOTON)
- TABLE 123. ITALY COATING ADDITIVES MARKET, BY FUNCTION, 2022-2032 ($MILLION)
- TABLE 124. ITALY COATING ADDITIVES MARKET, BY FUNCTION, 2022-2032 (KILOTON)
- TABLE 125. ITALY COATING ADDITIVES MARKET, BY FORMULATION, 2022-2032 ($MILLION)
- TABLE 126. ITALY COATING ADDITIVES MARKET, BY FORMULATION, 2022-2032 (KILOTON)
- TABLE 127. ITALY COATING ADDITIVES MARKET, BY END USE INDUSTRY, 2022-2032 ($MILLION)
- TABLE 128. ITALY COATING ADDITIVES MARKET, BY END USE INDUSTRY, 2022-2032 (KILOTON)
- TABLE 129. REST OF EUROPE COATING ADDITIVES MARKET, BY TYPE, 2022-2032 ($MILLION)
- TABLE 130. REST OF EUROPE COATING ADDITIVES MARKET, BY TYPE, 2022-2032 (KILOTON)
- TABLE 131. REST OF EUROPE COATING ADDITIVES MARKET, BY FUNCTION, 2022-2032 ($MILLION)
- TABLE 132. REST OF EUROPE COATING ADDITIVES MARKET, BY FUNCTION, 2022-2032 (KILOTON)
- TABLE 133. REST OF EUROPE COATING ADDITIVES MARKET, BY FORMULATION, 2022-2032 ($MILLION)
- TABLE 134. REST OF EUROPE COATING ADDITIVES MARKET, BY FORMULATION, 2022-2032 (KILOTON)
- TABLE 135. REST OF EUROPE COATING ADDITIVES MARKET, BY END USE INDUSTRY, 2022-2032 ($MILLION)
- TABLE 136. REST OF EUROPE COATING ADDITIVES MARKET, BY END USE INDUSTRY, 2022-2032 (KILOTON)
- TABLE 137. ASIA-PACIFIC COATING ADDITIVES MARKET, BY TYPE, 2022-2032 ($MILLION)
- TABLE 138. ASIA-PACIFIC COATING ADDITIVES MARKET, BY TYPE, 2022-2032 (KILOTON)
- TABLE 139. ASIA-PACIFIC COATING ADDITIVES MARKET, BY FUNCTION, 2022-2032 ($MILLION)
- TABLE 140. ASIA-PACIFIC COATING ADDITIVES MARKET, BY FUNCTION, 2022-2032 (KILOTON)
- TABLE 141. ASIA-PACIFIC COATING ADDITIVES MARKET, BY FORMULATION, 2022-2032 ($MILLION)
- TABLE 142. ASIA-PACIFIC COATING ADDITIVES MARKET, BY FORMULATION, 2022-2032 (KILOTON)
- TABLE 143. ASIA-PACIFIC COATING ADDITIVES MARKET, BY END USE INDUSTRY, 2022-2032 ($MILLION)
- TABLE 144. ASIA-PACIFIC COATING ADDITIVES MARKET, BY END USE INDUSTRY, 2022-2032 (KILOTON)
- TABLE 145. ASIA-PACIFIC COATING ADDITIVES MARKET, BY COUNTRY, 2022-2032 ($MILLION)
- TABLE 146. ASIA-PACIFIC COATING ADDITIVES MARKET, BY COUNTRY, 2022-2032 (KILOTON)
- TABLE 147. CHINA COATING ADDITIVES MARKET, BY TYPE, 2022-2032 ($MILLION)
- TABLE 148. CHINA COATING ADDITIVES MARKET, BY TYPE, 2022-2032 (KILOTON)
- TABLE 149. CHINA COATING ADDITIVES MARKET, BY FUNCTION, 2022-2032 ($MILLION)
- TABLE 150. CHINA COATING ADDITIVES MARKET, BY FUNCTION, 2022-2032 (KILOTON)
- TABLE 151. CHINA COATING ADDITIVES MARKET, BY FORMULATION, 2022-2032 ($MILLION)
- TABLE 152. CHINA COATING ADDITIVES MARKET, BY FORMULATION, 2022-2032 (KILOTON)
- TABLE 153. CHINA COATING ADDITIVES MARKET, BY END USE INDUSTRY, 2022-2032 ($MILLION)
- TABLE 154. CHINA COATING ADDITIVES MARKET, BY END USE INDUSTRY, 2022-2032 (KILOTON)
- TABLE 155. INDIA COATING ADDITIVES MARKET, BY TYPE, 2022-2032 ($MILLION)
- TABLE 156. INDIA COATING ADDITIVES MARKET, BY TYPE, 2022-2032 (KILOTON)
- TABLE 157. INDIA COATING ADDITIVES MARKET, BY FUNCTION, 2022-2032 ($MILLION)
- TABLE 158. INDIA COATING ADDITIVES MARKET, BY FUNCTION, 2022-2032 (KILOTON)
- TABLE 159. INDIA COATING ADDITIVES MARKET, BY FORMULATION, 2022-2032 ($MILLION)
- TABLE 160. INDIA COATING ADDITIVES MARKET, BY FORMULATION, 2022-2032 (KILOTON)
- TABLE 161. INDIA COATING ADDITIVES MARKET, BY END USE INDUSTRY, 2022-2032 ($MILLION)
- TABLE 162. INDIA COATING ADDITIVES MARKET, BY END USE INDUSTRY, 2022-2032 (KILOTON)
- TABLE 163. JAPAN COATING ADDITIVES MARKET, BY TYPE, 2022-2032 ($MILLION)
- TABLE 164. JAPAN COATING ADDITIVES MARKET, BY TYPE, 2022-2032 (KILOTON)
- TABLE 165. JAPAN COATING ADDITIVES MARKET, BY FUNCTION, 2022-2032 ($MILLION)
- TABLE 166. JAPAN COATING ADDITIVES MARKET, BY FUNCTION, 2022-2032 (KILOTON)
- TABLE 167. JAPAN COATING ADDITIVES MARKET, BY FORMULATION, 2022-2032 ($MILLION)
- TABLE 168. JAPAN COATING ADDITIVES MARKET, BY FORMULATION, 2022-2032 (KILOTON)
- TABLE 169. JAPAN COATING ADDITIVES MARKET, BY END USE INDUSTRY, 2022-2032 ($MILLION)
- TABLE 170. JAPAN COATING ADDITIVES MARKET, BY END USE INDUSTRY, 2022-2032 (KILOTON)
- TABLE 171. REST OF ASIA-PACIFIC COATING ADDITIVES MARKET, BY TYPE, 2022-2032 ($MILLION)
- TABLE 172. REST OF ASIA-PACIFIC COATING ADDITIVES MARKET, BY TYPE, 2022-2032 (KILOTON)
- TABLE 173. REST OF ASIA-PACIFIC COATING ADDITIVES MARKET, BY FUNCTION, 2022-2032 ($MILLION)
- TABLE 174. REST OF ASIA-PACIFIC COATING ADDITIVES MARKET, BY FUNCTION, 2022-2032 (KILOTON)
- TABLE 175. REST OF ASIA-PACIFIC COATING ADDITIVES MARKET, BY FORMULATION, 2022-2032 ($MILLION)
- TABLE 176. REST OF ASIA-PACIFIC COATING ADDITIVES MARKET, BY FORMULATION, 2022-2032 (KILOTON)
- TABLE 177. REST OF ASIA-PACIFIC COATING ADDITIVES MARKET, BY END USE INDUSTRY, 2022-2032 ($MILLION)
- TABLE 178. REST OF ASIA-PACIFIC COATING ADDITIVES MARKET, BY END USE INDUSTRY, 2022-2032 (KILOTON)
- TABLE 179. LAMEA COATING ADDITIVES MARKET, BY TYPE, 2022-2032 ($MILLION)
- TABLE 180. LAMEA COATING ADDITIVES MARKET, BY TYPE, 2022-2032 (KILOTON)
- TABLE 181. LAMEA COATING ADDITIVES MARKET, BY FUNCTION, 2022-2032 ($MILLION)
- TABLE 182. LAMEA COATING ADDITIVES MARKET, BY FUNCTION, 2022-2032 (KILOTON)
- TABLE 183. LAMEA COATING ADDITIVES MARKET, BY FORMULATION, 2022-2032 ($MILLION)
- TABLE 184. LAMEA COATING ADDITIVES MARKET, BY FORMULATION, 2022-2032 (KILOTON)
- TABLE 185. LAMEA COATING ADDITIVES MARKET, BY END USE INDUSTRY, 2022-2032 ($MILLION)
- TABLE 186. LAMEA COATING ADDITIVES MARKET, BY END USE INDUSTRY, 2022-2032 (KILOTON)
- TABLE 187. LAMEA COATING ADDITIVES MARKET, BY COUNTRY, 2022-2032 ($MILLION)
- TABLE 188. LAMEA COATING ADDITIVES MARKET, BY COUNTRY, 2022-2032 (KILOTON)
- TABLE 189. BRAZIL COATING ADDITIVES MARKET, BY TYPE, 2022-2032 ($MILLION)
- TABLE 190. BRAZIL COATING ADDITIVES MARKET, BY TYPE, 2022-2032 (KILOTON)
- TABLE 191. BRAZIL COATING ADDITIVES MARKET, BY FUNCTION, 2022-2032 ($MILLION)
- TABLE 192. BRAZIL COATING ADDITIVES MARKET, BY FUNCTION, 2022-2032 (KILOTON)
- TABLE 193. BRAZIL COATING ADDITIVES MARKET, BY FORMULATION, 2022-2032 ($MILLION)
- TABLE 194. BRAZIL COATING ADDITIVES MARKET, BY FORMULATION, 2022-2032 (KILOTON)
- TABLE 195. BRAZIL COATING ADDITIVES MARKET, BY END USE INDUSTRY, 2022-2032 ($MILLION)
- TABLE 196. BRAZIL COATING ADDITIVES MARKET, BY END USE INDUSTRY, 2022-2032 (KILOTON)
- TABLE 197. SAUDI ARABIA COATING ADDITIVES MARKET, BY TYPE, 2022-2032 ($MILLION)
- TABLE 198. SAUDI ARABIA COATING ADDITIVES MARKET, BY TYPE, 2022-2032 (KILOTON)
- TABLE 199. SAUDI ARABIA COATING ADDITIVES MARKET, BY FUNCTION, 2022-2032 ($MILLION)
- TABLE 200. SAUDI ARABIA COATING ADDITIVES MARKET, BY FUNCTION, 2022-2032 (KILOTON)
- TABLE 201. SAUDI ARABIA COATING ADDITIVES MARKET, BY FORMULATION, 2022-2032 ($MILLION)
- TABLE 202. SAUDI ARABIA COATING ADDITIVES MARKET, BY FORMULATION, 2022-2032 (KILOTON)
- TABLE 203. SAUDI ARABIA COATING ADDITIVES MARKET, BY END USE INDUSTRY, 2022-2032 ($MILLION)
- TABLE 204. SAUDI ARABIA COATING ADDITIVES MARKET, BY END USE INDUSTRY, 2022-2032 (KILOTON)
- TABLE 205. SOUTH AFRICA COATING ADDITIVES MARKET, BY TYPE, 2022-2032 ($MILLION)
- TABLE 206. SOUTH AFRICA COATING ADDITIVES MARKET, BY TYPE, 2022-2032 (KILOTON)
- TABLE 207. SOUTH AFRICA COATING ADDITIVES MARKET, BY FUNCTION, 2022-2032 ($MILLION)
- TABLE 208. SOUTH AFRICA COATING ADDITIVES MARKET, BY FUNCTION, 2022-2032 (KILOTON)
- TABLE 209. SOUTH AFRICA COATING ADDITIVES MARKET, BY FORMULATION, 2022-2032 ($MILLION)
- TABLE 210. SOUTH AFRICA COATING ADDITIVES MARKET, BY FORMULATION, 2022-2032 (KILOTON)
- TABLE 211. SOUTH AFRICA COATING ADDITIVES MARKET, BY END USE INDUSTRY, 2022-2032 ($MILLION)
- TABLE 212. SOUTH AFRICA COATING ADDITIVES MARKET, BY END USE INDUSTRY, 2022-2032 (KILOTON)
- TABLE 213. REST OF LAMEA COATING ADDITIVES MARKET, BY TYPE, 2022-2032 ($MILLION)
- TABLE 214. REST OF LAMEA COATING ADDITIVES MARKET, BY TYPE, 2022-2032 (KILOTON)
- TABLE 215. REST OF LAMEA COATING ADDITIVES MARKET, BY FUNCTION, 2022-2032 ($MILLION)
- TABLE 216. REST OF LAMEA COATING ADDITIVES MARKET, BY FUNCTION, 2022-2032 (KILOTON)
- TABLE 217. REST OF LAMEA COATING ADDITIVES MARKET, BY FORMULATION, 2022-2032 ($MILLION)
- TABLE 218. REST OF LAMEA COATING ADDITIVES MARKET, BY FORMULATION, 2022-2032 (KILOTON)
- TABLE 219. REST OF LAMEA COATING ADDITIVES MARKET, BY END USE INDUSTRY, 2022-2032 ($MILLION)
- TABLE 220. REST OF LAMEA COATING ADDITIVES MARKET, BY END USE INDUSTRY, 2022-2032 (KILOTON)
- TABLE 221. ARKEMA: KEY EXECUTIVES
- TABLE 222. ARKEMA: COMPANY SNAPSHOT
- TABLE 223. ARKEMA: PRODUCT SEGMENTS
- TABLE 224. ARKEMA: PRODUCT PORTFOLIO
- TABLE 225. ARKEMA: KEY STRATERGIES
- TABLE 226. BASF SE: KEY EXECUTIVES
- TABLE 227. BASF SE: COMPANY SNAPSHOT
- TABLE 228. BASF SE: PRODUCT SEGMENTS
- TABLE 229. BASF SE: PRODUCT PORTFOLIO
- TABLE 230. CLARIANT: KEY EXECUTIVES
- TABLE 231. CLARIANT: COMPANY SNAPSHOT
- TABLE 232. CLARIANT: PRODUCT SEGMENTS
- TABLE 233. CLARIANT: PRODUCT PORTFOLIO
- TABLE 234. DOW: KEY EXECUTIVES
- TABLE 235. DOW: COMPANY SNAPSHOT
- TABLE 236. DOW: PRODUCT SEGMENTS
- TABLE 237. DOW: PRODUCT PORTFOLIO
- TABLE 238. EASTMAN CHEMICAL COMPANY: KEY EXECUTIVES
- TABLE 239. EASTMAN CHEMICAL COMPANY: COMPANY SNAPSHOT
- TABLE 240. EASTMAN CHEMICAL COMPANY: PRODUCT SEGMENTS
- TABLE 241. EASTMAN CHEMICAL COMPANY: PRODUCT PORTFOLIO
- TABLE 242. EVONIK INDUSTRIES AG: KEY EXECUTIVES
- TABLE 243. EVONIK INDUSTRIES AG: COMPANY SNAPSHOT
- TABLE 244. EVONIK INDUSTRIES AG: PRODUCT SEGMENTS
- TABLE 245. EVONIK INDUSTRIES AG: PRODUCT PORTFOLIO
- TABLE 246. EVONIK INDUSTRIES AG: KEY STRATERGIES
- TABLE 247. LANXESS: KEY EXECUTIVES
- TABLE 248. LANXESS: COMPANY SNAPSHOT
- TABLE 249. LANXESS: PRODUCT SEGMENTS
- TABLE 250. LANXESS: PRODUCT PORTFOLIO
- TABLE 251. MOMENTIVE: KEY EXECUTIVES
- TABLE 252. MOMENTIVE: COMPANY SNAPSHOT
- TABLE 253. MOMENTIVE: PRODUCT SEGMENTS
- TABLE 254. MOMENTIVE: PRODUCT PORTFOLIO
- TABLE 255. SOLVAY: KEY EXECUTIVES
- TABLE 256. SOLVAY: COMPANY SNAPSHOT
- TABLE 257. SOLVAY: PRODUCT SEGMENTS
- TABLE 258. SOLVAY: PRODUCT PORTFOLIO
- TABLE 259. SOLVAY: KEY STRATERGIES
- TABLE 260. ASHLAND: KEY EXECUTIVES
- TABLE 261. ASHLAND: COMPANY SNAPSHOT
- TABLE 262. ASHLAND: PRODUCT SEGMENTS
- TABLE 263. ASHLAND: PRODUCT PORTFOLIO
- TABLE 264. ASHLAND: KEY STRATERGIES
LIST OF FIGURES
- FIGURE 01. COATING ADDITIVES MARKET, 2022-2032
- FIGURE 02. SEGMENTATION OF COATING ADDITIVES MARKET,2022-2032
- FIGURE 03. TOP INVESTMENT POCKETS IN COATING ADDITIVES MARKET (2023-2032)
- FIGURE 04. LOW BARGAINING POWER OF SUPPLIERS
- FIGURE 05. LOW THREAT OF NEW ENTRANTS
- FIGURE 06. LOW THREAT OF SUBSTITUTES
- FIGURE 07. LOW INTENSITY OF RIVALRY
- FIGURE 08. LOW BARGAINING POWER OF BUYERS
- FIGURE 09. GLOBAL COATING ADDITIVES MARKET:DRIVERS, RESTRAINTS AND OPPORTUNITIES
- FIGURE 10. PRICING ANALYSIS: COATING ADDITIVES MARKET 2022 AND 2032
- FIGURE 11. IMPACT OF KEY REGULATION: COATING ADDITIVES MARKET
- FIGURE 12. PATENT ANALYSIS BY COMPANY
- FIGURE 13. PATENT ANALYSIS BY COUNTRY
- FIGURE 14. COATING ADDITIVES MARKET, BY TYPE, 2022(%)
- FIGURE 15. COMPARATIVE SHARE ANALYSIS OF COATING ADDITIVES MARKET FOR ACRYLIC, BY COUNTRY 2022 AND 2032(%)
- FIGURE 16. COMPARATIVE SHARE ANALYSIS OF COATING ADDITIVES MARKET FOR FLUOROPOLYMERS, BY COUNTRY 2022 AND 2032(%)
- FIGURE 17. COMPARATIVE SHARE ANALYSIS OF COATING ADDITIVES MARKET FOR URETHANES, BY COUNTRY 2022 AND 2032(%)
- FIGURE 18. COMPARATIVE SHARE ANALYSIS OF COATING ADDITIVES MARKET FOR METALLIC ADDITIVES, BY COUNTRY 2022 AND 2032(%)
- FIGURE 19. COMPARATIVE SHARE ANALYSIS OF COATING ADDITIVES MARKET FOR OTHERS, BY COUNTRY 2022 AND 2032(%)
- FIGURE 20. COATING ADDITIVES MARKET, BY FUNCTION, 2022(%)
- FIGURE 21. COMPARATIVE SHARE ANALYSIS OF COATING ADDITIVES MARKET FOR ANTI FOAMING, BY COUNTRY 2022 AND 2032(%)
- FIGURE 22. COMPARATIVE SHARE ANALYSIS OF COATING ADDITIVES MARKET FOR WETTING AND DISPERSION, BY COUNTRY 2022 AND 2032(%)
- FIGURE 23. COMPARATIVE SHARE ANALYSIS OF COATING ADDITIVES MARKET FOR RHEOLOGY MODIFICATION, BY COUNTRY 2022 AND 2032(%)
- FIGURE 24. COMPARATIVE SHARE ANALYSIS OF COATING ADDITIVES MARKET FOR BIOCIDES, BY COUNTRY 2022 AND 2032(%)
- FIGURE 25. COMPARATIVE SHARE ANALYSIS OF COATING ADDITIVES MARKET FOR IMPACT MODIFICATION, BY COUNTRY 2022 AND 2032(%)
- FIGURE 26. COMPARATIVE SHARE ANALYSIS OF COATING ADDITIVES MARKET FOR OTHERS, BY COUNTRY 2022 AND 2032(%)
- FIGURE 27. COATING ADDITIVES MARKET, BY FORMULATION, 2022(%)
- FIGURE 28. COMPARATIVE SHARE ANALYSIS OF COATING ADDITIVES MARKET FOR WATER BORNE COATING, BY COUNTRY 2022 AND 2032(%)
- FIGURE 29. COMPARATIVE SHARE ANALYSIS OF COATING ADDITIVES MARKET FOR SOLVENT BORNE COATING, BY COUNTRY 2022 AND 2032(%)
- FIGURE 30. COMPARATIVE SHARE ANALYSIS OF COATING ADDITIVES MARKET FOR SOLVENTLESS COATING, BY COUNTRY 2022 AND 2032(%)
- FIGURE 31. COMPARATIVE SHARE ANALYSIS OF COATING ADDITIVES MARKET FOR POWDER COATING, BY COUNTRY 2022 AND 2032(%)
- FIGURE 32. COMPARATIVE SHARE ANALYSIS OF COATING ADDITIVES MARKET FOR RADIATION CURABLE COATING, BY COUNTRY 2022 AND 2032(%)
- FIGURE 33. COATING ADDITIVES MARKET, BY END USE INDUSTRY, 2022(%)
- FIGURE 34. COMPARATIVE SHARE ANALYSIS OF COATING ADDITIVES MARKET FOR ARCHITECTURAL, BY COUNTRY 2022 AND 2032(%)
- FIGURE 35. COMPARATIVE SHARE ANALYSIS OF COATING ADDITIVES MARKET FOR INDUSTRIAL, BY COUNTRY 2022 AND 2032(%)
- FIGURE 36. COMPARATIVE SHARE ANALYSIS OF COATING ADDITIVES MARKET FOR AUTOMOTIVE, BY COUNTRY 2022 AND 2032(%)
- FIGURE 37. COMPARATIVE SHARE ANALYSIS OF COATING ADDITIVES MARKET FOR WOOD AND FURNITURE, BY COUNTRY 2022 AND 2032(%)
- FIGURE 38. COMPARATIVE SHARE ANALYSIS OF COATING ADDITIVES MARKET FOR OTHERS, BY COUNTRY 2022 AND 2032(%)
- FIGURE 39. COATING ADDITIVES MARKET BY REGION, 2022(%)
- FIGURE 40. U.S. COATING ADDITIVES MARKET, 2022-2032 ($MILLION)
- FIGURE 41. CANADA COATING ADDITIVES MARKET, 2022-2032 ($MILLION)
- FIGURE 42. MEXICO COATING ADDITIVES MARKET, 2022-2032 ($MILLION)
- FIGURE 43. GERMANY COATING ADDITIVES MARKET, 2022-2032 ($MILLION)
- FIGURE 44. FRANCE COATING ADDITIVES MARKET, 2022-2032 ($MILLION)
- FIGURE 45. UK COATING ADDITIVES MARKET, 2022-2032 ($MILLION)
- FIGURE 46. ITALY COATING ADDITIVES MARKET, 2022-2032 ($MILLION)
- FIGURE 47. REST OF EUROPE COATING ADDITIVES MARKET, 2022-2032 ($MILLION)
- FIGURE 48. CHINA COATING ADDITIVES MARKET, 2022-2032 ($MILLION)
- FIGURE 49. INDIA COATING ADDITIVES MARKET, 2022-2032 ($MILLION)
- FIGURE 50. JAPAN COATING ADDITIVES MARKET, 2022-2032 ($MILLION)
- FIGURE 51. REST OF ASIA-PACIFIC COATING ADDITIVES MARKET, 2022-2032 ($MILLION)
- FIGURE 52. BRAZIL COATING ADDITIVES MARKET, 2022-2032 ($MILLION)
- FIGURE 53. SAUDI ARABIA COATING ADDITIVES MARKET, 2022-2032 ($MILLION)
- FIGURE 54. SOUTH AFRICA COATING ADDITIVES MARKET, 2022-2032 ($MILLION)
- FIGURE 55. REST OF LAMEA COATING ADDITIVES MARKET, 2022-2032 ($MILLION)
- FIGURE 56. TOP WINNING STRATEGIES, BY YEAR
- FIGURE 57. TOP WINNING STRATEGIES, BY DEVELOPMENT
- FIGURE 58. TOP WINNING STRATEGIES, BY COMPANY
- FIGURE 59. PRODUCT MAPPING OF TOP 10 PLAYERS
- FIGURE 60. COMPETITIVE DASHBOARD
- FIGURE 61. COMPETITIVE HEATMAP: COATING ADDITIVES MARKET
- FIGURE 62. TOP PLAYER POSITIONING, 2022
- FIGURE 63. ARKEMA GROUP: NET SALES, 2019-2021 ($MILLION)
- FIGURE 64. ARKEMA GROUP: REVENUE SHARE BY SEGMENT, 2021 (%)
- FIGURE 65. BASF SE: NET SALES, 2020-2022 ($MILLION)
- FIGURE 66. BASF SE: REVENUE SHARE BY SEGMENT, 2021 (%)
- FIGURE 67. BASF SE: REVENUE SHARE BY REGION, 2021 (%)
- FIGURE 68. CLARIANT: NET REVENUE, 2020-2022 ($MILLION)
- FIGURE 69. CLARIANT: RESEARCH & DEVELOPMENT EXPENDITURE, 2020-2022 ($MILLION)
- FIGURE 70. CLARIANT: REVENUE SHARE BY SEGMENT, 2022 (%)
- FIGURE 71. CLARIANT: REVENUE SHARE BY REGION, 2022 (%)
- FIGURE 72. DOW: NET SALES, 2020-2022 ($MILLION)
- FIGURE 73. DOW: RESEARCH & DEVELOPMENT EXPENDITURE, 2020-2022 ($MILLION)
- FIGURE 74. DOW: REVENUE SHARE BY SEGMENT, 2022 (%)
- FIGURE 75. DOW: REVENUE SHARE BY REGION, 2022 (%)
- FIGURE 76. EASTMAN CHEMICAL COMPANY: NET SALES, 2020-2022 ($MILLION)
- FIGURE 77. EASTMAN CHEMICAL COMPANY: RESEARCH & DEVELOPMENT EXPENDITURE, 2020-2022 ($MILLION)
- FIGURE 78. EASTMAN CHEMICAL COMPANY: REVENUE SHARE BY SEGMENT, 2022 (%)
- FIGURE 79. EASTMAN CHEMICAL COMPANY: REVENUE SHARE BY REGION, 2021 (%)
- FIGURE 80. EVONIK INDUSTRIES AG: NET SALES, 2018-2020 ($MILLION)
- FIGURE 81. EVONIK INDUSTRIES AG: RESEARCH & DEVELOPMENT EXPENDITURE, 2018-2020 ($MILLION)
- FIGURE 82. EVONIK INDUSTRIES AG: REVENUE SHARE BY SEGMENT, 2020 (%)
- FIGURE 83. EVONIK INDUSTRIES AG: REVENUE SHARE BY REGION, 2020 (%)
- FIGURE 84. LANXESS: NET SALES, 2020-2022 ($MILLION)
- FIGURE 85. LANXESS: RESEARCH & DEVELOPMENT EXPENDITURE, 2020-2022 ($MILLION)
- FIGURE 86. LANXESS: REVENUE SHARE BY SEGMENT, 2022 (%)
- FIGURE 87. LANXESS: REVENUE SHARE BY REGION, 2022 (%)
- FIGURE 88. SOLVAY: NET SALES, 2020-2022 ($MILLION)
- FIGURE 89. SOLVAY: RESEARCH & DEVELOPMENT EXPENDITURE, 2020-2022 ($MILLION)
- FIGURE 90. SOLVAY: REVENUE SHARE BY REGION, 2022 (%)
- FIGURE 91. SOLVAY: REVENUE SHARE BY REGION, 2022 (%)
- FIGURE 92. ASHLAND: NET SALES, 2020-2022 ($MILLION)
- FIGURE 93. ASHLAND: RESEARCH & DEVELOPMENT EXPENDITURE, 2020-2022 ($MILLION)
- FIGURE 94. ASHLAND: REVENUE SHARE BY SEGMENT, 2022 (%)
- FIGURE 95. ASHLAND: REVENUE SHARE BY REGION, 2022 (%)
According to a new report published by Allied Market Research, titled, "Coating Additives Market," The coating additives market was valued at $10.0 billion in 2022, and is estimated to reach $17.1 billion by 2032, growing at a CAGR of 5.7% from 2023 to 2032.
Technologically advanced coatings are complex formulas with thickeners, emulsifiers, dispersants, pigments, defoamers, leveling agents, photo-stabilizers, curing catalysts, and other additives. These additives improve properties of resin. Anti-foaming is a technique used for decreasing or preventing generation of foam on paint films or coatings. Wetting and dispersion use deflocculating effect to stabilize films. Rheology modification relates to change in structure or flow of materials, owing to external stress to improve thickness and viscosity of coated surfaces. Biocides protect paint films from microbiological degradation, such as fungal and algal growth, which can occur in humid environments or as a result of contamination. Impact modification is primarily used to reduce surface deformation in sheets, packing films, and other materials. Drying, surface modification, leveling, anti-settling, anti-sagging, and other functions are all performed by these additives.
Increase in Number of Applications in End-User Industries
Coating additives are some of the most important contents in the formulation of a coating, as they help control its performance. Additives can be used to alter natural properties of coating and resin to provide a higher-quality finished product. Applications of these additives range from furniture and construction to automotive coatings. Coating additives are being increasingly used to modify rheology, wetting, dispersing, anti-fouling, and anti-foaming properties of coating formulations. The focus on the use of waterborne and powder coatings is increasing with tightening environmental regulations. The global coatings additives market witnesses increasing demand from various industries including architectural, automotive, industrial, and wood & furniture.
Coating additives are a specialized group of chemically engineered functions that find application in a number of industries. Their use in coatings formulations is increasingly becoming popular, owing to the performance enhancements that these functions offer. They impart excellent chemical properties to the formulation, including improved wettability, dispersion, rheology, UV protection, chemical resistance, and high-temperature stability. They are widely used in many industrial fields under severe conditions. In architecture, use of highly effective additives is essential in production and application of coatings. Additives developed and manufactured by CHT, based in Germany, for architectural paints, concrete, industrial coatings, and printing inks are highly effective in adjusting desired product properties or positively influencing production and application processes according to desired requirements. In the automotive industry, additives provide automobiles a unique appearance, which makes them desirable for customers.
The industry launched novel paint additives. Some offered high sparkle finishes and other chromic colors and mirror-like finishes to automobile components. Thus, demand for coating additives is going to increase during the forecast period. Furthermore, the construction industry extensively uses coatings for architectural purposes, including paints for interior and exterior surfaces, protective coatings for infrastructure, and coatings for flooring and roofing. Coating additives are employed to improve the durability, weather resistance, adhesion, and appearance of these coatings. As the construction industry continues to grow, driven by urbanization and infrastructure development, the demand for coating additives is expected to rise.
Moreover, coatings are widely used in various industrial manufacturing processes to protect substrates, enhance surface properties, and provide functional benefits. Industries such as machinery, equipment, electronics, appliances, and metal fabrication utilize coatings to improve aesthetics, corrosion resistance, chemical resistance, and wear resistance. Coating additives are employed to enhance these properties, and as industrial manufacturing expands, the demand for coating additives grows. Moreover, the marine industry relies on coatings to protect marine structures, ships, and offshore installations from corrosion, fouling, and harsh marine environments. Coating additives are used to improve the performance and longevity of marine coatings, providing benefits such as anti-fouling, corrosion resistance, and UV protection. With the growth in marine infrastructure and shipping activities, the demand for coating additives in the marine sector is expected to rise.
In addition, coatings are applied to packaging materials, such as metal cans, plastic containers, and flexible films, to provide protection, barrier properties, and visual appeal. Coating additives are used to improve adhesion, printability, scratch resistance, and chemical resistance in packaging coatings. As the demand for packaged goods continues to grow, the packaging industry drives the demand for coating additives. The aerospace industry requires coatings that can withstand extreme environmental conditions, including high temperatures, corrosive environments, and aerodynamic stresses. Coating additives play a crucial role in enhancing the performance and durability of aerospace coatings. They are used to improve adhesion, provide thermal protection, reduce weight, and ensure resistance to erosion and chemicals. With the growing aerospace industry, coating additives manufacturers have an opportunity to cater to the specific requirements of this sector. Increase in number of applications in the coatings industry drives the growth of the coating additives market and is expected to have moderate impact on the global coating additives market during the forecast period.
The global coating additives market is segmented on the basis of function, type, formulation, end-use industry, and region. On the basis of function, the market is segmented into anti-foaming, wetting & dispersion, and rheology modification. By type, it is divided into acrylic, fluoropolymers, urethanes, and others. On the basis of formulation, it is segmented into water-borne coatings, solvent-borne coatings, solventless coatings, powder-based coatings, and radiation curable coatings. On the basis of end-use industry, it is segmented into automotive, architectural, industrial, wood & furniture, industrial, and others. On the basis of region, the market is studied across North America, Europe, Asia-Pacific, and LAMEA.
Major players operating in the global coating additives market include, Arkema, BASF, Ashland, Clariant, Dow Chemical Co., Eastman Chemical Co., Evonik, Lanxess, Momentive Performance Materials Inc., and Solvay. These players have adopted product launch as their key strategy to strengthen their presence in the market.
Key Benefits For Stakeholders
- This report provides a quantitative analysis of the market segments, current trends, estimations, and dynamics of the coating additives market analysis from 2022 to 2032 to identify the prevailing coating additives market opportunities.
- The market research is offered along with information related to key drivers, restraints, and opportunities.
- Porter's five forces analysis highlights the potency of buyers and suppliers to enable stakeholders make profit-oriented business decisions and strengthen their supplier-buyer network.
- In-depth analysis of the coating additives market segmentation assists to determine the prevailing market opportunities.
- Major countries in each region are mapped according to their revenue contribution to the global market.
- Market player positioning facilitates benchmarking and provides a clear understanding of the present position of the market players.
- The report includes the analysis of the regional as well as global coating additives market trends, key players, market segments, application areas, and market growth strategies.
Additional benefits you will get with this purchase are:
- Quarterly Update and* (only available with a corporate license, on listed price)
- 5 additional Company Profile of client Choice pre- or Post-purchase, as a free update.
- Free Upcoming Version on the Purchase of Five and Enterprise User License.
- 16 analyst hours of support* (post-purchase, if you find additional data requirements upon review of the report, you may receive support amounting to 16 analyst hours to solve questions, and post-sale queries)
- 15% Free Customization* (in case the scope or segment of the report does not match your requirements, 20% is equivalent to 3 working days of free work, applicable once)
- Free data Pack on the Five and Enterprise User License. (Excel version of the report)
- Free Updated report if the report is 6-12 months old or older.
- 24-hour priority response*
- Free Industry updates and white papers.
Possible Customization with this report (with additional cost and timeline talk to the sales executive to know more)
- Investment Opportunities
- Product Life Cycles
- Pain Point Analysis
- Regulatory Guidelines
- Additional company profiles with specific to client's interest
- Additional country or region analysis- market size and forecast
- Average Selling Price Analysis / Price Point Analysis
- Brands Share Analysis
- Criss-cross segment analysis- market size and forecast
- Expanded list for Company Profiles
- Historic market data
- Import Export Analysis/Data
- Key player details (including location, contact details, supplier/vendor network etc. in excel format)
- List of customers/consumers/raw material suppliers- value chain analysis
- Market share analysis of players at global/region/country level
- Per Capita Consumption Trends
- Product Consumption Analysis
- Reimbursement Scenario
- SWOT Analysis
- Volume Market Size and Forecast
Key Market Segments
By End Use Industry
- Architectural
- Industrial
- Automotive
- Wood and Furniture
- Others
By Formulation
- Water Borne Coating
- Solvent Borne Coating
- Solventless Coating
- Powder Coating
- Radiation Curable Coating
By Function
- Anti Foaming
- Wetting and Dispersion
- Rheology Modification
- Biocides
- Impact Modification
- Others
By Type
- Urethanes
- Metallic Additives
- Others
- Acrylic
- Fluoropolymers
By Region
- North America
- U.S.
- Canada
- Mexico
- Europe
- Germany
- France
- UK
- Italy
- Rest of Europe
- Asia-Pacific
- China
- India
- Japan
- Rest of Asia-Pacific
- LAMEA
- Brazil
- Saudi Arabia
- South Africa
- Rest of LAMEA
Key Market Players:
- Arkema
- BASF SE
- Dow
- Solvay
- Momentive
- Ashland
- LANXESS
- Evonik Industries AG
- Eastman Chemical Company
- CLARIANT
TABLE OF CONTENTS
CHAPTER 1: INTRODUCTION
- 1.1. Report description
- 1.2. Key market segments
- 1.3. Key benefits to the stakeholders
- 1.4. Research Methodology
- 1.4.1. Primary research
- 1.4.2. Secondary research
- 1.4.3. Analyst tools and models
CHAPTER 2: EXECUTIVE SUMMARY
- 2.1. CXO Perspective
CHAPTER 3: MARKET OVERVIEW
- 3.1. Market definition and scope
- 3.2. Key findings
- 3.2.1. Top impacting factors
- 3.2.2. Top investment pockets
- 3.3. Porter's five forces analysis
- 3.3.1. Low bargaining power of suppliers
- 3.3.2. Low threat of new entrants
- 3.3.3. Low threat of substitutes
- 3.3.4. Low intensity of rivalry
- 3.3.5. Low bargaining power of buyers
- 3.4. Market dynamics
- 3.4.1. Drivers
- 3.4.1.1. Supportive Environmental Regulations for Low VOC Coating Additives
- 3.4.1.2. Increase in Number of Applications in End User Industries
- 3.4.1.3. High demand for coating additives in construction industry
- 3.4.1. Drivers
- 3.4.2. Restraints
- 3.4.2.1. Stringent Environmental Regulations
- 3.4.3. Opportunities
- 3.4.3.1. Increase in demand for water-borne and powder-based coating additives in green construction
- 3.5. COVID-19 Impact Analysis on the market
- 3.6. Value Chain Analysis
- 3.7. Pricing Analysis
- 3.8. Key Regulation Analysis
- 3.9. Patent Landscape
CHAPTER 4: COATING ADDITIVES MARKET, BY TYPE
- 4.1. Overview
- 4.1.1. Market size and forecast
- 4.2. Acrylic
- 4.2.1. Key market trends, growth factors and opportunities
- 4.2.2. Market size and forecast, by region
- 4.2.3. Market share analysis by country
- 4.3. Fluoropolymers
- 4.3.1. Key market trends, growth factors and opportunities
- 4.3.2. Market size and forecast, by region
- 4.3.3. Market share analysis by country
- 4.4. Urethanes
- 4.4.1. Key market trends, growth factors and opportunities
- 4.4.2. Market size and forecast, by region
- 4.4.3. Market share analysis by country
- 4.5. Metallic Additives
- 4.5.1. Key market trends, growth factors and opportunities
- 4.5.2. Market size and forecast, by region
- 4.5.3. Market share analysis by country
- 4.6. Others
- 4.6.1. Key market trends, growth factors and opportunities
- 4.6.2. Market size and forecast, by region
- 4.6.3. Market share analysis by country
CHAPTER 5: COATING ADDITIVES MARKET, BY FUNCTION
- 5.1. Overview
- 5.1.1. Market size and forecast
- 5.2. Anti Foaming
- 5.2.1. Key market trends, growth factors and opportunities
- 5.2.2. Market size and forecast, by region
- 5.2.3. Market share analysis by country
- 5.3. Wetting and Dispersion
- 5.3.1. Key market trends, growth factors and opportunities
- 5.3.2. Market size and forecast, by region
- 5.3.3. Market share analysis by country
- 5.4. Rheology Modification
- 5.4.1. Key market trends, growth factors and opportunities
- 5.4.2. Market size and forecast, by region
- 5.4.3. Market share analysis by country
- 5.5. Biocides
- 5.5.1. Key market trends, growth factors and opportunities
- 5.5.2. Market size and forecast, by region
- 5.5.3. Market share analysis by country
- 5.6. Impact Modification
- 5.6.1. Key market trends, growth factors and opportunities
- 5.6.2. Market size and forecast, by region
- 5.6.3. Market share analysis by country
- 5.7. Others
- 5.7.1. Key market trends, growth factors and opportunities
- 5.7.2. Market size and forecast, by region
- 5.7.3. Market share analysis by country
CHAPTER 6: COATING ADDITIVES MARKET, BY FORMULATION
- 6.1. Overview
- 6.1.1. Market size and forecast
- 6.2. Water Borne Coating
- 6.2.1. Key market trends, growth factors and opportunities
- 6.2.2. Market size and forecast, by region
- 6.2.3. Market share analysis by country
- 6.3. Solvent Borne Coating
- 6.3.1. Key market trends, growth factors and opportunities
- 6.3.2. Market size and forecast, by region
- 6.3.3. Market share analysis by country
- 6.4. Solventless Coating
- 6.4.1. Key market trends, growth factors and opportunities
- 6.4.2. Market size and forecast, by region
- 6.4.3. Market share analysis by country
- 6.5. Powder Coating
- 6.5.1. Key market trends, growth factors and opportunities
- 6.5.2. Market size and forecast, by region
- 6.5.3. Market share analysis by country
- 6.6. Radiation Curable Coating
- 6.6.1. Key market trends, growth factors and opportunities
- 6.6.2. Market size and forecast, by region
- 6.6.3. Market share analysis by country
CHAPTER 7: COATING ADDITIVES MARKET, BY END USE INDUSTRY
- 7.1. Overview
- 7.1.1. Market size and forecast
- 7.2. Architectural
- 7.2.1. Key market trends, growth factors and opportunities
- 7.2.2. Market size and forecast, by region
- 7.2.3. Market share analysis by country
- 7.3. Industrial
- 7.3.1. Key market trends, growth factors and opportunities
- 7.3.2. Market size and forecast, by region
- 7.3.3. Market share analysis by country
- 7.4. Automotive
- 7.4.1. Key market trends, growth factors and opportunities
- 7.4.2. Market size and forecast, by region
- 7.4.3. Market share analysis by country
- 7.5. Wood and Furniture
- 7.5.1. Key market trends, growth factors and opportunities
- 7.5.2. Market size and forecast, by region
- 7.5.3. Market share analysis by country
- 7.6. Others
- 7.6.1. Key market trends, growth factors and opportunities
- 7.6.2. Market size and forecast, by region
- 7.6.3. Market share analysis by country
CHAPTER 8: COATING ADDITIVES MARKET, BY REGION
- 8.1. Overview
- 8.1.1. Market size and forecast By Region
- 8.2. North America
- 8.2.1. Key trends and opportunities
- 8.2.2. Market size and forecast, by Type
- 8.2.3. Market size and forecast, by Function
- 8.2.4. Market size and forecast, by Formulation
- 8.2.5. Market size and forecast, by End Use Industry
- 8.2.6. Market size and forecast, by country
- 8.2.6.1. U.S.
- 8.2.6.1.1. Key market trends, growth factors and opportunities
- 8.2.6.1.2. Market size and forecast, by Type
- 8.2.6.1.3. Market size and forecast, by Function
- 8.2.6.1.4. Market size and forecast, by Formulation
- 8.2.6.1.5. Market size and forecast, by End Use Industry
- 8.2.6.2. Canada
- 8.2.6.2.1. Key market trends, growth factors and opportunities
- 8.2.6.2.2. Market size and forecast, by Type
- 8.2.6.2.3. Market size and forecast, by Function
- 8.2.6.2.4. Market size and forecast, by Formulation
- 8.2.6.2.5. Market size and forecast, by End Use Industry
- 8.2.6.3. Mexico
- 8.2.6.3.1. Key market trends, growth factors and opportunities
- 8.2.6.3.2. Market size and forecast, by Type
- 8.2.6.3.3. Market size and forecast, by Function
- 8.2.6.3.4. Market size and forecast, by Formulation
- 8.2.6.3.5. Market size and forecast, by End Use Industry
- 8.3. Europe
- 8.3.1. Key trends and opportunities
- 8.3.2. Market size and forecast, by Type
- 8.3.3. Market size and forecast, by Function
- 8.3.4. Market size and forecast, by Formulation
- 8.3.5. Market size and forecast, by End Use Industry
- 8.3.6. Market size and forecast, by country
- 8.3.6.1. Germany
- 8.3.6.1.1. Key market trends, growth factors and opportunities
- 8.3.6.1.2. Market size and forecast, by Type
- 8.3.6.1.3. Market size and forecast, by Function
- 8.3.6.1.4. Market size and forecast, by Formulation
- 8.3.6.1.5. Market size and forecast, by End Use Industry
- 8.3.6.2. France
- 8.3.6.2.1. Key market trends, growth factors and opportunities
- 8.3.6.2.2. Market size and forecast, by Type
- 8.3.6.2.3. Market size and forecast, by Function
- 8.3.6.2.4. Market size and forecast, by Formulation
- 8.3.6.2.5. Market size and forecast, by End Use Industry
- 8.3.6.3. UK
- 8.3.6.3.1. Key market trends, growth factors and opportunities
- 8.3.6.3.2. Market size and forecast, by Type
- 8.3.6.3.3. Market size and forecast, by Function
- 8.3.6.3.4. Market size and forecast, by Formulation
- 8.3.6.3.5. Market size and forecast, by End Use Industry
- 8.3.6.4. Italy
- 8.3.6.4.1. Key market trends, growth factors and opportunities
- 8.3.6.4.2. Market size and forecast, by Type
- 8.3.6.4.3. Market size and forecast, by Function
- 8.3.6.4.4. Market size and forecast, by Formulation
- 8.3.6.4.5. Market size and forecast, by End Use Industry
- 8.3.6.5. Rest of Europe
- 8.3.6.5.1. Key market trends, growth factors and opportunities
- 8.3.6.5.2. Market size and forecast, by Type
- 8.3.6.5.3. Market size and forecast, by Function
- 8.3.6.5.4. Market size and forecast, by Formulation
- 8.3.6.5.5. Market size and forecast, by End Use Industry
- 8.4. Asia-Pacific
- 8.4.1. Key trends and opportunities
- 8.4.2. Market size and forecast, by Type
- 8.4.3. Market size and forecast, by Function
- 8.4.4. Market size and forecast, by Formulation
- 8.4.5. Market size and forecast, by End Use Industry
- 8.4.6. Market size and forecast, by country
- 8.4.6.1. China
- 8.4.6.1.1. Key market trends, growth factors and opportunities
- 8.4.6.1.2. Market size and forecast, by Type
- 8.4.6.1.3. Market size and forecast, by Function
- 8.4.6.1.4. Market size and forecast, by Formulation
- 8.4.6.1.5. Market size and forecast, by End Use Industry
- 8.4.6.2. India
- 8.4.6.2.1. Key market trends, growth factors and opportunities
- 8.4.6.2.2. Market size and forecast, by Type
- 8.4.6.2.3. Market size and forecast, by Function
- 8.4.6.2.4. Market size and forecast, by Formulation
- 8.4.6.2.5. Market size and forecast, by End Use Industry
- 8.4.6.3. Japan
- 8.4.6.3.1. Key market trends, growth factors and opportunities
- 8.4.6.3.2. Market size and forecast, by Type
- 8.4.6.3.3. Market size and forecast, by Function
- 8.4.6.3.4. Market size and forecast, by Formulation
- 8.4.6.3.5. Market size and forecast, by End Use Industry
- 8.4.6.4. Rest of Asia-Pacific
- 8.4.6.4.1. Key market trends, growth factors and opportunities
- 8.4.6.4.2. Market size and forecast, by Type
- 8.4.6.4.3. Market size and forecast, by Function
- 8.4.6.4.4. Market size and forecast, by Formulation
- 8.4.6.4.5. Market size and forecast, by End Use Industry
- 8.5. LAMEA
- 8.5.1. Key trends and opportunities
- 8.5.2. Market size and forecast, by Type
- 8.5.3. Market size and forecast, by Function
- 8.5.4. Market size and forecast, by Formulation
- 8.5.5. Market size and forecast, by End Use Industry
- 8.5.6. Market size and forecast, by country
- 8.5.6.1. Brazil
- 8.5.6.1.1. Key market trends, growth factors and opportunities
- 8.5.6.1.2. Market size and forecast, by Type
- 8.5.6.1.3. Market size and forecast, by Function
- 8.5.6.1.4. Market size and forecast, by Formulation
- 8.5.6.1.5. Market size and forecast, by End Use Industry
- 8.5.6.2. Saudi Arabia
- 8.5.6.2.1. Key market trends, growth factors and opportunities
- 8.5.6.2.2. Market size and forecast, by Type
- 8.5.6.2.3. Market size and forecast, by Function
- 8.5.6.2.4. Market size and forecast, by Formulation
- 8.5.6.2.5. Market size and forecast, by End Use Industry
- 8.5.6.3. South Africa
- 8.5.6.3.1. Key market trends, growth factors and opportunities
- 8.5.6.3.2. Market size and forecast, by Type
- 8.5.6.3.3. Market size and forecast, by Function
- 8.5.6.3.4. Market size and forecast, by Formulation
- 8.5.6.3.5. Market size and forecast, by End Use Industry
- 8.5.6.4. Rest of LAMEA
- 8.5.6.4.1. Key market trends, growth factors and opportunities
- 8.5.6.4.2. Market size and forecast, by Type
- 8.5.6.4.3. Market size and forecast, by Function
- 8.5.6.4.4. Market size and forecast, by Formulation
- 8.5.6.4.5. Market size and forecast, by End Use Industry
CHAPTER 9: COMPETITIVE LANDSCAPE
- 9.1. Introduction
- 9.2. Top winning strategies
- 9.3. Product Mapping of Top 10 Player
- 9.4. Competitive Dashboard
- 9.5. Competitive Heatmap
- 9.6. Top player positioning, 2022
CHAPTER 10: COMPANY PROFILES
- 10.1. Arkema
- 10.1.1. Company overview
- 10.1.2. Key Executives
- 10.1.3. Company snapshot
- 10.1.4. Operating business segments
- 10.1.5. Product portfolio
- 10.1.6. Business performance
- 10.1.7. Key strategic moves and developments
- 10.2. BASF SE
- 10.2.1. Company overview
- 10.2.2. Key Executives
- 10.2.3. Company snapshot
- 10.2.4. Operating business segments
- 10.2.5. Product portfolio
- 10.2.6. Business performance
- 10.3. CLARIANT
- 10.3.1. Company overview
- 10.3.2. Key Executives
- 10.3.3. Company snapshot
- 10.3.4. Operating business segments
- 10.3.5. Product portfolio
- 10.3.6. Business performance
- 10.4. Dow
- 10.4.1. Company overview
- 10.4.2. Key Executives
- 10.4.3. Company snapshot
- 10.4.4. Operating business segments
- 10.4.5. Product portfolio
- 10.4.6. Business performance
- 10.5. Eastman Chemical Company
- 10.5.1. Company overview
- 10.5.2. Key Executives
- 10.5.3. Company snapshot
- 10.5.4. Operating business segments
- 10.5.5. Product portfolio
- 10.5.6. Business performance
- 10.6. Evonik Industries AG
- 10.6.1. Company overview
- 10.6.2. Key Executives
- 10.6.3. Company snapshot
- 10.6.4. Operating business segments
- 10.6.5. Product portfolio
- 10.6.6. Business performance
- 10.6.7. Key strategic moves and developments
- 10.7. LANXESS
- 10.7.1. Company overview
- 10.7.2. Key Executives
- 10.7.3. Company snapshot
- 10.7.4. Operating business segments
- 10.7.5. Product portfolio
- 10.7.6. Business performance
- 10.8. Momentive
- 10.8.1. Company overview
- 10.8.2. Key Executives
- 10.8.3. Company snapshot
- 10.8.4. Operating business segments
- 10.8.5. Product portfolio
- 10.9. Solvay
- 10.9.1. Company overview
- 10.9.2. Key Executives
- 10.9.3. Company snapshot
- 10.9.4. Operating business segments
- 10.9.5. Product portfolio
- 10.9.6. Business performance
- 10.9.7. Key strategic moves and developments
- 10.10. Ashland
- 10.10.1. Company overview
- 10.10.2. Key Executives
- 10.10.3. Company snapshot
- 10.10.4. Operating business segments
- 10.10.5. Product portfolio
- 10.10.6. Business performance
- 10.10.7. Key strategic moves and developments