
|
市場調査レポート
商品コード
1344532
保証管理システム市場:コンポーネント別、展開モード別、業種別:世界の機会分析と産業予測、2023年~2032年Warranty Management System Market By Component, By Deployment Mode, By Industry Vertical : Global Opportunity Analysis and Industry Forecast, 2023-2032 |
||||||
|
|||||||

| 保証管理システム市場:コンポーネント別、展開モード別、業種別:世界の機会分析と産業予測、2023年~2032年 |
|
出版日: 2023年05月30日
発行: Allied Market Research
ページ情報: 英文 404 Pages
納期: 2~3営業日
|

- 全表示
- 概要
- 図表
- 目次
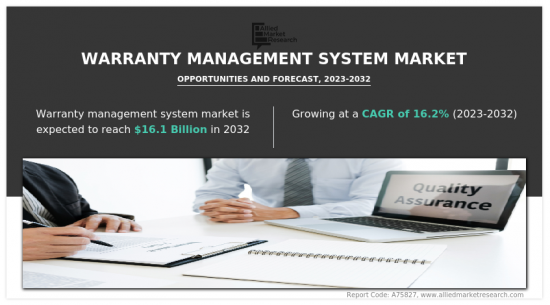
保証管理システム市場は2022年に37億米ドルと評価され、2023年から2032年までのCAGRは16.2%で成長し、2032年には161億米ドルに達すると推定されています。
さらに、世界市場での競争激化に伴い、メーカーはより良いアフターサービスを提供することで製品の差別化を図ろうとしています。これには、保証期間の延長、クレーム処理の迅速化、カスタマーサポートの充実などが含まれます。その結果、メーカー各社は、アフターセールスサービス業務の合理化と顧客満足度の向上のために、保証管理システムに多額の投資を行っており、これが市場の成長につながっています。さらに、クラウドベースのソリューション採用の急増は、保証管理システム市場に大きな影響を与えています。クラウドベースのソリューションを選択する企業が増える中、インターネット接続があれば、いつでも、どこからでも、どんなデバイスからでもアクセスし、管理できる保証管理システムへの需要が増加しています。これにより、クラウドベースの保証管理ソリューションの採用が増加し、保証管理システム市場の成長を促進しています。しかし、変化への抵抗が新技術の採用を制限し、市場の成長に影響を与えています。さらに、保証管理システムのマーケティングやプロモーションが不十分なため、保証管理システムに対する認知度が低いことも、世界市場の主要な阻害要因となっています。それとは逆に、企業が新製品の開発に投資を続けるにつれて、効率的で効果的な保証管理システムの必要性がますます重要になってきています。このように、新技術の出現は、今後数年間、世界の保証管理システム市場の拡大に有利な機会をもたらすと期待されています。
目次
第1章 イントロダクション
第2章 エグゼクティブサマリー
第3章 市場概要
- 市場の定義と範囲
- 主な調査結果
- 影響要因
- 主な投資機会
- ポーターのファイブフォース分析
- 供給企業の交渉力
- 買い手の交渉力
- 代替品の脅威
- 新規参入業者の脅威
- 競合の激しさ
- 市場力学
- 促進要因
- 効率的で合理化された保証管理プロセスに対する需要の増加
- アフターサービスに対する需要の高まり
- クラウドベースのソリューション採用の急増
- 抑制要因
- 変化への抵抗
- 保証管理システムに対する認識不足
- 機会
- 新技術の出現
- 促進要因
- COVID-19:市場への影響分析
第4章 保証管理システム市場:コンポーネント別
- 概要
- ソフトウェア
- サービス
第5章 保証管理システム市場:展開モード別
- 概要
- オンプレミス
- クラウド
第6章 保証管理システム市場:業種別
- 概要
- 製造
- 自動車
- ヘルスケア
- サプライチェーン・物流
- 食品・飲料
- その他
第7章 保証管理システム市場:地域別
- 概要
- 北米
- 米国
- カナダ
- 欧州
- 英国
- ドイツ
- フランス
- イタリア
- スペイン
- その他欧州
- アジア太平洋
- 中国
- 日本
- インド
- オーストラリア
- 韓国
- その他アジア太平洋地域
- ラテンアメリカ
- ラテンアメリカ
- 中東
- アフリカ
第8章 競合情勢
- イントロダクション
- 主要成功戦略
- 主要10社の製品マッピング
- 競合ダッシュボード
- 競合ヒートマップ
- 主要企業のポジショニング、2022年
第9章 企業プロファイル
- Oracle Corporation
- Wipro Limited
- Pegasystems Inc.
- IBM CORPORATION
- Tavant
- Salesforce
- IFS
- SAP
- PTC
- Mize
LIST OF TABLES
- TABLE 01. GLOBAL WARRANTY MANAGEMENT SYSTEM MARKET, BY COMPONENT, 2022-2032 ($MILLION)
- TABLE 02. WARRANTY MANAGEMENT SYSTEM MARKET FOR SOFTWARE, BY REGION, 2022-2032 ($MILLION)
- TABLE 03. WARRANTY MANAGEMENT SYSTEM MARKET FOR SERVICE, BY REGION, 2022-2032 ($MILLION)
- TABLE 04. GLOBAL WARRANTY MANAGEMENT SYSTEM MARKET, BY DEPLOYMENT MODE, 2022-2032 ($MILLION)
- TABLE 05. WARRANTY MANAGEMENT SYSTEM MARKET FOR ON-PREMISE, BY REGION, 2022-2032 ($MILLION)
- TABLE 06. WARRANTY MANAGEMENT SYSTEM MARKET FOR CLOUD, BY REGION, 2022-2032 ($MILLION)
- TABLE 07. GLOBAL WARRANTY MANAGEMENT SYSTEM MARKET, BY INDUSTRY VERTICAL, 2022-2032 ($MILLION)
- TABLE 08. WARRANTY MANAGEMENT SYSTEM MARKET FOR MANUFACTURING, BY REGION, 2022-2032 ($MILLION)
- TABLE 09. WARRANTY MANAGEMENT SYSTEM MARKET FOR AUTOMOTIVE, BY REGION, 2022-2032 ($MILLION)
- TABLE 10. WARRANTY MANAGEMENT SYSTEM MARKET FOR HEALTHCARE, BY REGION, 2022-2032 ($MILLION)
- TABLE 11. WARRANTY MANAGEMENT SYSTEM MARKET FOR SUPPLY CHAIN AND LOGISTICS, BY REGION, 2022-2032 ($MILLION)
- TABLE 12. WARRANTY MANAGEMENT SYSTEM MARKET FOR FOOD AND BEVERAGES, BY REGION, 2022-2032 ($MILLION)
- TABLE 13. WARRANTY MANAGEMENT SYSTEM MARKET FOR OTHERS, BY REGION, 2022-2032 ($MILLION)
- TABLE 14. WARRANTY MANAGEMENT SYSTEM MARKET, BY REGION, 2022-2032 ($MILLION)
- TABLE 15. NORTH AMERICA WARRANTY MANAGEMENT SYSTEM MARKET, BY COMPONENT, 2022-2032 ($MILLION)
- TABLE 16. NORTH AMERICA WARRANTY MANAGEMENT SYSTEM MARKET, BY DEPLOYMENT MODE, 2022-2032 ($MILLION)
- TABLE 17. NORTH AMERICA WARRANTY MANAGEMENT SYSTEM MARKET, BY INDUSTRY VERTICAL, 2022-2032 ($MILLION)
- TABLE 18. NORTH AMERICA WARRANTY MANAGEMENT SYSTEM MARKET, BY COUNTRY, 2022-2032 ($MILLION)
- TABLE 19. U.S. WARRANTY MANAGEMENT SYSTEM MARKET, BY COMPONENT, 2022-2032 ($MILLION)
- TABLE 20. U.S. WARRANTY MANAGEMENT SYSTEM MARKET, BY DEPLOYMENT MODE, 2022-2032 ($MILLION)
- TABLE 21. U.S. WARRANTY MANAGEMENT SYSTEM MARKET, BY INDUSTRY VERTICAL, 2022-2032 ($MILLION)
- TABLE 22. CANADA WARRANTY MANAGEMENT SYSTEM MARKET, BY COMPONENT, 2022-2032 ($MILLION)
- TABLE 23. CANADA WARRANTY MANAGEMENT SYSTEM MARKET, BY DEPLOYMENT MODE, 2022-2032 ($MILLION)
- TABLE 24. CANADA WARRANTY MANAGEMENT SYSTEM MARKET, BY INDUSTRY VERTICAL, 2022-2032 ($MILLION)
- TABLE 25. EUROPE WARRANTY MANAGEMENT SYSTEM MARKET, BY COMPONENT, 2022-2032 ($MILLION)
- TABLE 26. EUROPE WARRANTY MANAGEMENT SYSTEM MARKET, BY DEPLOYMENT MODE, 2022-2032 ($MILLION)
- TABLE 27. EUROPE WARRANTY MANAGEMENT SYSTEM MARKET, BY INDUSTRY VERTICAL, 2022-2032 ($MILLION)
- TABLE 28. EUROPE WARRANTY MANAGEMENT SYSTEM MARKET, BY COUNTRY, 2022-2032 ($MILLION)
- TABLE 29. UK WARRANTY MANAGEMENT SYSTEM MARKET, BY COMPONENT, 2022-2032 ($MILLION)
- TABLE 30. UK WARRANTY MANAGEMENT SYSTEM MARKET, BY DEPLOYMENT MODE, 2022-2032 ($MILLION)
- TABLE 31. UK WARRANTY MANAGEMENT SYSTEM MARKET, BY INDUSTRY VERTICAL, 2022-2032 ($MILLION)
- TABLE 32. GERMANY WARRANTY MANAGEMENT SYSTEM MARKET, BY COMPONENT, 2022-2032 ($MILLION)
- TABLE 33. GERMANY WARRANTY MANAGEMENT SYSTEM MARKET, BY DEPLOYMENT MODE, 2022-2032 ($MILLION)
- TABLE 34. GERMANY WARRANTY MANAGEMENT SYSTEM MARKET, BY INDUSTRY VERTICAL, 2022-2032 ($MILLION)
- TABLE 35. FRANCE WARRANTY MANAGEMENT SYSTEM MARKET, BY COMPONENT, 2022-2032 ($MILLION)
- TABLE 36. FRANCE WARRANTY MANAGEMENT SYSTEM MARKET, BY DEPLOYMENT MODE, 2022-2032 ($MILLION)
- TABLE 37. FRANCE WARRANTY MANAGEMENT SYSTEM MARKET, BY INDUSTRY VERTICAL, 2022-2032 ($MILLION)
- TABLE 38. ITALY WARRANTY MANAGEMENT SYSTEM MARKET, BY COMPONENT, 2022-2032 ($MILLION)
- TABLE 39. ITALY WARRANTY MANAGEMENT SYSTEM MARKET, BY DEPLOYMENT MODE, 2022-2032 ($MILLION)
- TABLE 40. ITALY WARRANTY MANAGEMENT SYSTEM MARKET, BY INDUSTRY VERTICAL, 2022-2032 ($MILLION)
- TABLE 41. SPAIN WARRANTY MANAGEMENT SYSTEM MARKET, BY COMPONENT, 2022-2032 ($MILLION)
- TABLE 42. SPAIN WARRANTY MANAGEMENT SYSTEM MARKET, BY DEPLOYMENT MODE, 2022-2032 ($MILLION)
- TABLE 43. SPAIN WARRANTY MANAGEMENT SYSTEM MARKET, BY INDUSTRY VERTICAL, 2022-2032 ($MILLION)
- TABLE 44. REST OF EUROPE WARRANTY MANAGEMENT SYSTEM MARKET, BY COMPONENT, 2022-2032 ($MILLION)
- TABLE 45. REST OF EUROPE WARRANTY MANAGEMENT SYSTEM MARKET, BY DEPLOYMENT MODE, 2022-2032 ($MILLION)
- TABLE 46. REST OF EUROPE WARRANTY MANAGEMENT SYSTEM MARKET, BY INDUSTRY VERTICAL, 2022-2032 ($MILLION)
- TABLE 47. ASIA-PACIFIC WARRANTY MANAGEMENT SYSTEM MARKET, BY COMPONENT, 2022-2032 ($MILLION)
- TABLE 48. ASIA-PACIFIC WARRANTY MANAGEMENT SYSTEM MARKET, BY DEPLOYMENT MODE, 2022-2032 ($MILLION)
- TABLE 49. ASIA-PACIFIC WARRANTY MANAGEMENT SYSTEM MARKET, BY INDUSTRY VERTICAL, 2022-2032 ($MILLION)
- TABLE 50. ASIA-PACIFIC WARRANTY MANAGEMENT SYSTEM MARKET, BY COUNTRY, 2022-2032 ($MILLION)
- TABLE 51. CHINA WARRANTY MANAGEMENT SYSTEM MARKET, BY COMPONENT, 2022-2032 ($MILLION)
- TABLE 52. CHINA WARRANTY MANAGEMENT SYSTEM MARKET, BY DEPLOYMENT MODE, 2022-2032 ($MILLION)
- TABLE 53. CHINA WARRANTY MANAGEMENT SYSTEM MARKET, BY INDUSTRY VERTICAL, 2022-2032 ($MILLION)
- TABLE 54. JAPAN WARRANTY MANAGEMENT SYSTEM MARKET, BY COMPONENT, 2022-2032 ($MILLION)
- TABLE 55. JAPAN WARRANTY MANAGEMENT SYSTEM MARKET, BY DEPLOYMENT MODE, 2022-2032 ($MILLION)
- TABLE 56. JAPAN WARRANTY MANAGEMENT SYSTEM MARKET, BY INDUSTRY VERTICAL, 2022-2032 ($MILLION)
- TABLE 57. INDIA WARRANTY MANAGEMENT SYSTEM MARKET, BY COMPONENT, 2022-2032 ($MILLION)
- TABLE 58. INDIA WARRANTY MANAGEMENT SYSTEM MARKET, BY DEPLOYMENT MODE, 2022-2032 ($MILLION)
- TABLE 59. INDIA WARRANTY MANAGEMENT SYSTEM MARKET, BY INDUSTRY VERTICAL, 2022-2032 ($MILLION)
- TABLE 60. AUSTRALIA WARRANTY MANAGEMENT SYSTEM MARKET, BY COMPONENT, 2022-2032 ($MILLION)
- TABLE 61. AUSTRALIA WARRANTY MANAGEMENT SYSTEM MARKET, BY DEPLOYMENT MODE, 2022-2032 ($MILLION)
- TABLE 62. AUSTRALIA WARRANTY MANAGEMENT SYSTEM MARKET, BY INDUSTRY VERTICAL, 2022-2032 ($MILLION)
- TABLE 63. SOUTH KOREA WARRANTY MANAGEMENT SYSTEM MARKET, BY COMPONENT, 2022-2032 ($MILLION)
- TABLE 64. SOUTH KOREA WARRANTY MANAGEMENT SYSTEM MARKET, BY DEPLOYMENT MODE, 2022-2032 ($MILLION)
- TABLE 65. SOUTH KOREA WARRANTY MANAGEMENT SYSTEM MARKET, BY INDUSTRY VERTICAL, 2022-2032 ($MILLION)
- TABLE 66. REST OF ASIA-PACIFIC WARRANTY MANAGEMENT SYSTEM MARKET, BY COMPONENT, 2022-2032 ($MILLION)
- TABLE 67. REST OF ASIA-PACIFIC WARRANTY MANAGEMENT SYSTEM MARKET, BY DEPLOYMENT MODE, 2022-2032 ($MILLION)
- TABLE 68. REST OF ASIA-PACIFIC WARRANTY MANAGEMENT SYSTEM MARKET, BY INDUSTRY VERTICAL, 2022-2032 ($MILLION)
- TABLE 69. LAMEA WARRANTY MANAGEMENT SYSTEM MARKET, BY COMPONENT, 2022-2032 ($MILLION)
- TABLE 70. LAMEA WARRANTY MANAGEMENT SYSTEM MARKET, BY DEPLOYMENT MODE, 2022-2032 ($MILLION)
- TABLE 71. LAMEA WARRANTY MANAGEMENT SYSTEM MARKET, BY INDUSTRY VERTICAL, 2022-2032 ($MILLION)
- TABLE 72. LAMEA WARRANTY MANAGEMENT SYSTEM MARKET, BY COUNTRY, 2022-2032 ($MILLION)
- TABLE 73. LATIN AMERICA WARRANTY MANAGEMENT SYSTEM MARKET, BY COMPONENT, 2022-2032 ($MILLION)
- TABLE 74. LATIN AMERICA WARRANTY MANAGEMENT SYSTEM MARKET, BY DEPLOYMENT MODE, 2022-2032 ($MILLION)
- TABLE 75. LATIN AMERICA WARRANTY MANAGEMENT SYSTEM MARKET, BY INDUSTRY VERTICAL, 2022-2032 ($MILLION)
- TABLE 76. MIDDLE EAST WARRANTY MANAGEMENT SYSTEM MARKET, BY COMPONENT, 2022-2032 ($MILLION)
- TABLE 77. MIDDLE EAST WARRANTY MANAGEMENT SYSTEM MARKET, BY DEPLOYMENT MODE, 2022-2032 ($MILLION)
- TABLE 78. MIDDLE EAST WARRANTY MANAGEMENT SYSTEM MARKET, BY INDUSTRY VERTICAL, 2022-2032 ($MILLION)
- TABLE 79. AFRICA WARRANTY MANAGEMENT SYSTEM MARKET, BY COMPONENT, 2022-2032 ($MILLION)
- TABLE 80. AFRICA WARRANTY MANAGEMENT SYSTEM MARKET, BY DEPLOYMENT MODE, 2022-2032 ($MILLION)
- TABLE 81. AFRICA WARRANTY MANAGEMENT SYSTEM MARKET, BY INDUSTRY VERTICAL, 2022-2032 ($MILLION)
- TABLE 82. ORACLE CORPORATION: KEY EXECUTIVES
- TABLE 83. ORACLE CORPORATION: COMPANY SNAPSHOT
- TABLE 84. ORACLE CORPORATION: SERVICE SEGMENTS
- TABLE 85. ORACLE CORPORATION: PRODUCT PORTFOLIO
- TABLE 86. WIPRO LIMITED: KEY EXECUTIVES
- TABLE 87. WIPRO LIMITED: COMPANY SNAPSHOT
- TABLE 88. WIPRO LIMITED: SERVICE SEGMENTS
- TABLE 89. WIPRO LIMITED: PRODUCT PORTFOLIO
- TABLE 90. PEGASYSTEMS INC.: KEY EXECUTIVES
- TABLE 91. PEGASYSTEMS INC.: COMPANY SNAPSHOT
- TABLE 92. PEGASYSTEMS INC.: SERVICE SEGMENTS
- TABLE 93. PEGASYSTEMS INC.: PRODUCT PORTFOLIO
- TABLE 94. PEGASYSTEMS INC.: KEY STRATERGIES
- TABLE 95. IBM CORPORATION: KEY EXECUTIVES
- TABLE 96. IBM CORPORATION: COMPANY SNAPSHOT
- TABLE 97. IBM CORPORATION: SERVICE SEGMENTS
- TABLE 98. IBM CORPORATION: PRODUCT PORTFOLIO
- TABLE 99. TAVANT: KEY EXECUTIVES
- TABLE 100. TAVANT: COMPANY SNAPSHOT
- TABLE 101. TAVANT: SERVICE SEGMENTS
- TABLE 102. TAVANT: PRODUCT PORTFOLIO
- TABLE 103. TAVANT: KEY STRATERGIES
- TABLE 104. SALESFORCE: KEY EXECUTIVES
- TABLE 105. SALESFORCE: COMPANY SNAPSHOT
- TABLE 106. SALESFORCE: SERVICE SEGMENTS
- TABLE 107. SALESFORCE: PRODUCT PORTFOLIO
- TABLE 108. IFS: KEY EXECUTIVES
- TABLE 109. IFS: COMPANY SNAPSHOT
- TABLE 110. IFS: SERVICE SEGMENTS
- TABLE 111. IFS: PRODUCT PORTFOLIO
- TABLE 112. SAP: KEY EXECUTIVES
- TABLE 113. SAP: COMPANY SNAPSHOT
- TABLE 114. SAP: SERVICE SEGMENTS
- TABLE 115. SAP: PRODUCT PORTFOLIO
- TABLE 116. PTC: KEY EXECUTIVES
- TABLE 117. PTC: COMPANY SNAPSHOT
- TABLE 118. PTC: SERVICE SEGMENTS
- TABLE 119. PTC: PRODUCT PORTFOLIO
- TABLE 120. MIZE: KEY EXECUTIVES
- TABLE 121. MIZE: COMPANY SNAPSHOT
- TABLE 122. MIZE: SERVICE SEGMENTS
- TABLE 123. MIZE: PRODUCT PORTFOLIO
LIST OF FIGURES
- FIGURE 01. WARRANTY MANAGEMENT SYSTEM MARKET, 2022-2032
- FIGURE 02. SEGMENTATION OF WARRANTY MANAGEMENT SYSTEM MARKET, 2022-2032
- FIGURE 03. TOP INVESTMENT POCKETS IN WARRANTY MANAGEMENT SYSTEM MARKET (2023-2032)
- FIGURE 04. HIGH TO MODERATE BARGAINING POWER OF SUPPLIERS
- FIGURE 05. MODERATE BARGAINING POWER OF BUYERS
- FIGURE 06. MODERATE TO HIGH THREAT OF SUBSTITUTES
- FIGURE 07. MODERATE TO HIGH THREAT OF NEW ENTRANTS
- FIGURE 08. HIGH TO MODERATE INTENSITY OF RIVALRY
- FIGURE 09. DRIVERS, RESTRAINTS AND OPPORTUNITIES: GLOBALWARRANTY MANAGEMENT SYSTEM MARKET
- FIGURE 10. WARRANTY MANAGEMENT SYSTEM MARKET, BY COMPONENT, 2022(%)
- FIGURE 11. COMPARATIVE SHARE ANALYSIS OF WARRANTY MANAGEMENT SYSTEM MARKET FOR SOFTWARE, BY COUNTRY 2022 AND 2032(%)
- FIGURE 12. COMPARATIVE SHARE ANALYSIS OF WARRANTY MANAGEMENT SYSTEM MARKET FOR SERVICE, BY COUNTRY 2022 AND 2032(%)
- FIGURE 13. WARRANTY MANAGEMENT SYSTEM MARKET, BY DEPLOYMENT MODE, 2022(%)
- FIGURE 14. COMPARATIVE SHARE ANALYSIS OF WARRANTY MANAGEMENT SYSTEM MARKET FOR ON-PREMISE, BY COUNTRY 2022 AND 2032(%)
- FIGURE 15. COMPARATIVE SHARE ANALYSIS OF WARRANTY MANAGEMENT SYSTEM MARKET FOR CLOUD, BY COUNTRY 2022 AND 2032(%)
- FIGURE 16. WARRANTY MANAGEMENT SYSTEM MARKET, BY INDUSTRY VERTICAL, 2022(%)
- FIGURE 17. COMPARATIVE SHARE ANALYSIS OF WARRANTY MANAGEMENT SYSTEM MARKET FOR MANUFACTURING, BY COUNTRY 2022 AND 2032(%)
- FIGURE 18. COMPARATIVE SHARE ANALYSIS OF WARRANTY MANAGEMENT SYSTEM MARKET FOR AUTOMOTIVE, BY COUNTRY 2022 AND 2032(%)
- FIGURE 19. COMPARATIVE SHARE ANALYSIS OF WARRANTY MANAGEMENT SYSTEM MARKET FOR HEALTHCARE, BY COUNTRY 2022 AND 2032(%)
- FIGURE 20. COMPARATIVE SHARE ANALYSIS OF WARRANTY MANAGEMENT SYSTEM MARKET FOR SUPPLY CHAIN AND LOGISTICS, BY COUNTRY 2022 AND 2032(%)
- FIGURE 21. COMPARATIVE SHARE ANALYSIS OF WARRANTY MANAGEMENT SYSTEM MARKET FOR FOOD AND BEVERAGES, BY COUNTRY 2022 AND 2032(%)
- FIGURE 22. COMPARATIVE SHARE ANALYSIS OF WARRANTY MANAGEMENT SYSTEM MARKET FOR OTHERS, BY COUNTRY 2022 AND 2032(%)
- FIGURE 23. WARRANTY MANAGEMENT SYSTEM MARKET BY REGION, 2022
- FIGURE 24. U.S. WARRANTY MANAGEMENT SYSTEM MARKET, 2022-2032 ($MILLION)
- FIGURE 25. CANADA WARRANTY MANAGEMENT SYSTEM MARKET, 2022-2032 ($MILLION)
- FIGURE 26. UK WARRANTY MANAGEMENT SYSTEM MARKET, 2022-2032 ($MILLION)
- FIGURE 27. GERMANY WARRANTY MANAGEMENT SYSTEM MARKET, 2022-2032 ($MILLION)
- FIGURE 28. FRANCE WARRANTY MANAGEMENT SYSTEM MARKET, 2022-2032 ($MILLION)
- FIGURE 29. ITALY WARRANTY MANAGEMENT SYSTEM MARKET, 2022-2032 ($MILLION)
- FIGURE 30. SPAIN WARRANTY MANAGEMENT SYSTEM MARKET, 2022-2032 ($MILLION)
- FIGURE 31. REST OF EUROPE WARRANTY MANAGEMENT SYSTEM MARKET, 2022-2032 ($MILLION)
- FIGURE 32. CHINA WARRANTY MANAGEMENT SYSTEM MARKET, 2022-2032 ($MILLION)
- FIGURE 33. JAPAN WARRANTY MANAGEMENT SYSTEM MARKET, 2022-2032 ($MILLION)
- FIGURE 34. INDIA WARRANTY MANAGEMENT SYSTEM MARKET, 2022-2032 ($MILLION)
- FIGURE 35. AUSTRALIA WARRANTY MANAGEMENT SYSTEM MARKET, 2022-2032 ($MILLION)
- FIGURE 36. SOUTH KOREA WARRANTY MANAGEMENT SYSTEM MARKET, 2022-2032 ($MILLION)
- FIGURE 37. REST OF ASIA-PACIFIC WARRANTY MANAGEMENT SYSTEM MARKET, 2022-2032 ($MILLION)
- FIGURE 38. LATIN AMERICA WARRANTY MANAGEMENT SYSTEM MARKET, 2022-2032 ($MILLION)
- FIGURE 39. MIDDLE EAST WARRANTY MANAGEMENT SYSTEM MARKET, 2022-2032 ($MILLION)
- FIGURE 40. AFRICA WARRANTY MANAGEMENT SYSTEM MARKET, 2022-2032 ($MILLION)
- FIGURE 41. TOP WINNING STRATEGIES, BY YEAR
- FIGURE 42. TOP WINNING STRATEGIES, BY DEVELOPMENT
- FIGURE 43. TOP WINNING STRATEGIES, BY COMPANY
- FIGURE 44. PRODUCT MAPPING OF TOP 10 PLAYERS
- FIGURE 45. COMPETITIVE DASHBOARD
- FIGURE 46. COMPETITIVE HEATMAP: WARRANTY MANAGEMENT SYSTEM MARKET
- FIGURE 47. TOP PLAYER POSITIONING, 2022
- FIGURE 48. ORACLE CORPORATION.: NET REVENUE, 2020-2022 ($MILLION)
- FIGURE 49. ORACLE CORPORATION.: RESEARCH & DEVELOPMENT EXPENDITURE, 2020-2022 ($MILLION)
- FIGURE 50. ORACLE CORPORATION.: REVENUE SHARE BY SEGMENT, 2022 (%)
- FIGURE 51. ORACLE CORPORATION.: REVENUE SHARE BY REGION, 2022 (%)
- FIGURE 52. WIPRO LIMITED: NET REVENUE, 2020-2022 ($MILLION)
- FIGURE 53. WIPRO LIMITED: REVENUE SHARE BY SEGMENT, 2022 (%)
- FIGURE 54. PEGASYSTEMS INC.: NET REVENUE, 2020-2022 ($MILLION)
- FIGURE 55. PEGASYSTEMS INC.: REVENUE SHARE BY SEGMENT, 2021 (%)
- FIGURE 56. PEGASYSTEMS INC.: REVENUE SHARE BY REGION, 2021 (%)
- FIGURE 57. IBM CORPORATION: NET REVENUE, 2020-2022 ($MILLION)
- FIGURE 58. IBM CORPORATION: RESEARCH & DEVELOPMENT EXPENDITURE, 2020-2022 ($MILLION)
- FIGURE 59. IBM CORPORATION: REVENUE SHARE BY SEGMENT, 2022 (%)
- FIGURE 60. IBM CORPORATION: REVENUE SHARE BY REGION, 2022 (%)
- FIGURE 61. SALESFORCE: NET REVENUE, 2020-2022 ($MILLION)
- FIGURE 62. SALESFORCE: REVENUE SHARE BY SEGMENT, 2022 (%)
- FIGURE 63. SALESFORCE: REVENUE SHARE BY REGION, 2022 (%)
- FIGURE 64. SAP: NET REVENUE, 2020-2022 ($MILLION)
- FIGURE 65. PTC: NET REVENUE, 2020-2022 ($MILLION)
- FIGURE 66. PTC: REVENUE SHARE BY SEGMENT, 2022 (%)
- FIGURE 67. PTC: REVENUE SHARE BY REGION, 2022 (%)
According to a new report published by Allied Market Research, titled, "Warranty Management System Market," The warranty management system market was valued at $3.7 billion in 2022, and is estimated to reach $16.1 billion by 2032, growing at a CAGR of 16.2% from 2023 to 2032.
Furthermore, with increasing competition in the global market, manufacturers are striving to differentiate their products by offering better after-sales services. This includes providing extended warranty periods, faster claims processing, and better customer support. As a result, manufacturers are heavily investing in warranty management systems to streamline their after-sales service operations and improve customer satisfaction, which leads to the growth of the market. Moreover, surge in adoption of cloud-based solutions has a significant impact on the warranty management system market. With more companies opting for cloud-based solutions, there has been an increase in the demand for warranty management systems that can be accessed and managed from anywhere, anytime, and through any device with internet connection. This has led to increase in adoption of cloud-based warranty management solutions, thereby driving the growth of the warranty management system market. However, resistance to change limits the adoption of new technologies, which affects the growth of the market. In addition, lack of awareness for the warranty management system due to lack of marketing and promotion of these systems acts as the key deterrent factor of the global market. On the contrary, as companies continue to invest in the development of new products, the need for an efficient and effective warranty management system becomes increasingly important. Thus, the emergence of new technologies is expected to present lucrative opportunities for the expansion of the global warranty management system market in the upcoming years.
The global warranty management system market is segmented into component, deployment mode, industry vertical, and region. Depending on component, it is bifurcated into software and service. By deployment mode, it is segregated into on-premise and cloud. On the basis of industry vertical, it is fragmented into manufacturing, automotive, healthcare, supply chain & logistics, food & beverages, and others. Region wise, it is analyzed across North America, Europe, Asia-Pacific, and LAMEA.
The report analyzes the profiles of key players operating in the warranty management system market such as IBM Corporation, IFS, Mize, Oracle Corporation, Pegasystems Inc., PTC, Salesforce, SAP, Tavant, and Wipro Limited. These players have adopted various strategies to increase their market penetration and strengthen their position in the warranty management system industry.
Key Benefits For Stakeholders
- This report provides a quantitative analysis of the market segments, current trends, estimations, and dynamics of the warranty management system market analysis from 2022 to 2032 to identify the prevailing warranty management system market opportunities.
- The market research is offered along with information related to key drivers, restraints, and opportunities.
- Porter's five forces analysis highlights the potency of buyers and suppliers to enable stakeholders make profit-oriented business decisions and strengthen their supplier-buyer network.
- In-depth analysis of the warranty management system market segmentation assists to determine the prevailing market opportunities.
- Major countries in each region are mapped according to their revenue contribution to the global market.
- Market player positioning facilitates benchmarking and provides a clear understanding of the present position of the market players.
- The report includes the analysis of the regional as well as global warranty management system market trends, key players, market segments, application areas, and market growth strategies.
Key Market Segments
By Component
- Software
- Service
By Deployment Mode
- On-premise
- Cloud
By Industry Vertical
- Manufacturing
- Automotive
- Healthcare
- Supply Chain and Logistics
- Food and Beverages
- Others
By Region
- North America
- U.S.
- Canada
- Europe
- UK
- Germany
- France
- Italy
- Spain
- Rest of Europe
- Asia-Pacific
- China
- Japan
- India
- Australia
- South Korea
- Rest of Asia-Pacific
- LAMEA
- Latin America
- Middle East
- Africa
Key Market Players:
- IBM CORPORATION
- IFS
- Mize
- Oracle Corporation
- Pegasystems Inc.
- PTC
- Salesforce
- SAP
- Tavant
- Wipro Limited
TABLE OF CONTENTS
CHAPTER 1: INTRODUCTION
- 1.1. Report description
- 1.2. Key market segments
- 1.3. Key benefits to the stakeholders
- 1.4. Research Methodology
- 1.4.1. Primary research
- 1.4.2. Secondary research
- 1.4.3. Analyst tools and models
CHAPTER 2: EXECUTIVE SUMMARY
- 2.1. CXO Perspective
CHAPTER 3: MARKET OVERVIEW
- 3.1. Market definition and scope
- 3.2. Key findings
- 3.2.1. Top impacting factors
- 3.2.2. Top investment pockets
- 3.3. Porter's five forces analysis
- 3.3.1. Bargaining power of suppliers
- 3.3.2. Bargaining power of buyers
- 3.3.3. Threat of substitutes
- 3.3.4. Threat of new entrants
- 3.3.5. Intensity of rivalry
- 3.4. Market dynamics
- 3.4.1. Drivers
- 3.4.1.1. Increase in demand for efficient and streamlined warranty management processes
- 3.4.1.2. Rise in demand for after-sales services
- 3.4.1.3. Surge in adoption of cloud-based solutions
- 3.4.1. Drivers
- 3.4.2. Restraints
- 3.4.2.1. Resistance to change
- 3.4.2.2. Lack of awareness for the warranty management system
- 3.4.3. Opportunities
- 3.4.3.1. Emergence of new technologies
- 3.5. COVID-19 Impact Analysis on the market
CHAPTER 4: WARRANTY MANAGEMENT SYSTEM MARKET, BY COMPONENT
- 4.1. Overview
- 4.1.1. Market size and forecast
- 4.2. Software
- 4.2.1. Key market trends, growth factors and opportunities
- 4.2.2. Market size and forecast, by region
- 4.2.3. Market share analysis by country
- 4.3. Service
- 4.3.1. Key market trends, growth factors and opportunities
- 4.3.2. Market size and forecast, by region
- 4.3.3. Market share analysis by country
CHAPTER 5: WARRANTY MANAGEMENT SYSTEM MARKET, BY DEPLOYMENT MODE
- 5.1. Overview
- 5.1.1. Market size and forecast
- 5.2. On-premise
- 5.2.1. Key market trends, growth factors and opportunities
- 5.2.2. Market size and forecast, by region
- 5.2.3. Market share analysis by country
- 5.3. Cloud
- 5.3.1. Key market trends, growth factors and opportunities
- 5.3.2. Market size and forecast, by region
- 5.3.3. Market share analysis by country
CHAPTER 6: WARRANTY MANAGEMENT SYSTEM MARKET, BY INDUSTRY VERTICAL
- 6.1. Overview
- 6.1.1. Market size and forecast
- 6.2. Manufacturing
- 6.2.1. Key market trends, growth factors and opportunities
- 6.2.2. Market size and forecast, by region
- 6.2.3. Market share analysis by country
- 6.3. Automotive
- 6.3.1. Key market trends, growth factors and opportunities
- 6.3.2. Market size and forecast, by region
- 6.3.3. Market share analysis by country
- 6.4. Healthcare
- 6.4.1. Key market trends, growth factors and opportunities
- 6.4.2. Market size and forecast, by region
- 6.4.3. Market share analysis by country
- 6.5. Supply Chain and Logistics
- 6.5.1. Key market trends, growth factors and opportunities
- 6.5.2. Market size and forecast, by region
- 6.5.3. Market share analysis by country
- 6.6. Food and Beverages
- 6.6.1. Key market trends, growth factors and opportunities
- 6.6.2. Market size and forecast, by region
- 6.6.3. Market share analysis by country
- 6.7. Others
- 6.7.1. Key market trends, growth factors and opportunities
- 6.7.2. Market size and forecast, by region
- 6.7.3. Market share analysis by country
CHAPTER 7: WARRANTY MANAGEMENT SYSTEM MARKET, BY REGION
- 7.1. Overview
- 7.1.1. Market size and forecast By Region
- 7.2. North America
- 7.2.1. Key trends and opportunities
- 7.2.2. Market size and forecast, by Component
- 7.2.3. Market size and forecast, by Deployment Mode
- 7.2.4. Market size and forecast, by Industry Vertical
- 7.2.5. Market size and forecast, by country
- 7.2.5.1. U.S.
- 7.2.5.1.1. Key market trends, growth factors and opportunities
- 7.2.5.1.2. Market size and forecast, by Component
- 7.2.5.1.3. Market size and forecast, by Deployment Mode
- 7.2.5.1.4. Market size and forecast, by Industry Vertical
- 7.2.5.2. Canada
- 7.2.5.2.1. Key market trends, growth factors and opportunities
- 7.2.5.2.2. Market size and forecast, by Component
- 7.2.5.2.3. Market size and forecast, by Deployment Mode
- 7.2.5.2.4. Market size and forecast, by Industry Vertical
- 7.3. Europe
- 7.3.1. Key trends and opportunities
- 7.3.2. Market size and forecast, by Component
- 7.3.3. Market size and forecast, by Deployment Mode
- 7.3.4. Market size and forecast, by Industry Vertical
- 7.3.5. Market size and forecast, by country
- 7.3.5.1. UK
- 7.3.5.1.1. Key market trends, growth factors and opportunities
- 7.3.5.1.2. Market size and forecast, by Component
- 7.3.5.1.3. Market size and forecast, by Deployment Mode
- 7.3.5.1.4. Market size and forecast, by Industry Vertical
- 7.3.5.2. Germany
- 7.3.5.2.1. Key market trends, growth factors and opportunities
- 7.3.5.2.2. Market size and forecast, by Component
- 7.3.5.2.3. Market size and forecast, by Deployment Mode
- 7.3.5.2.4. Market size and forecast, by Industry Vertical
- 7.3.5.3. France
- 7.3.5.3.1. Key market trends, growth factors and opportunities
- 7.3.5.3.2. Market size and forecast, by Component
- 7.3.5.3.3. Market size and forecast, by Deployment Mode
- 7.3.5.3.4. Market size and forecast, by Industry Vertical
- 7.3.5.4. Italy
- 7.3.5.4.1. Key market trends, growth factors and opportunities
- 7.3.5.4.2. Market size and forecast, by Component
- 7.3.5.4.3. Market size and forecast, by Deployment Mode
- 7.3.5.4.4. Market size and forecast, by Industry Vertical
- 7.3.5.5. Spain
- 7.3.5.5.1. Key market trends, growth factors and opportunities
- 7.3.5.5.2. Market size and forecast, by Component
- 7.3.5.5.3. Market size and forecast, by Deployment Mode
- 7.3.5.5.4. Market size and forecast, by Industry Vertical
- 7.3.5.6. Rest of Europe
- 7.3.5.6.1. Key market trends, growth factors and opportunities
- 7.3.5.6.2. Market size and forecast, by Component
- 7.3.5.6.3. Market size and forecast, by Deployment Mode
- 7.3.5.6.4. Market size and forecast, by Industry Vertical
- 7.4. Asia-Pacific
- 7.4.1. Key trends and opportunities
- 7.4.2. Market size and forecast, by Component
- 7.4.3. Market size and forecast, by Deployment Mode
- 7.4.4. Market size and forecast, by Industry Vertical
- 7.4.5. Market size and forecast, by country
- 7.4.5.1. China
- 7.4.5.1.1. Key market trends, growth factors and opportunities
- 7.4.5.1.2. Market size and forecast, by Component
- 7.4.5.1.3. Market size and forecast, by Deployment Mode
- 7.4.5.1.4. Market size and forecast, by Industry Vertical
- 7.4.5.2. Japan
- 7.4.5.2.1. Key market trends, growth factors and opportunities
- 7.4.5.2.2. Market size and forecast, by Component
- 7.4.5.2.3. Market size and forecast, by Deployment Mode
- 7.4.5.2.4. Market size and forecast, by Industry Vertical
- 7.4.5.3. India
- 7.4.5.3.1. Key market trends, growth factors and opportunities
- 7.4.5.3.2. Market size and forecast, by Component
- 7.4.5.3.3. Market size and forecast, by Deployment Mode
- 7.4.5.3.4. Market size and forecast, by Industry Vertical
- 7.4.5.4. Australia
- 7.4.5.4.1. Key market trends, growth factors and opportunities
- 7.4.5.4.2. Market size and forecast, by Component
- 7.4.5.4.3. Market size and forecast, by Deployment Mode
- 7.4.5.4.4. Market size and forecast, by Industry Vertical
- 7.4.5.5. South Korea
- 7.4.5.5.1. Key market trends, growth factors and opportunities
- 7.4.5.5.2. Market size and forecast, by Component
- 7.4.5.5.3. Market size and forecast, by Deployment Mode
- 7.4.5.5.4. Market size and forecast, by Industry Vertical
- 7.4.5.6. Rest of Asia-Pacific
- 7.4.5.6.1. Key market trends, growth factors and opportunities
- 7.4.5.6.2. Market size and forecast, by Component
- 7.4.5.6.3. Market size and forecast, by Deployment Mode
- 7.4.5.6.4. Market size and forecast, by Industry Vertical
- 7.5. LAMEA
- 7.5.1. Key trends and opportunities
- 7.5.2. Market size and forecast, by Component
- 7.5.3. Market size and forecast, by Deployment Mode
- 7.5.4. Market size and forecast, by Industry Vertical
- 7.5.5. Market size and forecast, by country
- 7.5.5.1. Latin America
- 7.5.5.1.1. Key market trends, growth factors and opportunities
- 7.5.5.1.2. Market size and forecast, by Component
- 7.5.5.1.3. Market size and forecast, by Deployment Mode
- 7.5.5.1.4. Market size and forecast, by Industry Vertical
- 7.5.5.2. Middle East
- 7.5.5.2.1. Key market trends, growth factors and opportunities
- 7.5.5.2.2. Market size and forecast, by Component
- 7.5.5.2.3. Market size and forecast, by Deployment Mode
- 7.5.5.2.4. Market size and forecast, by Industry Vertical
- 7.5.5.3. Africa
- 7.5.5.3.1. Key market trends, growth factors and opportunities
- 7.5.5.3.2. Market size and forecast, by Component
- 7.5.5.3.3. Market size and forecast, by Deployment Mode
- 7.5.5.3.4. Market size and forecast, by Industry Vertical
CHAPTER 8: COMPETITIVE LANDSCAPE
- 8.1. Introduction
- 8.2. Top winning strategies
- 8.3. Product Mapping of Top 10 Player
- 8.4. Competitive Dashboard
- 8.5. Competitive Heatmap
- 8.6. Top player positioning, 2022
CHAPTER 9: COMPANY PROFILES
- 9.1. Oracle Corporation
- 9.1.1. Company overview
- 9.1.2. Key Executives
- 9.1.3. Company snapshot
- 9.1.4. Operating business segments
- 9.1.5. Product portfolio
- 9.1.6. Business performance
- 9.2. Wipro Limited
- 9.2.1. Company overview
- 9.2.2. Key Executives
- 9.2.3. Company snapshot
- 9.2.4. Operating business segments
- 9.2.5. Product portfolio
- 9.2.6. Business performance
- 9.3. Pegasystems Inc.
- 9.3.1. Company overview
- 9.3.2. Key Executives
- 9.3.3. Company snapshot
- 9.3.4. Operating business segments
- 9.3.5. Product portfolio
- 9.3.6. Business performance
- 9.3.7. Key strategic moves and developments
- 9.4. IBM CORPORATION
- 9.4.1. Company overview
- 9.4.2. Key Executives
- 9.4.3. Company snapshot
- 9.4.4. Operating business segments
- 9.4.5. Product portfolio
- 9.4.6. Business performance
- 9.5. Tavant
- 9.5.1. Company overview
- 9.5.2. Key Executives
- 9.5.3. Company snapshot
- 9.5.4. Operating business segments
- 9.5.5. Product portfolio
- 9.5.6. Key strategic moves and developments
- 9.6. Salesforce
- 9.6.1. Company overview
- 9.6.2. Key Executives
- 9.6.3. Company snapshot
- 9.6.4. Operating business segments
- 9.6.5. Product portfolio
- 9.6.6. Business performance
- 9.7. IFS
- 9.7.1. Company overview
- 9.7.2. Key Executives
- 9.7.3. Company snapshot
- 9.7.4. Operating business segments
- 9.7.5. Product portfolio
- 9.8. SAP
- 9.8.1. Company overview
- 9.8.2. Key Executives
- 9.8.3. Company snapshot
- 9.8.4. Operating business segments
- 9.8.5. Product portfolio
- 9.8.6. Business performance
- 9.9. PTC
- 9.9.1. Company overview
- 9.9.2. Key Executives
- 9.9.3. Company snapshot
- 9.9.4. Operating business segments
- 9.9.5. Product portfolio
- 9.9.6. Business performance
- 9.10. Mize
- 9.10.1. Company overview
- 9.10.2. Key Executives
- 9.10.3. Company snapshot
- 9.10.4. Operating business segments
- 9.10.5. Product portfolio