
|
市場調査レポート
商品コード
1344504
eコマース市場:モデルタイプ別、オファリング別:世界の機会分析と産業予測、2023-2032年E-commerce Market By Model Type (Business-to-consumer, Business-to-business ), By Offering : Global Opportunity Analysis and Industry Forecast, 2023-2032 |
||||||
|
|||||||

| eコマース市場:モデルタイプ別、オファリング別:世界の機会分析と産業予測、2023-2032年 |
|
出版日: 2023年06月01日
発行: Allied Market Research
ページ情報: 英文 225 Pages
納期: 2~3営業日
|

- 全表示
- 概要
- 図表
- 目次
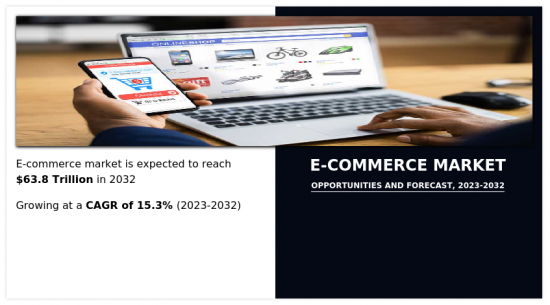
eコマース市場は2022年に15兆7,000億米ドルと評価され、2032年には63兆8,002億米ドルに達し、2023年から2032年までのCAGRは15.3%で成長すると推定されています。
eコマース市場の主な促進要因のひとつは、インターネットアクセスが広く普及し、手頃な価格で利用できるようになったことです。インターネットの普及が世界的に進むにつれ、より多くの個人がオンライン・ショッピング・プラットフォームにアクセスできるようになり、eコマース・ビジネスの顧客基盤が拡大しています。さらに、国際輸送と物流の成長により、消費者は世界中の商品にアクセスできるようになっています。このような国境を越えた取引の拡大は、eコマース市場の成長に大きく貢献しています。さらに、ソーシャルメディアのインフルエンサーが商品やブランドを宣伝するインフルエンサーマーケティングは、人気タレントの信頼と影響力を活用することで、eコマースの成長を促進する効果的な戦略であることが証明されています。しかし、信用やセキュリティへの懸念、物流やインフラの課題は、eコマース市場の成長を妨げる要因のひとつです。それとは逆に、特にモバイル機器やインターネット接続といったテクノロジーの進歩は、eコマース市場の成長に重要な役割を果たしています。さらに、消費者が海外の販売者から商品を購入できるようにする越境eコマースは、今後数年間、eコマース市場の成長に有利な機会を生み出すと予想されます。物流、決済システム、国際貿易政策の改善が越境ECの成長を促進しています。国際商品に対する需要の増加や、アリババの「AliExpress」や、「Amazon Global」のようなプラットフォームの台頭は、さらにこの動向に貢献しています。
目次
第1章 イントロダクション
第2章 エグゼクティブサマリー
第3章 市場概要
- 市場の定義と範囲
- 主な調査結果
- 影響要因
- 主な投資機会
- ポーターのファイブフォース分析
- 供給企業の交渉力
- 買い手の交渉力
- 代替品の脅威
- 新規参入業者の脅威
- 競合の激しさ
- 市場力学
- 促進要因
- インターネット普及率の増加
- モバイルテクノロジーとスマートフォンの急速な普及
- COVID-19パンデミックの影響
- ソーシャルメディアとインフルエンサーマーケティング
- 抑制要因
- 信頼とセキュリティへの懸念
- ロジスティクスとインフラの課題
- 機会
- 技術の進歩
- 国境を越えたeコマース
- 促進要因
- COVID-19市場への影響分析
第4章 eコマース市場:モデルタイプ別
- 概要
- 企業対消費者(B2C)
- 企業対企業(B2B)
第5章 eコマース市場:オファリング別
- 概要
- 美容・パーソナルケア製品
- 家電製品
- ファッション・アパレル
- 家庭用品
- その他
第6章 eコマース市場:地域別
- 概要
- 北米
- 米国
- カナダ
- 欧州
- 英国
- ドイツ
- フランス
- イタリア
- スペイン
- その他欧州
- アジア太平洋
- 中国
- 日本
- インド
- オーストラリア
- 韓国
- その他アジア太平洋地域
- ラテンアメリカ
- ラテンアメリカ
- 中東
- アフリカ
第7章 競合情勢
- イントロダクション
- 主要成功戦略
- 主要10社の製品マッピング
- 競合ダッシュボード
- 競合ヒートマップ
- 主要企業のポジショニング、2022年
第8章 企業プロファイル
- Amazon.com Inc.
- JD.com, Inc.
- Flipkart
- ALIBABA GROUP HOLDING LIMITED
- Walmart Inc.
- Shein
- Wayfair LLC
- eBay Inc.
- Shopify
- pinduoduo.com
LIST OF TABLES
- TABLE 01. GLOBAL E-COMMERCE MARKET, BY MODEL TYPE, 2022-2032 ($BILLION)
- TABLE 02. E-COMMERCE MARKET FOR BUSINESS-TO-CONSUMER (B2C), BY REGION, 2022-2032 ($BILLION)
- TABLE 03. E-COMMERCE MARKET FOR BUSINESS-TO-BUSINESS (B2B), BY REGION, 2022-2032 ($BILLION)
- TABLE 04. GLOBAL E-COMMERCE MARKET, BY OFFERING, 2022-2032 ($BILLION)
- TABLE 05. E-COMMERCE MARKET FOR BEAUTY AND PERSONAL CARE PRODUCTS, BY REGION, 2022-2032 ($BILLION)
- TABLE 06. E-COMMERCE MARKET FOR CONSUMER ELECTRONICS, BY REGION, 2022-2032 ($BILLION)
- TABLE 07. E-COMMERCE MARKET FOR FASHION AND APPAREL, BY REGION, 2022-2032 ($BILLION)
- TABLE 08. E-COMMERCE MARKET FOR HOUSEHOLD PRODUCTS, BY REGION, 2022-2032 ($BILLION)
- TABLE 09. E-COMMERCE MARKET FOR OTHERS, BY REGION, 2022-2032 ($BILLION)
- TABLE 10. E-COMMERCE MARKET, BY REGION, 2022-2032 ($BILLION)
- TABLE 11. NORTH AMERICA E-COMMERCE MARKET, BY MODEL TYPE, 2022-2032 ($BILLION)
- TABLE 12. NORTH AMERICA E-COMMERCE MARKET, BY OFFERING, 2022-2032 ($BILLION)
- TABLE 13. NORTH AMERICA E-COMMERCE MARKET, BY COUNTRY, 2022-2032 ($BILLION)
- TABLE 14. U.S. E-COMMERCE MARKET, BY MODEL TYPE, 2022-2032 ($BILLION)
- TABLE 15. U.S. E-COMMERCE MARKET, BY OFFERING, 2022-2032 ($BILLION)
- TABLE 16. CANADA E-COMMERCE MARKET, BY MODEL TYPE, 2022-2032 ($BILLION)
- TABLE 17. CANADA E-COMMERCE MARKET, BY OFFERING, 2022-2032 ($BILLION)
- TABLE 18. EUROPE E-COMMERCE MARKET, BY MODEL TYPE, 2022-2032 ($BILLION)
- TABLE 19. EUROPE E-COMMERCE MARKET, BY OFFERING, 2022-2032 ($BILLION)
- TABLE 20. EUROPE E-COMMERCE MARKET, BY COUNTRY, 2022-2032 ($BILLION)
- TABLE 21. UK E-COMMERCE MARKET, BY MODEL TYPE, 2022-2032 ($BILLION)
- TABLE 22. UK E-COMMERCE MARKET, BY OFFERING, 2022-2032 ($BILLION)
- TABLE 23. GERMANY E-COMMERCE MARKET, BY MODEL TYPE, 2022-2032 ($BILLION)
- TABLE 24. GERMANY E-COMMERCE MARKET, BY OFFERING, 2022-2032 ($BILLION)
- TABLE 25. FRANCE E-COMMERCE MARKET, BY MODEL TYPE, 2022-2032 ($BILLION)
- TABLE 26. FRANCE E-COMMERCE MARKET, BY OFFERING, 2022-2032 ($BILLION)
- TABLE 27. ITALY E-COMMERCE MARKET, BY MODEL TYPE, 2022-2032 ($BILLION)
- TABLE 28. ITALY E-COMMERCE MARKET, BY OFFERING, 2022-2032 ($BILLION)
- TABLE 29. SPAIN E-COMMERCE MARKET, BY MODEL TYPE, 2022-2032 ($BILLION)
- TABLE 30. SPAIN E-COMMERCE MARKET, BY OFFERING, 2022-2032 ($BILLION)
- TABLE 31. REST OF EUROPE E-COMMERCE MARKET, BY MODEL TYPE, 2022-2032 ($BILLION)
- TABLE 32. REST OF EUROPE E-COMMERCE MARKET, BY OFFERING, 2022-2032 ($BILLION)
- TABLE 33. ASIA-PACIFIC E-COMMERCE MARKET, BY MODEL TYPE, 2022-2032 ($BILLION)
- TABLE 34. ASIA-PACIFIC E-COMMERCE MARKET, BY OFFERING, 2022-2032 ($BILLION)
- TABLE 35. ASIA-PACIFIC E-COMMERCE MARKET, BY COUNTRY, 2022-2032 ($BILLION)
- TABLE 36. CHINA E-COMMERCE MARKET, BY MODEL TYPE, 2022-2032 ($BILLION)
- TABLE 37. CHINA E-COMMERCE MARKET, BY OFFERING, 2022-2032 ($BILLION)
- TABLE 38. JAPAN E-COMMERCE MARKET, BY MODEL TYPE, 2022-2032 ($BILLION)
- TABLE 39. JAPAN E-COMMERCE MARKET, BY OFFERING, 2022-2032 ($BILLION)
- TABLE 40. INDIA E-COMMERCE MARKET, BY MODEL TYPE, 2022-2032 ($BILLION)
- TABLE 41. INDIA E-COMMERCE MARKET, BY OFFERING, 2022-2032 ($BILLION)
- TABLE 42. AUSTRALIA E-COMMERCE MARKET, BY MODEL TYPE, 2022-2032 ($BILLION)
- TABLE 43. AUSTRALIA E-COMMERCE MARKET, BY OFFERING, 2022-2032 ($BILLION)
- TABLE 44. SOUTH KOREA E-COMMERCE MARKET, BY MODEL TYPE, 2022-2032 ($BILLION)
- TABLE 45. SOUTH KOREA E-COMMERCE MARKET, BY OFFERING, 2022-2032 ($BILLION)
- TABLE 46. REST OF ASIA-PACIFIC E-COMMERCE MARKET, BY MODEL TYPE, 2022-2032 ($BILLION)
- TABLE 47. REST OF ASIA-PACIFIC E-COMMERCE MARKET, BY OFFERING, 2022-2032 ($BILLION)
- TABLE 48. LAMEA E-COMMERCE MARKET, BY MODEL TYPE, 2022-2032 ($BILLION)
- TABLE 49. LAMEA E-COMMERCE MARKET, BY OFFERING, 2022-2032 ($BILLION)
- TABLE 50. LAMEA E-COMMERCE MARKET, BY COUNTRY, 2022-2032 ($BILLION)
- TABLE 51. LATIN AMERICA E-COMMERCE MARKET, BY MODEL TYPE, 2022-2032 ($BILLION)
- TABLE 52. LATIN AMERICA E-COMMERCE MARKET, BY OFFERING, 2022-2032 ($BILLION)
- TABLE 53. MIDDLE EAST E-COMMERCE MARKET, BY MODEL TYPE, 2022-2032 ($BILLION)
- TABLE 54. MIDDLE EAST E-COMMERCE MARKET, BY OFFERING, 2022-2032 ($BILLION)
- TABLE 55. AFRICA E-COMMERCE MARKET, BY MODEL TYPE, 2022-2032 ($BILLION)
- TABLE 56. AFRICA E-COMMERCE MARKET, BY OFFERING, 2022-2032 ($BILLION)
- TABLE 57. AMAZON.COM INC.: KEY EXECUTIVES
- TABLE 58. AMAZON.COM INC.: COMPANY SNAPSHOT
- TABLE 59. AMAZON.COM INC.: SERVICE SEGMENTS
- TABLE 60. AMAZON.COM INC.: PRODUCT PORTFOLIO
- TABLE 61. AMAZON.COM INC.: KEY STRATERGIES
- TABLE 62. JD.COM, INC.: KEY EXECUTIVES
- TABLE 63. JD.COM, INC.: COMPANY SNAPSHOT
- TABLE 64. JD.COM, INC.: SERVICE SEGMENTS
- TABLE 65. JD.COM, INC.: PRODUCT PORTFOLIO
- TABLE 66. JD.COM, INC.: KEY STRATERGIES
- TABLE 67. FLIPKART: KEY EXECUTIVES
- TABLE 68. FLIPKART: COMPANY SNAPSHOT
- TABLE 69. FLIPKART: SERVICE SEGMENTS
- TABLE 70. FLIPKART: PRODUCT PORTFOLIO
- TABLE 71. FLIPKART: KEY STRATERGIES
- TABLE 72. ALIBABA GROUP HOLDING LIMITED: KEY EXECUTIVES
- TABLE 73. ALIBABA GROUP HOLDING LIMITED: COMPANY SNAPSHOT
- TABLE 74. ALIBABA GROUP HOLDING LIMITED: SERVICE SEGMENTS
- TABLE 75. ALIBABA GROUP HOLDING LIMITED: PRODUCT PORTFOLIO
- TABLE 76. WALMART INC.: KEY EXECUTIVES
- TABLE 77. WALMART INC.: COMPANY SNAPSHOT
- TABLE 78. WALMART INC.: SERVICE SEGMENTS
- TABLE 79. WALMART INC.: PRODUCT PORTFOLIO
- TABLE 80. WALMART INC.: KEY STRATERGIES
- TABLE 81. SHEIN: KEY EXECUTIVES
- TABLE 82. SHEIN: COMPANY SNAPSHOT
- TABLE 83. SHEIN: SERVICE SEGMENTS
- TABLE 84. SHEIN: PRODUCT PORTFOLIO
- TABLE 85. SHEIN: KEY STRATERGIES
- TABLE 86. WAYFAIR LLC: KEY EXECUTIVES
- TABLE 87. WAYFAIR LLC: COMPANY SNAPSHOT
- TABLE 88. WAYFAIR LLC: SERVICE SEGMENTS
- TABLE 89. WAYFAIR LLC: PRODUCT PORTFOLIO
- TABLE 90. WAYFAIR LLC: KEY STRATERGIES
- TABLE 91. EBAY INC.: KEY EXECUTIVES
- TABLE 92. EBAY INC.: COMPANY SNAPSHOT
- TABLE 93. EBAY INC.: SERVICE SEGMENTS
- TABLE 94. EBAY INC.: PRODUCT PORTFOLIO
- TABLE 95. EBAY INC.: KEY STRATERGIES
- TABLE 96. SHOPIFY: KEY EXECUTIVES
- TABLE 97. SHOPIFY: COMPANY SNAPSHOT
- TABLE 98. SHOPIFY: SERVICE SEGMENTS
- TABLE 99. SHOPIFY: PRODUCT PORTFOLIO
- TABLE 100. SHOPIFY: KEY STRATERGIES
- TABLE 101. PINDUODUO.COM: KEY EXECUTIVES
- TABLE 102. PINDUODUO.COM: COMPANY SNAPSHOT
- TABLE 103. PINDUODUO.COM: SERVICE SEGMENTS
- TABLE 104. PINDUODUO.COM: PRODUCT PORTFOLIO
- TABLE 105. PINDUODUO.COM: KEY STRATERGIES
LIST OF FIGURES
- FIGURE 01. E-COMMERCE MARKET, 2022-2032
- FIGURE 02. SEGMENTATION OF E-COMMERCE MARKET, 2022-2032
- FIGURE 03. TOP INVESTMENT POCKETS IN E-COMMERCE MARKET (2023-2032)
- FIGURE 04. HIGH TO MODERATE BARGAINING POWER OF SUPPLIERS
- FIGURE 05. HIGH TO LOW BARGAINING POWER OF BUYERS
- FIGURE 06. MODERATE TO HIGH THREAT OF SUBSTITUTES
- FIGURE 07. HIGH THREAT OF NEW ENTRANTS
- FIGURE 08. MODERATE TO HIGH INTENSITY OF RIVALRY
- FIGURE 09. DRIVERS, RESTRAINTS AND OPPORTUNITIES: GLOBALE-COMMERCE MARKET
- FIGURE 10. E-COMMERCE MARKET, BY MODEL TYPE, 2022(%)
- FIGURE 11. COMPARATIVE SHARE ANALYSIS OF E-COMMERCE MARKET FOR BUSINESS-TO-CONSUMER (B2C), BY COUNTRY 2022 AND 2032(%)
- FIGURE 12. COMPARATIVE SHARE ANALYSIS OF E-COMMERCE MARKET FOR BUSINESS-TO-BUSINESS (B2B), BY COUNTRY 2022 AND 2032(%)
- FIGURE 13. E-COMMERCE MARKET, BY OFFERING, 2022(%)
- FIGURE 14. COMPARATIVE SHARE ANALYSIS OF E-COMMERCE MARKET FOR BEAUTY AND PERSONAL CARE PRODUCTS, BY COUNTRY 2022 AND 2032(%)
- FIGURE 15. COMPARATIVE SHARE ANALYSIS OF E-COMMERCE MARKET FOR CONSUMER ELECTRONICS, BY COUNTRY 2022 AND 2032(%)
- FIGURE 16. COMPARATIVE SHARE ANALYSIS OF E-COMMERCE MARKET FOR FASHION AND APPAREL, BY COUNTRY 2022 AND 2032(%)
- FIGURE 17. COMPARATIVE SHARE ANALYSIS OF E-COMMERCE MARKET FOR HOUSEHOLD PRODUCTS, BY COUNTRY 2022 AND 2032(%)
- FIGURE 18. COMPARATIVE SHARE ANALYSIS OF E-COMMERCE MARKET FOR OTHERS, BY COUNTRY 2022 AND 2032(%)
- FIGURE 19. E-COMMERCE MARKET BY REGION, 2022
- FIGURE 20. U.S. E-COMMERCE MARKET, 2022-2032 ($BILLION)
- FIGURE 21. CANADA E-COMMERCE MARKET, 2022-2032 ($BILLION)
- FIGURE 22. UK E-COMMERCE MARKET, 2022-2032 ($BILLION)
- FIGURE 23. GERMANY E-COMMERCE MARKET, 2022-2032 ($BILLION)
- FIGURE 24. FRANCE E-COMMERCE MARKET, 2022-2032 ($BILLION)
- FIGURE 25. ITALY E-COMMERCE MARKET, 2022-2032 ($BILLION)
- FIGURE 26. SPAIN E-COMMERCE MARKET, 2022-2032 ($BILLION)
- FIGURE 27. REST OF EUROPE E-COMMERCE MARKET, 2022-2032 ($BILLION)
- FIGURE 28. CHINA E-COMMERCE MARKET, 2022-2032 ($BILLION)
- FIGURE 29. JAPAN E-COMMERCE MARKET, 2022-2032 ($BILLION)
- FIGURE 30. INDIA E-COMMERCE MARKET, 2022-2032 ($BILLION)
- FIGURE 31. AUSTRALIA E-COMMERCE MARKET, 2022-2032 ($BILLION)
- FIGURE 32. SOUTH KOREA E-COMMERCE MARKET, 2022-2032 ($BILLION)
- FIGURE 33. REST OF ASIA-PACIFIC E-COMMERCE MARKET, 2022-2032 ($BILLION)
- FIGURE 34. LATIN AMERICA E-COMMERCE MARKET, 2022-2032 ($BILLION)
- FIGURE 35. MIDDLE EAST E-COMMERCE MARKET, 2022-2032 ($BILLION)
- FIGURE 36. AFRICA E-COMMERCE MARKET, 2022-2032 ($BILLION)
- FIGURE 37. TOP WINNING STRATEGIES, BY YEAR
- FIGURE 38. TOP WINNING STRATEGIES, BY DEVELOPMENT
- FIGURE 39. TOP WINNING STRATEGIES, BY COMPANY
- FIGURE 40. PRODUCT MAPPING OF TOP 10 PLAYERS
- FIGURE 41. COMPETITIVE DASHBOARD
- FIGURE 42. COMPETITIVE HEATMAP: E-COMMERCE MARKET
- FIGURE 43. TOP PLAYER POSITIONING, 2022
- FIGURE 44. AMAZON.COM INC.: NET REVENUE, 2020-2022 ($BILLION)
- FIGURE 45. AMAZON.COM INC.: REVENUE SHARE BY SEGMENT, 2021 (%)
- FIGURE 46. AMAZON.COM INC.: REVENUE SHARE BY REGION, 2021 (%)
- FIGURE 47. JD.COM, INC.: NET REVENUE, 2020-2022 ($MILLION)
- FIGURE 48. JD.COM, INC.: REVENUE SHARE BY SEGMENT, 2022 (%)
- FIGURE 49. FLIPKART: NET REVENUE, 2020-2022 ($MILLION)
- FIGURE 50. FLIPKART: REVENUE SHARE BY REGION, 2022 (%)
- FIGURE 51. ALIBABA GROUP HOLDING LIMITED: NET REVENUE, 2020-2022 ($MILLION)
- FIGURE 52. ALIBABA GROUP HOLDING LIMITED: REVENUE SHARE BY SEGMENT, 2022 (%)
- FIGURE 53. WALMART INC.: NET REVENUE, 2020-2022 ($BILLION)
- FIGURE 54. WALMART INC.: REVENUE SHARE BY REGION, 2022 (%)
- FIGURE 55. WAYFAIR LLC: NET REVENUE, 2020-2022 ($MILLION)
- FIGURE 56. WAYFAIR LLC: REVENUE SHARE BY REGION, 2022 (%)
- FIGURE 57. EBAY INC.: NET REVENUE, 2020-2022 ($MILLION)
- FIGURE 58. EBAY INC.: REVENUE SHARE BY REGION, 2022 (%)
- FIGURE 59. SHOPIFY: NET REVENUE, 2020-2022 ($MILLION)
- FIGURE 60. SHOPIFY: REVENUE SHARE BY SEGMENT, 2022 (%)
- FIGURE 61. SHOPIFY: REVENUE SHARE BY REGION, 2022 (%)
- FIGURE 62. PINDUODUO.COM: NET REVENUE, 2020-2022 ($MILLION)
According to a new report published by Allied Market Research, titled, "E-commerce Market," The e-commerce market was valued at $15.7 trillion in 2022, and is estimated to reach $63800.2 billion by 2032, growing at a CAGR of 15.3% from 2023 to 2032.
One of the main drivers of the e-commerce market is the widespread availability and affordability of internet access. As internet penetration continues to increase globally, more individuals have access to online shopping platforms, leading to a larger customer base for e-commerce businesses. Furthermore, with the growth of international shipping and logistics, consumers can access products from around the world. This expansion of cross-border trade has significantly contributed to the growth of the e-commerce market. In addition, influencer marketing, where social media influencers promote products and brands, has proven to be an effective strategy to drive e-commerce growth by leveraging the trust and influence of popular personalities. However, trust and security concerns, logistics and infrastructure challenges are some of the factors that hamper the e-commerce market growth. On the contrary, the advancement of technology, especially in terms of mobile devices and internet connectivity, has played a crucial role in the growth of the e-commerce market. Further, cross-border e-commerce that allows consumers to purchase products from overseas sellers is expected to create lucrative opportunities for the growth of the e-commerce market in the upcoming years. Improvements in logistics, payment systems, and international trade policies are facilitating the growth of cross-border e-commerce. The increasing demand for international products and the rise of platforms such as Alibaba's AliExpress and Amazon Global further contribute to this trend.
The e-commerce market is segmented into model type, offering, and region. By model type, the market is differentiated into business-to-business (B2B) and business-to-consumer (B2C). Depending on offering, it is fragmented into beauty and personal care products, consumer electronics, fashion and apparel, household products, and others. Region wise, the market is segmented into North America, Europe, Asia-Pacific, and LAMEA.
The e-commerce market analysis includes top companies operating in the market such as Amazon.com, Inc., JD.com, Inc., Flipkart.com, Alibaba Group Holding Limited, Walmart Inc., Shein, Wayfair LLC, eBay Inc., Shopify, and pinduoduo.com. These players have adopted various strategies to increase their market penetration and strengthen their position in the accounting and budgeting software industry.
Key Benefits for Stakeholders
- The study provides in-depth analysis of the e-commerce market along with current trends and future estimations to illustrate the imminent investment pockets.
- Information about key drivers, restrains, & opportunities and their impact analysis on the e-commerce market size are provided in the report.
- The Porter's five forces analysis illustrates the potency of buyers and suppliers operating in the industry.
- The quantitative analysis of the e-commerce market from 2022 to 2032 is provided to determine the market potential.
Key Market Segments
By Model Type
- Business-to-consumer (B2C)
- Business-to-business (B2B)
By Offering
- Beauty and Personal Care Products
- Consumer Electronics
- Fashion and Apparel
- Household Products
- Others
By Region
- North America
- U.S.
- Canada
- Europe
- UK
- Germany
- France
- Italy
- Spain
- Rest of Europe
- Asia-Pacific
- China
- Japan
- India
- Australia
- South Korea
- Rest of Asia-Pacific
- LAMEA
- Latin America
- Middle East
- Africa
Key Market Players:
- ALIBABA GROUP HOLDING LIMITED
- Amazon.com Inc.
- eBay Inc.
- Flipkart
- JD.com, Inc.
- pinduoduo.com
- Shein
- Shopify
- Walmart Inc.
- Wayfair LLC
TABLE OF CONTENTS
CHAPTER 1: INTRODUCTION
- 1.1. Report description
- 1.2. Key market segments
- 1.3. Key benefits to the stakeholders
- 1.4. Research Methodology
- 1.4.1. Primary research
- 1.4.2. Secondary research
- 1.4.3. Analyst tools and models
CHAPTER 2: EXECUTIVE SUMMARY
- 2.1. CXO Perspective
CHAPTER 3: MARKET OVERVIEW
- 3.1. Market definition and scope
- 3.2. Key findings
- 3.2.1. Top impacting factors
- 3.2.2. Top investment pockets
- 3.3. Porter's five forces analysis
- 3.3.1. Bargaining power of suppliers
- 3.3.2. Bargaining power of buyers
- 3.3.3. Threat of substitutes
- 3.3.4. Threat of new entrants
- 3.3.5. Intensity of rivalry
- 3.4. Market dynamics
- 3.4.1. Drivers
- 3.4.1.1. Increase in internet penetration
- 3.4.1.2. Surge in adoption of mobile technology and smartphones
- 3.4.1.3. COVID-19 pandemic impact
- 3.4.1.4. Social media and influencer marketing
- 3.4.1. Drivers
- 3.4.2. Restraints
- 3.4.2.1. Trust and security concerns
- 3.4.2.2. Logistics and infrastructure challenges
- 3.4.3. Opportunities
- 3.4.3.1. Technological advancements
- 3.4.3.2. Cross-border e-commerce
- 3.5. COVID-19 Impact Analysis on the market
CHAPTER 4: E-COMMERCE MARKET, BY MODEL TYPE
- 4.1. Overview
- 4.1.1. Market size and forecast
- 4.2. Business-to-consumer (B2C)
- 4.2.1. Key market trends, growth factors and opportunities
- 4.2.2. Market size and forecast, by region
- 4.2.3. Market share analysis by country
- 4.3. Business-to-business (B2B)
- 4.3.1. Key market trends, growth factors and opportunities
- 4.3.2. Market size and forecast, by region
- 4.3.3. Market share analysis by country
CHAPTER 5: E-COMMERCE MARKET, BY OFFERING
- 5.1. Overview
- 5.1.1. Market size and forecast
- 5.2. Beauty and Personal Care Products
- 5.2.1. Key market trends, growth factors and opportunities
- 5.2.2. Market size and forecast, by region
- 5.2.3. Market share analysis by country
- 5.3. Consumer Electronics
- 5.3.1. Key market trends, growth factors and opportunities
- 5.3.2. Market size and forecast, by region
- 5.3.3. Market share analysis by country
- 5.4. Fashion and Apparel
- 5.4.1. Key market trends, growth factors and opportunities
- 5.4.2. Market size and forecast, by region
- 5.4.3. Market share analysis by country
- 5.5. Household Products
- 5.5.1. Key market trends, growth factors and opportunities
- 5.5.2. Market size and forecast, by region
- 5.5.3. Market share analysis by country
- 5.6. Others
- 5.6.1. Key market trends, growth factors and opportunities
- 5.6.2. Market size and forecast, by region
- 5.6.3. Market share analysis by country
CHAPTER 6: E-COMMERCE MARKET, BY REGION
- 6.1. Overview
- 6.1.1. Market size and forecast By Region
- 6.2. North America
- 6.2.1. Key trends and opportunities
- 6.2.2. Market size and forecast, by Model Type
- 6.2.3. Market size and forecast, by Offering
- 6.2.4. Market size and forecast, by country
- 6.2.4.1. U.S.
- 6.2.4.1.1. Key market trends, growth factors and opportunities
- 6.2.4.1.2. Market size and forecast, by Model Type
- 6.2.4.1.3. Market size and forecast, by Offering
- 6.2.4.2. Canada
- 6.2.4.2.1. Key market trends, growth factors and opportunities
- 6.2.4.2.2. Market size and forecast, by Model Type
- 6.2.4.2.3. Market size and forecast, by Offering
- 6.3. Europe
- 6.3.1. Key trends and opportunities
- 6.3.2. Market size and forecast, by Model Type
- 6.3.3. Market size and forecast, by Offering
- 6.3.4. Market size and forecast, by country
- 6.3.4.1. UK
- 6.3.4.1.1. Key market trends, growth factors and opportunities
- 6.3.4.1.2. Market size and forecast, by Model Type
- 6.3.4.1.3. Market size and forecast, by Offering
- 6.3.4.2. Germany
- 6.3.4.2.1. Key market trends, growth factors and opportunities
- 6.3.4.2.2. Market size and forecast, by Model Type
- 6.3.4.2.3. Market size and forecast, by Offering
- 6.3.4.3. France
- 6.3.4.3.1. Key market trends, growth factors and opportunities
- 6.3.4.3.2. Market size and forecast, by Model Type
- 6.3.4.3.3. Market size and forecast, by Offering
- 6.3.4.4. Italy
- 6.3.4.4.1. Key market trends, growth factors and opportunities
- 6.3.4.4.2. Market size and forecast, by Model Type
- 6.3.4.4.3. Market size and forecast, by Offering
- 6.3.4.5. Spain
- 6.3.4.5.1. Key market trends, growth factors and opportunities
- 6.3.4.5.2. Market size and forecast, by Model Type
- 6.3.4.5.3. Market size and forecast, by Offering
- 6.3.4.6. Rest of Europe
- 6.3.4.6.1. Key market trends, growth factors and opportunities
- 6.3.4.6.2. Market size and forecast, by Model Type
- 6.3.4.6.3. Market size and forecast, by Offering
- 6.4. Asia-Pacific
- 6.4.1. Key trends and opportunities
- 6.4.2. Market size and forecast, by Model Type
- 6.4.3. Market size and forecast, by Offering
- 6.4.4. Market size and forecast, by country
- 6.4.4.1. China
- 6.4.4.1.1. Key market trends, growth factors and opportunities
- 6.4.4.1.2. Market size and forecast, by Model Type
- 6.4.4.1.3. Market size and forecast, by Offering
- 6.4.4.2. Japan
- 6.4.4.2.1. Key market trends, growth factors and opportunities
- 6.4.4.2.2. Market size and forecast, by Model Type
- 6.4.4.2.3. Market size and forecast, by Offering
- 6.4.4.3. India
- 6.4.4.3.1. Key market trends, growth factors and opportunities
- 6.4.4.3.2. Market size and forecast, by Model Type
- 6.4.4.3.3. Market size and forecast, by Offering
- 6.4.4.4. Australia
- 6.4.4.4.1. Key market trends, growth factors and opportunities
- 6.4.4.4.2. Market size and forecast, by Model Type
- 6.4.4.4.3. Market size and forecast, by Offering
- 6.4.4.5. South Korea
- 6.4.4.5.1. Key market trends, growth factors and opportunities
- 6.4.4.5.2. Market size and forecast, by Model Type
- 6.4.4.5.3. Market size and forecast, by Offering
- 6.4.4.6. Rest of Asia-Pacific
- 6.4.4.6.1. Key market trends, growth factors and opportunities
- 6.4.4.6.2. Market size and forecast, by Model Type
- 6.4.4.6.3. Market size and forecast, by Offering
- 6.5. LAMEA
- 6.5.1. Key trends and opportunities
- 6.5.2. Market size and forecast, by Model Type
- 6.5.3. Market size and forecast, by Offering
- 6.5.4. Market size and forecast, by country
- 6.5.4.1. Latin America
- 6.5.4.1.1. Key market trends, growth factors and opportunities
- 6.5.4.1.2. Market size and forecast, by Model Type
- 6.5.4.1.3. Market size and forecast, by Offering
- 6.5.4.2. Middle East
- 6.5.4.2.1. Key market trends, growth factors and opportunities
- 6.5.4.2.2. Market size and forecast, by Model Type
- 6.5.4.2.3. Market size and forecast, by Offering
- 6.5.4.3. Africa
- 6.5.4.3.1. Key market trends, growth factors and opportunities
- 6.5.4.3.2. Market size and forecast, by Model Type
- 6.5.4.3.3. Market size and forecast, by Offering
CHAPTER 7: COMPETITIVE LANDSCAPE
- 7.1. Introduction
- 7.2. Top winning strategies
- 7.3. Product Mapping of Top 10 Player
- 7.4. Competitive Dashboard
- 7.5. Competitive Heatmap
- 7.6. Top player positioning, 2022
CHAPTER 8: COMPANY PROFILES
- 8.1. Amazon.com Inc.
- 8.1.1. Company overview
- 8.1.2. Key Executives
- 8.1.3. Company snapshot
- 8.1.4. Operating business segments
- 8.1.5. Product portfolio
- 8.1.6. Business performance
- 8.1.7. Key strategic moves and developments
- 8.2. JD.com, Inc.
- 8.2.1. Company overview
- 8.2.2. Key Executives
- 8.2.3. Company snapshot
- 8.2.4. Operating business segments
- 8.2.5. Product portfolio
- 8.2.6. Business performance
- 8.2.7. Key strategic moves and developments
- 8.3. Flipkart
- 8.3.1. Company overview
- 8.3.2. Key Executives
- 8.3.3. Company snapshot
- 8.3.4. Operating business segments
- 8.3.5. Product portfolio
- 8.3.6. Business performance
- 8.3.7. Key strategic moves and developments
- 8.4. ALIBABA GROUP HOLDING LIMITED
- 8.4.1. Company overview
- 8.4.2. Key Executives
- 8.4.3. Company snapshot
- 8.4.4. Operating business segments
- 8.4.5. Product portfolio
- 8.4.6. Business performance
- 8.5. Walmart Inc.
- 8.5.1. Company overview
- 8.5.2. Key Executives
- 8.5.3. Company snapshot
- 8.5.4. Operating business segments
- 8.5.5. Product portfolio
- 8.5.6. Business performance
- 8.5.7. Key strategic moves and developments
- 8.6. Shein
- 8.6.1. Company overview
- 8.6.2. Key Executives
- 8.6.3. Company snapshot
- 8.6.4. Operating business segments
- 8.6.5. Product portfolio
- 8.6.6. Key strategic moves and developments
- 8.7. Wayfair LLC
- 8.7.1. Company overview
- 8.7.2. Key Executives
- 8.7.3. Company snapshot
- 8.7.4. Operating business segments
- 8.7.5. Product portfolio
- 8.7.6. Business performance
- 8.7.7. Key strategic moves and developments
- 8.8. eBay Inc.
- 8.8.1. Company overview
- 8.8.2. Key Executives
- 8.8.3. Company snapshot
- 8.8.4. Operating business segments
- 8.8.5. Product portfolio
- 8.8.6. Business performance
- 8.8.7. Key strategic moves and developments
- 8.9. Shopify
- 8.9.1. Company overview
- 8.9.2. Key Executives
- 8.9.3. Company snapshot
- 8.9.4. Operating business segments
- 8.9.5. Product portfolio
- 8.9.6. Business performance
- 8.9.7. Key strategic moves and developments
- 8.10. pinduoduo.com
- 8.10.1. Company overview
- 8.10.2. Key Executives
- 8.10.3. Company snapshot
- 8.10.4. Operating business segments
- 8.10.5. Product portfolio
- 8.10.6. Business performance
- 8.10.7. Key strategic moves and developments