
|
市場調査レポート
商品コード
1344471
農業向け生物学的検査市場:製品タイプ別、エンドユーザー別:世界の機会分析と産業予測、2023-2032年Agriculture Biologicals Testing Market By Product Type, By End-User : Global Opportunity Analysis and Industry Forecast, 2023-2032 |
||||||
|
|||||||

| 農業向け生物学的検査市場:製品タイプ別、エンドユーザー別:世界の機会分析と産業予測、2023-2032年 |
|
出版日: 2023年05月30日
発行: Allied Market Research
ページ情報: 英文 350 Pages
納期: 2~3営業日
|

- 全表示
- 概要
- 図表
- 目次
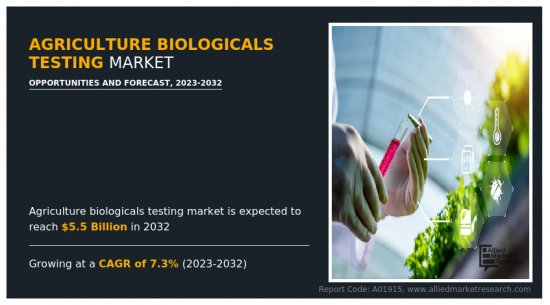
農業向け生物学的検査市場は2022年に27億米ドルと評価され、2023年から2032年にかけてCAGR 7.3%で成長し、2032年には55億米ドルに達すると推定されます。
農業向け生物学的検査市場の成長は、高品質な食品に対する需要の急増によって増加しています。消費者は、有機食品や自然食品を食べることによる健康上のメリットを認識するようになり、そのような製品に割高な料金を支払うことを厭わなくなっています。そのため、農家は毒素や汚染物質を含まない良質な製品を生産しようとする傾向が強まっています。
農業向け生物学的検査は、現代農業の重要な一部です。評価の目的は、農家が化学物質を含まない製品を栽培できるようにすることです。こうした検査を行うことで、農家は農作物に被害を与える本格的な病気に発展する前に、潜在的な問題を特定することができます。農業向け生物学的検査は、食品の安全性と品質の管理に役立ちます。これは、食品安全規制が厳しい世界の食品業界では特に重要です。
検査は、植物の病気や害虫の蔓延防止に役立ちます。検査によって病気や害虫が蔓延する前に捕らえることができるため、農家は作物に深刻な被害を与える前に対策を講じることができます。一旦病害虫が発生すると、それを取り除くのは困難で費用もかかるため、これは重要なことです。さらに、検査は農家が特定の病気や害虫に対する最善の治療法を決定するのに役立ち、その過程で農薬やその他の化学薬品の使用を減らすことができます。さらに、作物の収穫量を増やし、作物の損失を減らすのにも役立ちます。深刻な問題になる前に潜在的な問題を特定することで、農家は作物を守り、収量を増やすための対策を講じることができます。これは、食糧生産量を増やし、食糧不安地域の食糧不安を軽減するのに役立ちます。作物を病害虫から守ることで、農家は収入を増やし、健康を増進することができます。
高品質の農産物に対する需要の高まりが、農業向け生物学的検査市場の需要を高めています。農家は消費者の需要に応えるため、農作物を改良する方法を模索しており、それが化学検査の増加につながっています。農家は、作物の品質を評価することで、市場のニーズを満たす高品質の製品を生産していることを確認できます。さらに、農業生物学的農法は、優良作物に最適な作物や資材を特定するのに役立ちます。これには、土壌の品質検査、病害虫の有無の判定、肥料やその他の投入資材の有効性の検査などが含まれます。これらの情報は、十分な情報に基づいた製品管理の決定に利用できます。
病害虫管理の必要性から、生物学的検査市場の需要は急増しています。農業向け生物学的検査は、作物、動物、人間に害を及ぼす害虫や病気の検出、同定、駆除において重要な役割を果たしています。良質で安全な食品への需要が高まる中、バイオアッセイ産業は食品や農産物の安全性を確保するために不可欠な存在となっています。加えて、国際貿易や国際旅行の増加により、新しい外来病害の出現が増加し、病害の診断と制御が困難になっています。このような状況において、生物学的検査は、特に初期段階における疾病の検出と制御において重要なツールとなっています。さらに、製薬業界では新薬やワクチンの開発にバイオアッセイの利用が増加しています。
持続可能な作物生産へのニーズの高まりは、農業向け生物学的検査産業への需要を高めています。人口の増加に伴い、より少ない資源でより多くの作物を生産する必要がある一方、化学薬品や肥料の使用は環境悪化につながります。その結果、健康で良好な作物を確保するために化学物質を使用する、持続可能な作物生産へとシフトしています。検査は、作物に影響を及ぼす可能性のある病気や害虫を特定するのに役立ち、それによって作物生産を向上させる。さらに、有機食品に対する需要の高まりから、食品中の農薬やその他の有害な化学物質を検出するための農業向け生物学的検査の利用が進んでいます。この動向は、バイオ分析ソリューションを提供する企業に大きなビジネスチャンスをもたらしています。その結果、農業向け生物学的検査に対する市場需要は増加しており、この動向は予測期間中に急増すると予想されます。
さらに、農業向け生物学的検査は環境保護にも役立ちます。農業における農薬やその他の化学薬品の使用を削減することで、これらの化学薬品が環境に及ぼす悪影響を減らすことができます。また、病害虫の蔓延を防ぐことで、森林や生息地にダメージを与える開墾やその他の農法の必要性を減らすことができます。農業生物学的試験は持続可能な農業に貢献します。持続可能な農業とは、農業の長期的な持続可能性を確保するために、経済的、社会的、環境的側面のバランスを重視する方法です。実験は、農薬やその他の化学物質の使用を減らし、これらの化学物質が環境に及ぼす悪影響を軽減し、環境に優しい農法の使用を促進することで、持続可能な農業に貢献することができます。
目次
第1章 イントロダクション
第2章 エグゼクティブサマリー
第3章 市場概要
- 市場の定義と範囲
- 主な調査結果
- 影響要因
- 主な投資機会
- ポーターのファイブフォース分析
- 供給企業の交渉力
- 買い手の交渉力
- 代替品の脅威
- 新規参入業者の脅威
- 競合の激しさ
- 市場力学
- 促進要因
- 分子診断法の採用の増加
- 土壌検査の重要性の高まり
- 生物農薬と生物肥料の使用の増加
- 有機食品産業の拡大
- 抑制要因
- 限られたインフラ
- 文化や言語の壁
- 機会
- 生物学的害虫駆除
- 植物組織検査
- 栄養管理計画
- 促進要因
- COVID-19市場への影響分析
第4章 農業向け生物学的検査市場:製品タイプ別
- 概要
- バイオ農薬
- バイオ肥料
- バイオ刺激剤
第5章 農業向け生物学的検査市場:エンドユーザー別
- 概要
- バイオ製品メーカー
- 政府機関
- 植物育種業者
- 委託研究機関
第6章 農業向け生物学的検査市場:地域別
- 概要
- 北米
- 米国
- カナダ
- メキシコ
- 欧州
- ドイツ
- 英国
- フランス
- ロシア
- スペイン
- イタリア
- その他欧州
- アジア太平洋
- 中国
- 日本
- 韓国
- インド
- オーストラリア
- その他のアジア太平洋地域
- ラテンアメリカ
- ラテンアメリカ
- 中東
- アフリカ
第7章 競合情勢
- イントロダクション
- 主要成功戦略
- 主要10社の製品マッピング
- 競合ダッシュボード
- 競合ヒートマップ
- 主要企業のポジショニング、2022年
第8章 企業プロファイル
- SGS SA
- Eurofins Scientific
- Staphyt SA
- Laus GmbH
- Bionema Limited
- Syntech Research Group
- Anadiag Group
- RJ Hill Laboratories Limited
- Eurofins APAL Pty Ltd
- ALS Limited
LIST OF TABLES
- TABLE 01. GLOBAL AGRICULTURE BIOLOGICALS TESTING MARKET, BY PRODUCT TYPE, 2022-2032 ($MILLION)
- TABLE 02. AGRICULTURE BIOLOGICALS TESTING MARKET FOR BIO PESTICIDES, BY REGION, 2022-2032 ($MILLION)
- TABLE 03. AGRICULTURE BIOLOGICALS TESTING MARKET FOR BIO FERTILIZERS, BY REGION, 2022-2032 ($MILLION)
- TABLE 04. AGRICULTURE BIOLOGICALS TESTING MARKET FOR BIO STIMULANTS, BY REGION, 2022-2032 ($MILLION)
- TABLE 05. GLOBAL AGRICULTURE BIOLOGICALS TESTING MARKET, BY END-USER, 2022-2032 ($MILLION)
- TABLE 06. AGRICULTURE BIOLOGICALS TESTING MARKET FOR BIOLOGICAL PRODUCT MANUFACTURERS, BY REGION, 2022-2032 ($MILLION)
- TABLE 07. AGRICULTURE BIOLOGICALS TESTING MARKET FOR GOVERNMENT AGENCIES, BY REGION, 2022-2032 ($MILLION)
- TABLE 08. AGRICULTURE BIOLOGICALS TESTING MARKET FOR PLANT BREEDERS, BY REGION, 2022-2032 ($MILLION)
- TABLE 09. AGRICULTURE BIOLOGICALS TESTING MARKET FOR OUTSOURCED CONTRACT RESEARCH ORGANIZATION, BY REGION, 2022-2032 ($MILLION)
- TABLE 10. AGRICULTURE BIOLOGICALS TESTING MARKET, BY REGION, 2022-2032 ($MILLION)
- TABLE 11. NORTH AMERICA AGRICULTURE BIOLOGICALS TESTING MARKET, BY PRODUCT TYPE, 2022-2032 ($MILLION)
- TABLE 12. NORTH AMERICA AGRICULTURE BIOLOGICALS TESTING MARKET, BY END-USER, 2022-2032 ($MILLION)
- TABLE 13. NORTH AMERICA AGRICULTURE BIOLOGICALS TESTING MARKET, BY COUNTRY, 2022-2032 ($MILLION)
- TABLE 14. U.S. AGRICULTURE BIOLOGICALS TESTING MARKET, BY PRODUCT TYPE, 2022-2032 ($MILLION)
- TABLE 15. U.S. AGRICULTURE BIOLOGICALS TESTING MARKET, BY END-USER, 2022-2032 ($MILLION)
- TABLE 16. CANADA AGRICULTURE BIOLOGICALS TESTING MARKET, BY PRODUCT TYPE, 2022-2032 ($MILLION)
- TABLE 17. CANADA AGRICULTURE BIOLOGICALS TESTING MARKET, BY END-USER, 2022-2032 ($MILLION)
- TABLE 18. MEXICO AGRICULTURE BIOLOGICALS TESTING MARKET, BY PRODUCT TYPE, 2022-2032 ($MILLION)
- TABLE 19. MEXICO AGRICULTURE BIOLOGICALS TESTING MARKET, BY END-USER, 2022-2032 ($MILLION)
- TABLE 20. EUROPE AGRICULTURE BIOLOGICALS TESTING MARKET, BY PRODUCT TYPE, 2022-2032 ($MILLION)
- TABLE 21. EUROPE AGRICULTURE BIOLOGICALS TESTING MARKET, BY END-USER, 2022-2032 ($MILLION)
- TABLE 22. EUROPE AGRICULTURE BIOLOGICALS TESTING MARKET, BY COUNTRY, 2022-2032 ($MILLION)
- TABLE 23. GERMANY AGRICULTURE BIOLOGICALS TESTING MARKET, BY PRODUCT TYPE, 2022-2032 ($MILLION)
- TABLE 24. GERMANY AGRICULTURE BIOLOGICALS TESTING MARKET, BY END-USER, 2022-2032 ($MILLION)
- TABLE 25. UK AGRICULTURE BIOLOGICALS TESTING MARKET, BY PRODUCT TYPE, 2022-2032 ($MILLION)
- TABLE 26. UK AGRICULTURE BIOLOGICALS TESTING MARKET, BY END-USER, 2022-2032 ($MILLION)
- TABLE 27. FRANCE AGRICULTURE BIOLOGICALS TESTING MARKET, BY PRODUCT TYPE, 2022-2032 ($MILLION)
- TABLE 28. FRANCE AGRICULTURE BIOLOGICALS TESTING MARKET, BY END-USER, 2022-2032 ($MILLION)
- TABLE 29. RUSSIA AGRICULTURE BIOLOGICALS TESTING MARKET, BY PRODUCT TYPE, 2022-2032 ($MILLION)
- TABLE 30. RUSSIA AGRICULTURE BIOLOGICALS TESTING MARKET, BY END-USER, 2022-2032 ($MILLION)
- TABLE 31. SPAIN AGRICULTURE BIOLOGICALS TESTING MARKET, BY PRODUCT TYPE, 2022-2032 ($MILLION)
- TABLE 32. SPAIN AGRICULTURE BIOLOGICALS TESTING MARKET, BY END-USER, 2022-2032 ($MILLION)
- TABLE 33. ITALY AGRICULTURE BIOLOGICALS TESTING MARKET, BY PRODUCT TYPE, 2022-2032 ($MILLION)
- TABLE 34. ITALY AGRICULTURE BIOLOGICALS TESTING MARKET, BY END-USER, 2022-2032 ($MILLION)
- TABLE 35. REST OF EUROPE AGRICULTURE BIOLOGICALS TESTING MARKET, BY PRODUCT TYPE, 2022-2032 ($MILLION)
- TABLE 36. REST OF EUROPE AGRICULTURE BIOLOGICALS TESTING MARKET, BY END-USER, 2022-2032 ($MILLION)
- TABLE 37. ASIA-PACIFIC AGRICULTURE BIOLOGICALS TESTING MARKET, BY PRODUCT TYPE, 2022-2032 ($MILLION)
- TABLE 38. ASIA-PACIFIC AGRICULTURE BIOLOGICALS TESTING MARKET, BY END-USER, 2022-2032 ($MILLION)
- TABLE 39. ASIA-PACIFIC AGRICULTURE BIOLOGICALS TESTING MARKET, BY COUNTRY, 2022-2032 ($MILLION)
- TABLE 40. CHINA AGRICULTURE BIOLOGICALS TESTING MARKET, BY PRODUCT TYPE, 2022-2032 ($MILLION)
- TABLE 41. CHINA AGRICULTURE BIOLOGICALS TESTING MARKET, BY END-USER, 2022-2032 ($MILLION)
- TABLE 42. JAPAN AGRICULTURE BIOLOGICALS TESTING MARKET, BY PRODUCT TYPE, 2022-2032 ($MILLION)
- TABLE 43. JAPAN AGRICULTURE BIOLOGICALS TESTING MARKET, BY END-USER, 2022-2032 ($MILLION)
- TABLE 44. SOUTH KOREA AGRICULTURE BIOLOGICALS TESTING MARKET, BY PRODUCT TYPE, 2022-2032 ($MILLION)
- TABLE 45. SOUTH KOREA AGRICULTURE BIOLOGICALS TESTING MARKET, BY END-USER, 2022-2032 ($MILLION)
- TABLE 46. INDIA AGRICULTURE BIOLOGICALS TESTING MARKET, BY PRODUCT TYPE, 2022-2032 ($MILLION)
- TABLE 47. INDIA AGRICULTURE BIOLOGICALS TESTING MARKET, BY END-USER, 2022-2032 ($MILLION)
- TABLE 48. AUSTRALIA AGRICULTURE BIOLOGICALS TESTING MARKET, BY PRODUCT TYPE, 2022-2032 ($MILLION)
- TABLE 49. AUSTRALIA AGRICULTURE BIOLOGICALS TESTING MARKET, BY END-USER, 2022-2032 ($MILLION)
- TABLE 50. REST OF ASIA PACAFIC AGRICULTURE BIOLOGICALS TESTING MARKET, BY PRODUCT TYPE, 2022-2032 ($MILLION)
- TABLE 51. REST OF ASIA PACAFIC AGRICULTURE BIOLOGICALS TESTING MARKET, BY END-USER, 2022-2032 ($MILLION)
- TABLE 52. LAMEA AGRICULTURE BIOLOGICALS TESTING MARKET, BY PRODUCT TYPE, 2022-2032 ($MILLION)
- TABLE 53. LAMEA AGRICULTURE BIOLOGICALS TESTING MARKET, BY END-USER, 2022-2032 ($MILLION)
- TABLE 54. LAMEA AGRICULTURE BIOLOGICALS TESTING MARKET, BY COUNTRY, 2022-2032 ($MILLION)
- TABLE 55. LATIN AMERICA AGRICULTURE BIOLOGICALS TESTING MARKET, BY PRODUCT TYPE, 2022-2032 ($MILLION)
- TABLE 56. LATIN AMERICA AGRICULTURE BIOLOGICALS TESTING MARKET, BY END-USER, 2022-2032 ($MILLION)
- TABLE 57. MIDDLE EAST AGRICULTURE BIOLOGICALS TESTING MARKET, BY PRODUCT TYPE, 2022-2032 ($MILLION)
- TABLE 58. MIDDLE EAST AGRICULTURE BIOLOGICALS TESTING MARKET, BY END-USER, 2022-2032 ($MILLION)
- TABLE 59. AFRICA AGRICULTURE BIOLOGICALS TESTING MARKET, BY PRODUCT TYPE, 2022-2032 ($MILLION)
- TABLE 60. AFRICA AGRICULTURE BIOLOGICALS TESTING MARKET, BY END-USER, 2022-2032 ($MILLION)
- TABLE 61. SGS SA: KEY EXECUTIVES
- TABLE 62. SGS SA: COMPANY SNAPSHOT
- TABLE 63. SGS SA: SERVICE SEGMENTS
- TABLE 64. SGS SA: PRODUCT PORTFOLIO
- TABLE 65. SGS SA: KEY STRATERGIES
- TABLE 66. EUROFINS SCIENTIFIC: KEY EXECUTIVES
- TABLE 67. EUROFINS SCIENTIFIC: COMPANY SNAPSHOT
- TABLE 68. EUROFINS SCIENTIFIC: SERVICE SEGMENTS
- TABLE 69. EUROFINS SCIENTIFIC: PRODUCT PORTFOLIO
- TABLE 70. STAPHYT SA: KEY EXECUTIVES
- TABLE 71. STAPHYT SA: COMPANY SNAPSHOT
- TABLE 72. STAPHYT SA: SERVICE SEGMENTS
- TABLE 73. STAPHYT SA: PRODUCT PORTFOLIO
- TABLE 74. LAUS GMBH: KEY EXECUTIVES
- TABLE 75. LAUS GMBH: COMPANY SNAPSHOT
- TABLE 76. LAUS GMBH: SERVICE SEGMENTS
- TABLE 77. LAUS GMBH: PRODUCT PORTFOLIO
- TABLE 78. BIONEMA LIMITED: KEY EXECUTIVES
- TABLE 79. BIONEMA LIMITED: COMPANY SNAPSHOT
- TABLE 80. BIONEMA LIMITED: SERVICE SEGMENTS
- TABLE 81. BIONEMA LIMITED: PRODUCT PORTFOLIO
- TABLE 82. SYNTECH RESEARCH GROUP: KEY EXECUTIVES
- TABLE 83. SYNTECH RESEARCH GROUP: COMPANY SNAPSHOT
- TABLE 84. SYNTECH RESEARCH GROUP: SERVICE SEGMENTS
- TABLE 85. SYNTECH RESEARCH GROUP: PRODUCT PORTFOLIO
- TABLE 86. ANADIAG GROUP: KEY EXECUTIVES
- TABLE 87. ANADIAG GROUP: COMPANY SNAPSHOT
- TABLE 88. ANADIAG GROUP: SERVICE SEGMENTS
- TABLE 89. ANADIAG GROUP: PRODUCT PORTFOLIO
- TABLE 90. RJ HILL LABORATORIES LIMITED: KEY EXECUTIVES
- TABLE 91. RJ HILL LABORATORIES LIMITED: COMPANY SNAPSHOT
- TABLE 92. RJ HILL LABORATORIES LIMITED: SERVICE SEGMENTS
- TABLE 93. RJ HILL LABORATORIES LIMITED: PRODUCT PORTFOLIO
- TABLE 94. EUROFINS APAL PTY LTD: KEY EXECUTIVES
- TABLE 95. EUROFINS APAL PTY LTD: COMPANY SNAPSHOT
- TABLE 96. EUROFINS APAL PTY LTD: SERVICE SEGMENTS
- TABLE 97. EUROFINS APAL PTY LTD: PRODUCT PORTFOLIO
- TABLE 98. ALS LIMITED: KEY EXECUTIVES
- TABLE 99. ALS LIMITED: COMPANY SNAPSHOT
- TABLE 100. ALS LIMITED: SERVICE SEGMENTS
- TABLE 101. ALS LIMITED: PRODUCT PORTFOLIO
- TABLE 102. ALS LIMITED: KEY STRATERGIES
LIST OF FIGURES
- FIGURE 01. AGRICULTURE BIOLOGICALS TESTING MARKET, 2022-2032
- FIGURE 02. SEGMENTATION OF AGRICULTURE BIOLOGICALS TESTING MARKET, 2022-2032
- FIGURE 03. TOP INVESTMENT POCKETS IN AGRICULTURE BIOLOGICALS TESTING MARKET (2023-2032)
- FIGURE 04. MODERATE BARGAINING POWER OF SUPPLIERS
- FIGURE 05. MODERATE BARGAINING POWER OF BUYERS
- FIGURE 06. MODERATE THREAT OF SUBSTITUTES
- FIGURE 07. MODERATE THREAT OF NEW ENTRANTS
- FIGURE 08. MODERATE INTENSITY OF RIVALRY
- FIGURE 09. DRIVERS, RESTRAINTS AND OPPORTUNITIES: GLOBALAGRICULTURE BIOLOGICALS TESTING MARKET
- FIGURE 10. AGRICULTURE BIOLOGICALS TESTING MARKET, BY PRODUCT TYPE, 2022(%)
- FIGURE 11. COMPARATIVE SHARE ANALYSIS OF AGRICULTURE BIOLOGICALS TESTING MARKET FOR BIO PESTICIDES, BY COUNTRY 2022 AND 2032(%)
- FIGURE 12. COMPARATIVE SHARE ANALYSIS OF AGRICULTURE BIOLOGICALS TESTING MARKET FOR BIO FERTILIZERS, BY COUNTRY 2022 AND 2032(%)
- FIGURE 13. COMPARATIVE SHARE ANALYSIS OF AGRICULTURE BIOLOGICALS TESTING MARKET FOR BIO STIMULANTS, BY COUNTRY 2022 AND 2032(%)
- FIGURE 14. AGRICULTURE BIOLOGICALS TESTING MARKET, BY END-USER, 2022(%)
- FIGURE 15. COMPARATIVE SHARE ANALYSIS OF AGRICULTURE BIOLOGICALS TESTING MARKET FOR BIOLOGICAL PRODUCT MANUFACTURERS, BY COUNTRY 2022 AND 2032(%)
- FIGURE 16. COMPARATIVE SHARE ANALYSIS OF AGRICULTURE BIOLOGICALS TESTING MARKET FOR GOVERNMENT AGENCIES, BY COUNTRY 2022 AND 2032(%)
- FIGURE 17. COMPARATIVE SHARE ANALYSIS OF AGRICULTURE BIOLOGICALS TESTING MARKET FOR PLANT BREEDERS, BY COUNTRY 2022 AND 2032(%)
- FIGURE 18. COMPARATIVE SHARE ANALYSIS OF AGRICULTURE BIOLOGICALS TESTING MARKET FOR OUTSOURCED CONTRACT RESEARCH ORGANIZATION, BY COUNTRY 2022 AND 2032(%)
- FIGURE 19. AGRICULTURE BIOLOGICALS TESTING MARKET BY REGION, 2022
- FIGURE 20. U.S. AGRICULTURE BIOLOGICALS TESTING MARKET, 2022-2032 ($MILLION)
- FIGURE 21. CANADA AGRICULTURE BIOLOGICALS TESTING MARKET, 2022-2032 ($MILLION)
- FIGURE 22. MEXICO AGRICULTURE BIOLOGICALS TESTING MARKET, 2022-2032 ($MILLION)
- FIGURE 23. GERMANY AGRICULTURE BIOLOGICALS TESTING MARKET, 2022-2032 ($MILLION)
- FIGURE 24. UK AGRICULTURE BIOLOGICALS TESTING MARKET, 2022-2032 ($MILLION)
- FIGURE 25. FRANCE AGRICULTURE BIOLOGICALS TESTING MARKET, 2022-2032 ($MILLION)
- FIGURE 26. RUSSIA AGRICULTURE BIOLOGICALS TESTING MARKET, 2022-2032 ($MILLION)
- FIGURE 27. SPAIN AGRICULTURE BIOLOGICALS TESTING MARKET, 2022-2032 ($MILLION)
- FIGURE 28. ITALY AGRICULTURE BIOLOGICALS TESTING MARKET, 2022-2032 ($MILLION)
- FIGURE 29. REST OF EUROPE AGRICULTURE BIOLOGICALS TESTING MARKET, 2022-2032 ($MILLION)
- FIGURE 30. CHINA AGRICULTURE BIOLOGICALS TESTING MARKET, 2022-2032 ($MILLION)
- FIGURE 31. JAPAN AGRICULTURE BIOLOGICALS TESTING MARKET, 2022-2032 ($MILLION)
- FIGURE 32. SOUTH KOREA AGRICULTURE BIOLOGICALS TESTING MARKET, 2022-2032 ($MILLION)
- FIGURE 33. INDIA AGRICULTURE BIOLOGICALS TESTING MARKET, 2022-2032 ($MILLION)
- FIGURE 34. AUSTRALIA AGRICULTURE BIOLOGICALS TESTING MARKET, 2022-2032 ($MILLION)
- FIGURE 35. REST OF ASIA PACAFIC AGRICULTURE BIOLOGICALS TESTING MARKET, 2022-2032 ($MILLION)
- FIGURE 36. LATIN AMERICA AGRICULTURE BIOLOGICALS TESTING MARKET, 2022-2032 ($MILLION)
- FIGURE 37. MIDDLE EAST AGRICULTURE BIOLOGICALS TESTING MARKET, 2022-2032 ($MILLION)
- FIGURE 38. AFRICA AGRICULTURE BIOLOGICALS TESTING MARKET, 2022-2032 ($MILLION)
- FIGURE 39. TOP WINNING STRATEGIES, BY YEAR
- FIGURE 40. TOP WINNING STRATEGIES, BY DEVELOPMENT
- FIGURE 41. TOP WINNING STRATEGIES, BY COMPANY
- FIGURE 42. PRODUCT MAPPING OF TOP 10 PLAYERS
- FIGURE 43. COMPETITIVE DASHBOARD
- FIGURE 44. COMPETITIVE HEATMAP: AGRICULTURE BIOLOGICALS TESTING MARKET
- FIGURE 45. TOP PLAYER POSITIONING, 2022
- FIGURE 46. SGS SA: NET REVENUE, 2019-2021 ($MILLION)
- FIGURE 47. SGS SA: REVENUE SHARE BY SEGMENT, 2021 (%)
- FIGURE 48. SGS SA: REVENUE SHARE BY REGION, 2021 (%)
- FIGURE 49. EUROFINS SCIENTIFIC: NET REVENUE, 2019-2021 ($MILLION)
- FIGURE 50. EUROFINS SCIENTIFIC: REVENUE SHARE BY SEGMENT, 2021 (%)
- FIGURE 51. ALS LIMITED: NET REVENUE, 2020-2022 ($MILLION)
- FIGURE 52. ALS LIMITED: REVENUE SHARE BY SEGMENT, 2022 (%)
- FIGURE 53. ALS LIMITED: REVENUE SHARE BY REGION, 2022 (%)
According to a new report published by Allied Market Research, titled, "Agriculture Biologicals Testing Market," The agriculture biologicals testing market was valued at $2.7 billion in 2022, and is estimated to reach $5.5 billion by 2032, growing at a CAGR of 7.3% from 2023 to 2032.
The growth in the agricultural biological testing market is increasing due to a surge in demand for high-quality food products. Consumers are becoming more aware of the health benefits of eating organic and natural foods and are willing to pay a premium for such products. Therefore, farmers are increasingly trying to produce good products that are free of toxins and pollutants.
Agricultural biological testing is an important part of modern agriculture. The purpose of the assessment is to enable farmers to grow chemical free products. By doing these tests, farmers can identify potential problems before they develop into full-blown diseases that can damage crops. Agricultural biological testing helps control food safety and quality. This is especially important in the global food industry, where food safety regulations are strict.
Testing helps to prevent the spread of plant diseases and pests. Inspections can catch diseases and pests before they spread, enabling farmers to take action before they cause serious damage to crops. This is important because once an infestation or pest is established, it can be difficult and expensive to remove. Additionally, testing can help farmers decide on the best treatments for certain diseases or pests and reduce the use of pesticides and other chemicals in the process. Moreover, it helps increase crop yield and reduce crop loss. By identifying potential problems before they become serious problems, farmers can take steps to protect their crops and increase yields. This helps increase food production and reduce food insecurity in food-insecure areas. By protecting crops from pests and diseases, farmers can increase their income and improve their health.
Increasing demand for high-quality agricultural products has increased the demand for the agricultural biological testing market. Farmers are looking for ways to improve their crops to meet consumer demand, leading to an increase in chemical testing. By assessing the quality of their crops, farmers can ensure that they are producing quality products that meet the needs of the market. Additionally, agriculture biological farming can help identify the best crops and materials for good crops. This includes testing soil quality, determining the presence of pests and diseases, and testing the effectiveness of fertilizers and other inputs. This information can be used to make informed product management decisions.
The need for disease and pest management has led to a surge in the market demand for the biological testing market. Agriculture biological testing plays an important role in the detection, identification, and control of pests and diseases that can harm crops, animals, and humans. With the increasing demand for good and safe food, the bioassay industry has become an essential part of ensuring the safety of food and agricultural products. In addition, increasing international trade and travel increase the emergence of new and exotic diseases, making disease diagnosis and control difficult. In this context, biological testing has become an important tool in the detection and control of diseases, especially in the early stages. In addition, the use of bioassays in the pharmaceutical industry is increasing for the development of new drugs and vaccines.
The growing need for sustainable crop production has increased the demand for the agriculture biological testing industry. As the population grows, more crops must be produced with fewer resources, while the use of chemicals and fertilizers leads to environmental degradation. As a result, there has been a shift toward sustainable crop production, which includes the use of chemicals to ensure healthy and good crops. Testing helps identify diseases and pests that can affect crops, thereby improving crop production. Additionally, increasing demand for organic food has led to the use of agriculture biological testing to detect pesticides and other harmful chemicals in food. This trend creates a significant business opportunity for companies offering bioanalysis solutions. As a result, market demand for agriculture biological testing has increased and this trend is expected to surge during the forecast period.
Moreover, agricultural biological testing helps protect the environment. By reducing the use of pesticides and other chemicals in agriculture, experiments can help reduce the negative effects of these chemicals on the environment. Also, by preventing the spread of pests and diseases, experiments can reduce the need for land clearing and other agricultural practices that cause damage to forests and habitats. Agricultural biological testing contributes to sustainable agriculture. Sustainable agriculture is a method that focuses on balancing the economic, social, and environmental aspects to ensure the long-term sustainability of agriculture. Experiments can contribute to sustainable agriculture by reducing the use of pesticides and other chemicals, reducing the negative effects of these chemicals on the environment, and promoting the use of green farming practices.
The agriculture biological testing market is segmented into product type, end-user, and region. By product type, the market is bifurcated into bio pesticides, bio fertilizers, bio stimulants. As per end-user, the market is divided into biological product manufacturers, government agencies, plant breeders, and outsourced contract research organization. Region-wise, the market is analyzed across North America (the U.S., Canada, and Mexico), Europe (Germany, UK, France, Russia, Spain, Italy, and the rest of Europe), Asia-Pacific (China, Japan, South Korea, India, Australia, and rest of Asia-Pacific), and LAMEA (Latin America, Middle East, Africa).
The players in the agriculture biological testing market have adopted acquisition, business expansion, partnership, collaboration, and product launch as their key development strategies to increase profitability and improve their position in the market. Some of the key players profiled in the agriculture biological testing market analysis include SGS SA, Eurofins Scientific, Bionema Limited, Anadiag Group, Syntech Research Group, Staphyt SA, Laus GmbH, ALS Limited, RJ Hill Laboratories Limited, Eurofins APAL Pty Ltd.
Key Benefits For Stakeholders
- This report provides a quantitative analysis of the market segments, current trends, estimations, and dynamics of the agriculture biologicals testing market analysis from 2022 to 2032 to identify the prevailing agriculture biologicals testing market opportunities.
- The market research is offered along with information related to key drivers, restraints, and opportunities.
- Porter's five forces analysis highlights the potency of buyers and suppliers to enable stakeholders make profit-oriented business decisions and strengthen their supplier-buyer network.
- In-depth analysis of the agriculture biologicals testing market segmentation assists to determine the prevailing market opportunities.
- Major countries in each region are mapped according to their revenue contribution to the global market.
- Market player positioning facilitates benchmarking and provides a clear understanding of the present position of the market players.
- The report includes the analysis of the regional as well as global agriculture biologicals testing market trends, key players, market segments, application areas, and market growth strategies.
Key Market Segments
By Product Type
- Bio pesticides
- Bio fertilizers
- Bio stimulants
By End-User
- Government Agencies
- Plant Breeders
- Outsourced Contract Research Organization
- Biological Product Manufacturers
By Region
- North America
- U.S.
- Canada
- Mexico
- Europe
- Germany
- UK
- France
- Russia
- Spain
- Italy
- Rest of Europe
- Asia-Pacific
- China
- Japan
- South Korea
- India
- Australia
- Rest Of Asia Pacafic
- LAMEA
- Latin America
- Middle East
- Africa
Key Market Players:
- ALS Limited
- Anadiag Group
- Bionema Limited
- Eurofins APAL Pty Ltd
- Eurofins Scientific
- Laus GmbH
- RJ Hill Laboratories Limited
- SGS SA
- Staphyt SA
- Syntech Research Group
TABLE OF CONTENTS
CHAPTER 1: INTRODUCTION
- 1.1. Report description
- 1.2. Key market segments
- 1.3. Key benefits to the stakeholders
- 1.4. Research Methodology
- 1.4.1. Primary research
- 1.4.2. Secondary research
- 1.4.3. Analyst tools and models
CHAPTER 2: EXECUTIVE SUMMARY
- 2.1. CXO Perspective
CHAPTER 3: MARKET OVERVIEW
- 3.1. Market definition and scope
- 3.2. Key findings
- 3.2.1. Top impacting factors
- 3.2.2. Top investment pockets
- 3.3. Porter's five forces analysis
- 3.3.1. Bargaining power of suppliers
- 3.3.2. Bargaining power of buyers
- 3.3.3. Threat of substitutes
- 3.3.4. Threat of new entrants
- 3.3.5. Intensity of rivalry
- 3.4. Market dynamics
- 3.4.1. Drivers
- 3.4.1.1. Increased adoption of molecular diagnostics
- 3.4.1.2. The growing importance of soil testing
- 3.4.1.3. Increased use of biopesticides and biofertilizers
- 3.4.1.4. Expansion of the organic food industry
- 3.4.1. Drivers
- 3.4.2. Restraints
- 3.4.2.1. Limited infrastructure
- 3.4.2.2. Cultural and linguistic barriers
- 3.4.3. Opportunities
- 3.4.3.1. Biological pest control
- 3.4.3.2. Plant tissue testing
- 3.4.3.3. Nutrient management planning
- 3.5. COVID-19 Impact Analysis on the market
CHAPTER 4: AGRICULTURE BIOLOGICALS TESTING MARKET, BY PRODUCT TYPE
- 4.1. Overview
- 4.1.1. Market size and forecast
- 4.2. Bio pesticides
- 4.2.1. Key market trends, growth factors and opportunities
- 4.2.2. Market size and forecast, by region
- 4.2.3. Market share analysis by country
- 4.3. Bio fertilizers
- 4.3.1. Key market trends, growth factors and opportunities
- 4.3.2. Market size and forecast, by region
- 4.3.3. Market share analysis by country
- 4.4. Bio stimulants
- 4.4.1. Key market trends, growth factors and opportunities
- 4.4.2. Market size and forecast, by region
- 4.4.3. Market share analysis by country
CHAPTER 5: AGRICULTURE BIOLOGICALS TESTING MARKET, BY END-USER
- 5.1. Overview
- 5.1.1. Market size and forecast
- 5.2. Biological Product Manufacturers
- 5.2.1. Key market trends, growth factors and opportunities
- 5.2.2. Market size and forecast, by region
- 5.2.3. Market share analysis by country
- 5.3. Government Agencies
- 5.3.1. Key market trends, growth factors and opportunities
- 5.3.2. Market size and forecast, by region
- 5.3.3. Market share analysis by country
- 5.4. Plant Breeders
- 5.4.1. Key market trends, growth factors and opportunities
- 5.4.2. Market size and forecast, by region
- 5.4.3. Market share analysis by country
- 5.5. Outsourced Contract Research Organization
- 5.5.1. Key market trends, growth factors and opportunities
- 5.5.2. Market size and forecast, by region
- 5.5.3. Market share analysis by country
CHAPTER 6: AGRICULTURE BIOLOGICALS TESTING MARKET, BY REGION
- 6.1. Overview
- 6.1.1. Market size and forecast By Region
- 6.2. North America
- 6.2.1. Key trends and opportunities
- 6.2.2. Market size and forecast, by Product Type
- 6.2.3. Market size and forecast, by End-User
- 6.2.4. Market size and forecast, by country
- 6.2.4.1. U.S.
- 6.2.4.1.1. Key market trends, growth factors and opportunities
- 6.2.4.1.2. Market size and forecast, by Product Type
- 6.2.4.1.3. Market size and forecast, by End-User
- 6.2.4.2. Canada
- 6.2.4.2.1. Key market trends, growth factors and opportunities
- 6.2.4.2.2. Market size and forecast, by Product Type
- 6.2.4.2.3. Market size and forecast, by End-User
- 6.2.4.3. Mexico
- 6.2.4.3.1. Key market trends, growth factors and opportunities
- 6.2.4.3.2. Market size and forecast, by Product Type
- 6.2.4.3.3. Market size and forecast, by End-User
- 6.3. Europe
- 6.3.1. Key trends and opportunities
- 6.3.2. Market size and forecast, by Product Type
- 6.3.3. Market size and forecast, by End-User
- 6.3.4. Market size and forecast, by country
- 6.3.4.1. Germany
- 6.3.4.1.1. Key market trends, growth factors and opportunities
- 6.3.4.1.2. Market size and forecast, by Product Type
- 6.3.4.1.3. Market size and forecast, by End-User
- 6.3.4.2. UK
- 6.3.4.2.1. Key market trends, growth factors and opportunities
- 6.3.4.2.2. Market size and forecast, by Product Type
- 6.3.4.2.3. Market size and forecast, by End-User
- 6.3.4.3. France
- 6.3.4.3.1. Key market trends, growth factors and opportunities
- 6.3.4.3.2. Market size and forecast, by Product Type
- 6.3.4.3.3. Market size and forecast, by End-User
- 6.3.4.4. Russia
- 6.3.4.4.1. Key market trends, growth factors and opportunities
- 6.3.4.4.2. Market size and forecast, by Product Type
- 6.3.4.4.3. Market size and forecast, by End-User
- 6.3.4.5. Spain
- 6.3.4.5.1. Key market trends, growth factors and opportunities
- 6.3.4.5.2. Market size and forecast, by Product Type
- 6.3.4.5.3. Market size and forecast, by End-User
- 6.3.4.6. Italy
- 6.3.4.6.1. Key market trends, growth factors and opportunities
- 6.3.4.6.2. Market size and forecast, by Product Type
- 6.3.4.6.3. Market size and forecast, by End-User
- 6.3.4.7. Rest of Europe
- 6.3.4.7.1. Key market trends, growth factors and opportunities
- 6.3.4.7.2. Market size and forecast, by Product Type
- 6.3.4.7.3. Market size and forecast, by End-User
- 6.4. Asia-Pacific
- 6.4.1. Key trends and opportunities
- 6.4.2. Market size and forecast, by Product Type
- 6.4.3. Market size and forecast, by End-User
- 6.4.4. Market size and forecast, by country
- 6.4.4.1. China
- 6.4.4.1.1. Key market trends, growth factors and opportunities
- 6.4.4.1.2. Market size and forecast, by Product Type
- 6.4.4.1.3. Market size and forecast, by End-User
- 6.4.4.2. Japan
- 6.4.4.2.1. Key market trends, growth factors and opportunities
- 6.4.4.2.2. Market size and forecast, by Product Type
- 6.4.4.2.3. Market size and forecast, by End-User
- 6.4.4.3. South Korea
- 6.4.4.3.1. Key market trends, growth factors and opportunities
- 6.4.4.3.2. Market size and forecast, by Product Type
- 6.4.4.3.3. Market size and forecast, by End-User
- 6.4.4.4. India
- 6.4.4.4.1. Key market trends, growth factors and opportunities
- 6.4.4.4.2. Market size and forecast, by Product Type
- 6.4.4.4.3. Market size and forecast, by End-User
- 6.4.4.5. Australia
- 6.4.4.5.1. Key market trends, growth factors and opportunities
- 6.4.4.5.2. Market size and forecast, by Product Type
- 6.4.4.5.3. Market size and forecast, by End-User
- 6.4.4.6. Rest Of Asia Pacafic
- 6.4.4.6.1. Key market trends, growth factors and opportunities
- 6.4.4.6.2. Market size and forecast, by Product Type
- 6.4.4.6.3. Market size and forecast, by End-User
- 6.5. LAMEA
- 6.5.1. Key trends and opportunities
- 6.5.2. Market size and forecast, by Product Type
- 6.5.3. Market size and forecast, by End-User
- 6.5.4. Market size and forecast, by country
- 6.5.4.1. Latin America
- 6.5.4.1.1. Key market trends, growth factors and opportunities
- 6.5.4.1.2. Market size and forecast, by Product Type
- 6.5.4.1.3. Market size and forecast, by End-User
- 6.5.4.2. Middle East
- 6.5.4.2.1. Key market trends, growth factors and opportunities
- 6.5.4.2.2. Market size and forecast, by Product Type
- 6.5.4.2.3. Market size and forecast, by End-User
- 6.5.4.3. Africa
- 6.5.4.3.1. Key market trends, growth factors and opportunities
- 6.5.4.3.2. Market size and forecast, by Product Type
- 6.5.4.3.3. Market size and forecast, by End-User
CHAPTER 7: COMPETITIVE LANDSCAPE
- 7.1. Introduction
- 7.2. Top winning strategies
- 7.3. Product Mapping of Top 10 Player
- 7.4. Competitive Dashboard
- 7.5. Competitive Heatmap
- 7.6. Top player positioning, 2022
CHAPTER 8: COMPANY PROFILES
- 8.1. SGS SA
- 8.1.1. Company overview
- 8.1.2. Key Executives
- 8.1.3. Company snapshot
- 8.1.4. Operating business segments
- 8.1.5. Product portfolio
- 8.1.6. Business performance
- 8.1.7. Key strategic moves and developments
- 8.2. Eurofins Scientific
- 8.2.1. Company overview
- 8.2.2. Key Executives
- 8.2.3. Company snapshot
- 8.2.4. Operating business segments
- 8.2.5. Product portfolio
- 8.2.6. Business performance
- 8.3. Staphyt SA
- 8.3.1. Company overview
- 8.3.2. Key Executives
- 8.3.3. Company snapshot
- 8.3.4. Operating business segments
- 8.3.5. Product portfolio
- 8.4. Laus GmbH
- 8.4.1. Company overview
- 8.4.2. Key Executives
- 8.4.3. Company snapshot
- 8.4.4. Operating business segments
- 8.4.5. Product portfolio
- 8.5. Bionema Limited
- 8.5.1. Company overview
- 8.5.2. Key Executives
- 8.5.3. Company snapshot
- 8.5.4. Operating business segments
- 8.5.5. Product portfolio
- 8.6. Syntech Research Group
- 8.6.1. Company overview
- 8.6.2. Key Executives
- 8.6.3. Company snapshot
- 8.6.4. Operating business segments
- 8.6.5. Product portfolio
- 8.7. Anadiag Group
- 8.7.1. Company overview
- 8.7.2. Key Executives
- 8.7.3. Company snapshot
- 8.7.4. Operating business segments
- 8.7.5. Product portfolio
- 8.8. RJ Hill Laboratories Limited
- 8.8.1. Company overview
- 8.8.2. Key Executives
- 8.8.3. Company snapshot
- 8.8.4. Operating business segments
- 8.8.5. Product portfolio
- 8.9. Eurofins APAL Pty Ltd
- 8.9.1. Company overview
- 8.9.2. Key Executives
- 8.9.3. Company snapshot
- 8.9.4. Operating business segments
- 8.9.5. Product portfolio
- 8.10. ALS Limited
- 8.10.1. Company overview
- 8.10.2. Key Executives
- 8.10.3. Company snapshot
- 8.10.4. Operating business segments
- 8.10.5. Product portfolio
- 8.10.6. Business performance
- 8.10.7. Key strategic moves and developments