
|
市場調査レポート
商品コード
1344375
エスケープルーム市場:タイプ別、エンドユーザー別:世界の機会分析と産業予測、2023-2032年Escape Room Market By Type (Small Theme Room, Medium Theme Room, Big Theme Room ), By End User : Global Opportunity Analysis and Industry Forecast, 2023-2032 |
||||||
|
|||||||

| エスケープルーム市場:タイプ別、エンドユーザー別:世界の機会分析と産業予測、2023-2032年 |
|
出版日: 2023年06月01日
発行: Allied Market Research
ページ情報: 英文 250 Pages
納期: 2~3営業日
|

- 全表示
- 概要
- 図表
- 目次
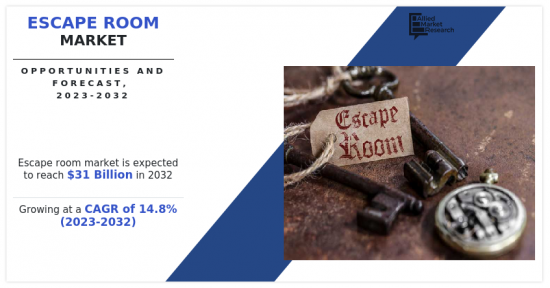
Allied Market Research発行の最新レポート「エスケープルーム市場」によると、エスケープルーム市場は2022年に79億米ドルと評価され、2023年から2032年にかけてCAGR 14.8%で成長し、2032年には310億米ドルに達すると推定されています。
エスケープルームとは、参加者がカスタマイズされた部屋に閉じ込められ、一連の謎やミステリーを解き明かして一定時間内に脱出する没入型アドベンチャーゲームの一種です。エスケープルームは近年、レクリエーション、共同活動、さらには教育ツールの一種として人気が高まっています。エスケープルームは、30分から1時間程度の時間制で行われることが多いです。制限時間内に脱出できなければゲームオーバーとなります。制限時間内にすべての問題を解き、脱出できれば勝利となります。
世界のエスケープルーム市場の主な促進要因は、冒険レジャー活動への関心の急速な高まりと、若年参入企業の需要です。若者はあまり探検されていない場所を探検する傾向があります。アドベンチャー・アクティビティに対するニーズの増加、可処分所得の増加、旅行パッケージの利用可能性も主要な促進要因です。アドベンチャー・ツーリズム市場の成長機会は、マーケティング活動や政府のイニシアチブの高まり、ソーシャルメディア上の旅行動向に対する消費者の関心の高まりにより、新たな有利な機会をもたらすと予想されます。
エスケープルームのパッケージが低価格で入手可能なため、個人やグループがエスケープルームツアーを選ぶ傾向にあります。エスケープルームにシミュレーターやバーチャルリアリティを採用し、さまざまなテーマやコンセプトに人工知能を導入することで継続的にイノベーションを起こすことが、成長の機会を提供しています。アドベンチャー・ツーリズムの活動に対する政府支援の増加、各当局による投資の増加、休日にアドベンチャー・スポーツを楽しむ傾向の高まりは、予測期間中に世界的に成長を加速させると予想される主な要因の一つです。
目次
第1章 イントロダクション
第2章 エグゼクティブサマリー
第3章 市場概要
- 市場の定義と範囲
- 主な調査結果
- 影響要因
- 主な投資機会
- ポーターのファイブフォース分析
- 市場力学
- 促進要因
- 娯楽や社会活動としてのエスケープルーム人気の高まり
- 企業グループによるエスケープルーム利用の増加
- 斬新なテーマの開発
- 抑制要因
- エスケープルーム事業のキャパシティとスケーラビリティの限界
- 若者の間でのeスポーツ人気の高まり
- 機会
- 新しい市場や場所へのエスケープルーム施設の拡大
- 促進要因
- COVID-19による市場への影響分析
- 市場シェア分析
第4章 エスケープルーム市場:タイプ別
- 小型テーマルーム(2~4人用)
- 中型テーマルーム(5~8人用)
- 大型テーマルーム(9~12人用)
第5章 エスケープルーム市場:エンドユーザー別
- 友人
- 企業グループ
- 個人
- 家族
- カップル
第6章 エスケープルーム市場:地域別
- 北米
- 米国
- カナダ
- メキシコ
- 欧州
- ドイツ
- 英国
- フランス
- イタリア
- スペイン
- オランダ
- ロシア
- ポーランド
- その他欧州
- アジア太平洋
- 中国
- 日本
- インド
- オーストラリア
- 韓国
- その他アジア太平洋地域
- ラテンアメリカ・中東・アフリカ
- ブラジル
- サウジアラビア
- 南アフリカ
- UAE
- アルゼンチン
- その他の地域
第7章 競合情勢
- イントロダクション
- 主要成功戦略
- 主要10社の製品マッピング
- 競合ダッシュボード
- 競合ヒートマップ
- 主要企業のポジショニング、2022年
第8章 企業プロファイル
- Breakout Operations, LLC
- All In Adventures, LLC
- Escapology LLC
- Escape The Room
- The Great Escape Room
- Paniq Entertainment LLC
- Epic Escape Game
- Great Room Escape
- Maze Rooms Corp.
- The Escape Game, LLC
- Amazing Escape Room, LLC
- 60 Out Escape Rooms
- Texas Panic Room
- Puzzle Effect
- XP Factory Plc
LIST OF TABLES
- TABLE 01. GLOBAL ESCAPE ROOM MARKET, BY TYPE, 2022-2032 ($MILLION)
- TABLE 02. ESCAPE ROOM MARKET FOR SMALL THEME ROOM (2 TO 4 PERSON), BY REGION, 2022-2032 ($MILLION)
- TABLE 03. ESCAPE ROOM MARKET FOR MEDIUM THEME ROOM (5 TO 8 PERSON), BY REGION, 2022-2032 ($MILLION)
- TABLE 04. ESCAPE ROOM MARKET FOR BIG THEME ROOM (9 TO 12 PERSON), BY REGION, 2022-2032 ($MILLION)
- TABLE 05. GLOBAL ESCAPE ROOM MARKET, BY END USER, 2022-2032 ($MILLION)
- TABLE 06. ESCAPE ROOM MARKET FOR FRIENDS, BY REGION, 2022-2032 ($MILLION)
- TABLE 07. ESCAPE ROOM MARKET FOR CORPORATE GROUPS, BY REGION, 2022-2032 ($MILLION)
- TABLE 08. ESCAPE ROOM MARKET FOR INDIVIDUALS, BY REGION, 2022-2032 ($MILLION)
- TABLE 09. ESCAPE ROOM MARKET FOR FAMILIES, BY REGION, 2022-2032 ($MILLION)
- TABLE 10. ESCAPE ROOM MARKET FOR COUPLES, BY REGION, 2022-2032 ($MILLION)
- TABLE 11. ESCAPE ROOM MARKET, BY REGION, 2022-2032 ($MILLION)
- TABLE 12. NORTH AMERICA ESCAPE ROOM MARKET, BY TYPE, 2022-2032 ($MILLION)
- TABLE 13. NORTH AMERICA ESCAPE ROOM MARKET, BY END USER, 2022-2032 ($MILLION)
- TABLE 14. NORTH AMERICA ESCAPE ROOM MARKET, BY COUNTRY, 2022-2032 ($MILLION)
- TABLE 15. U.S. ESCAPE ROOM MARKET, BY TYPE, 2022-2032 ($MILLION)
- TABLE 16. U.S. ESCAPE ROOM MARKET, BY END USER, 2022-2032 ($MILLION)
- TABLE 17. CANADA ESCAPE ROOM MARKET, BY TYPE, 2022-2032 ($MILLION)
- TABLE 18. CANADA ESCAPE ROOM MARKET, BY END USER, 2022-2032 ($MILLION)
- TABLE 19. MEXICO ESCAPE ROOM MARKET, BY TYPE, 2022-2032 ($MILLION)
- TABLE 20. MEXICO ESCAPE ROOM MARKET, BY END USER, 2022-2032 ($MILLION)
- TABLE 21. EUROPE ESCAPE ROOM MARKET, BY TYPE, 2022-2032 ($MILLION)
- TABLE 22. EUROPE ESCAPE ROOM MARKET, BY END USER, 2022-2032 ($MILLION)
- TABLE 23. EUROPE ESCAPE ROOM MARKET, BY COUNTRY, 2022-2032 ($MILLION)
- TABLE 24. GERMANY ESCAPE ROOM MARKET, BY TYPE, 2022-2032 ($MILLION)
- TABLE 25. GERMANY ESCAPE ROOM MARKET, BY END USER, 2022-2032 ($MILLION)
- TABLE 26. UK ESCAPE ROOM MARKET, BY TYPE, 2022-2032 ($MILLION)
- TABLE 27. UK ESCAPE ROOM MARKET, BY END USER, 2022-2032 ($MILLION)
- TABLE 28. FRANCE ESCAPE ROOM MARKET, BY TYPE, 2022-2032 ($MILLION)
- TABLE 29. FRANCE ESCAPE ROOM MARKET, BY END USER, 2022-2032 ($MILLION)
- TABLE 30. ITALY ESCAPE ROOM MARKET, BY TYPE, 2022-2032 ($MILLION)
- TABLE 31. ITALY ESCAPE ROOM MARKET, BY END USER, 2022-2032 ($MILLION)
- TABLE 32. SPAIN ESCAPE ROOM MARKET, BY TYPE, 2022-2032 ($MILLION)
- TABLE 33. SPAIN ESCAPE ROOM MARKET, BY END USER, 2022-2032 ($MILLION)
- TABLE 34. NETHERLANDS ESCAPE ROOM MARKET, BY TYPE, 2022-2032 ($MILLION)
- TABLE 35. NETHERLANDS ESCAPE ROOM MARKET, BY END USER, 2022-2032 ($MILLION)
- TABLE 36. RUSSIA ESCAPE ROOM MARKET, BY TYPE, 2022-2032 ($MILLION)
- TABLE 37. RUSSIA ESCAPE ROOM MARKET, BY END USER, 2022-2032 ($MILLION)
- TABLE 38. POLAND ESCAPE ROOM MARKET, BY TYPE, 2022-2032 ($MILLION)
- TABLE 39. POLAND ESCAPE ROOM MARKET, BY END USER, 2022-2032 ($MILLION)
- TABLE 40. REST OF EUROPE ESCAPE ROOM MARKET, BY TYPE, 2022-2032 ($MILLION)
- TABLE 41. REST OF EUROPE ESCAPE ROOM MARKET, BY END USER, 2022-2032 ($MILLION)
- TABLE 42. ASIA-PACIFIC ESCAPE ROOM MARKET, BY TYPE, 2022-2032 ($MILLION)
- TABLE 43. ASIA-PACIFIC ESCAPE ROOM MARKET, BY END USER, 2022-2032 ($MILLION)
- TABLE 44. ASIA-PACIFIC ESCAPE ROOM MARKET, BY COUNTRY, 2022-2032 ($MILLION)
- TABLE 45. CHINA ESCAPE ROOM MARKET, BY TYPE, 2022-2032 ($MILLION)
- TABLE 46. CHINA ESCAPE ROOM MARKET, BY END USER, 2022-2032 ($MILLION)
- TABLE 47. JAPAN ESCAPE ROOM MARKET, BY TYPE, 2022-2032 ($MILLION)
- TABLE 48. JAPAN ESCAPE ROOM MARKET, BY END USER, 2022-2032 ($MILLION)
- TABLE 49. INDIA ESCAPE ROOM MARKET, BY TYPE, 2022-2032 ($MILLION)
- TABLE 50. INDIA ESCAPE ROOM MARKET, BY END USER, 2022-2032 ($MILLION)
- TABLE 51. AUSTRALIA ESCAPE ROOM MARKET, BY TYPE, 2022-2032 ($MILLION)
- TABLE 52. AUSTRALIA ESCAPE ROOM MARKET, BY END USER, 2022-2032 ($MILLION)
- TABLE 53. SOUTH KOREA ESCAPE ROOM MARKET, BY TYPE, 2022-2032 ($MILLION)
- TABLE 54. SOUTH KOREA ESCAPE ROOM MARKET, BY END USER, 2022-2032 ($MILLION)
- TABLE 55. REST OF ASIA-PACIFIC ESCAPE ROOM MARKET, BY TYPE, 2022-2032 ($MILLION)
- TABLE 56. REST OF ASIA-PACIFIC ESCAPE ROOM MARKET, BY END USER, 2022-2032 ($MILLION)
- TABLE 57. LAMEA ESCAPE ROOM MARKET, BY TYPE, 2022-2032 ($MILLION)
- TABLE 58. LAMEA ESCAPE ROOM MARKET, BY END USER, 2022-2032 ($MILLION)
- TABLE 59. LAMEA ESCAPE ROOM MARKET, BY COUNTRY, 2022-2032 ($MILLION)
- TABLE 60. BRAZIL ESCAPE ROOM MARKET, BY TYPE, 2022-2032 ($MILLION)
- TABLE 61. BRAZIL ESCAPE ROOM MARKET, BY END USER, 2022-2032 ($MILLION)
- TABLE 62. SAUDI ARABIA ESCAPE ROOM MARKET, BY TYPE, 2022-2032 ($MILLION)
- TABLE 63. SAUDI ARABIA ESCAPE ROOM MARKET, BY END USER, 2022-2032 ($MILLION)
- TABLE 64. SOUTH AFRICA ESCAPE ROOM MARKET, BY TYPE, 2022-2032 ($MILLION)
- TABLE 65. SOUTH AFRICA ESCAPE ROOM MARKET, BY END USER, 2022-2032 ($MILLION)
- TABLE 66. UAE ESCAPE ROOM MARKET, BY TYPE, 2022-2032 ($MILLION)
- TABLE 67. UAE ESCAPE ROOM MARKET, BY END USER, 2022-2032 ($MILLION)
- TABLE 68. ARGENTINA ESCAPE ROOM MARKET, BY TYPE, 2022-2032 ($MILLION)
- TABLE 69. ARGENTINA ESCAPE ROOM MARKET, BY END USER, 2022-2032 ($MILLION)
- TABLE 70. REST OF LAMEA ESCAPE ROOM MARKET, BY TYPE, 2022-2032 ($MILLION)
- TABLE 71. REST OF LAMEA ESCAPE ROOM MARKET, BY END USER, 2022-2032 ($MILLION)
- TABLE 72. BREAKOUT OPERATIONS, LLC: KEY EXECUTIVES
- TABLE 73. BREAKOUT OPERATIONS, LLC: COMPANY SNAPSHOT
- TABLE 74. BREAKOUT OPERATIONS, LLC: SERVICE SEGMENTS
- TABLE 75. BREAKOUT OPERATIONS, LLC: PRODUCT PORTFOLIO
- TABLE 76. ALL IN ADVENTURES, LLC: KEY EXECUTIVES
- TABLE 77. ALL IN ADVENTURES, LLC: COMPANY SNAPSHOT
- TABLE 78. ALL IN ADVENTURES, LLC: SERVICE SEGMENTS
- TABLE 79. ALL IN ADVENTURES, LLC: PRODUCT PORTFOLIO
- TABLE 80. ESCAPOLOGY LLC: KEY EXECUTIVES
- TABLE 81. ESCAPOLOGY LLC: COMPANY SNAPSHOT
- TABLE 82. ESCAPOLOGY LLC: SERVICE SEGMENTS
- TABLE 83. ESCAPOLOGY LLC: PRODUCT PORTFOLIO
- TABLE 84. ESCAPOLOGY LLC: KEY STRATERGIES
- TABLE 85. ESCAPE THE ROOM: KEY EXECUTIVES
- TABLE 86. ESCAPE THE ROOM: COMPANY SNAPSHOT
- TABLE 87. ESCAPE THE ROOM: SERVICE SEGMENTS
- TABLE 88. ESCAPE THE ROOM: PRODUCT PORTFOLIO
- TABLE 89. THE GREAT ESCAPE ROOM: KEY EXECUTIVES
- TABLE 90. THE GREAT ESCAPE ROOM: COMPANY SNAPSHOT
- TABLE 91. THE GREAT ESCAPE ROOM: SERVICE SEGMENTS
- TABLE 92. THE GREAT ESCAPE ROOM: PRODUCT PORTFOLIO
- TABLE 93. PANIQ ENTERTAINMENT LLC: KEY EXECUTIVES
- TABLE 94. PANIQ ENTERTAINMENT LLC: COMPANY SNAPSHOT
- TABLE 95. PANIQ ENTERTAINMENT LLC: SERVICE SEGMENTS
- TABLE 96. PANIQ ENTERTAINMENT LLC: PRODUCT PORTFOLIO
- TABLE 97. PANIQ ENTERTAINMENT LLC: KEY STRATERGIES
- TABLE 98. EPIC ESCAPE GAME: KEY EXECUTIVES
- TABLE 99. EPIC ESCAPE GAME: COMPANY SNAPSHOT
- TABLE 100. EPIC ESCAPE GAME: SERVICE SEGMENTS
- TABLE 101. EPIC ESCAPE GAME: PRODUCT PORTFOLIO
- TABLE 102. GREAT ROOM ESCAPE: KEY EXECUTIVES
- TABLE 103. GREAT ROOM ESCAPE: COMPANY SNAPSHOT
- TABLE 104. GREAT ROOM ESCAPE: SERVICE SEGMENTS
- TABLE 105. GREAT ROOM ESCAPE: PRODUCT PORTFOLIO
- TABLE 106. MAZE ROOMS CORP.: KEY EXECUTIVES
- TABLE 107. MAZE ROOMS CORP.: COMPANY SNAPSHOT
- TABLE 108. MAZE ROOMS CORP.: SERVICE SEGMENTS
- TABLE 109. MAZE ROOMS CORP.: PRODUCT PORTFOLIO
- TABLE 110. THE ESCAPE GAME, LLC: KEY EXECUTIVES
- TABLE 111. THE ESCAPE GAME, LLC: COMPANY SNAPSHOT
- TABLE 112. THE ESCAPE GAME, LLC: SERVICE SEGMENTS
- TABLE 113. THE ESCAPE GAME, LLC: PRODUCT PORTFOLIO
- TABLE 114. THE ESCAPE GAME, LLC: KEY STRATERGIES
- TABLE 115. AMAZING ESCAPE ROOM, LLC: KEY EXECUTIVES
- TABLE 116. AMAZING ESCAPE ROOM, LLC: COMPANY SNAPSHOT
- TABLE 117. AMAZING ESCAPE ROOM, LLC: SERVICE SEGMENTS
- TABLE 118. AMAZING ESCAPE ROOM, LLC: PRODUCT PORTFOLIO
- TABLE 119. 60 OUT ESCAPE ROOMS: KEY EXECUTIVES
- TABLE 120. 60 OUT ESCAPE ROOMS: COMPANY SNAPSHOT
- TABLE 121. 60 OUT ESCAPE ROOMS: SERVICE SEGMENTS
- TABLE 122. 60 OUT ESCAPE ROOMS: PRODUCT PORTFOLIO
- TABLE 123. TEXAS PANIC ROOM: KEY EXECUTIVES
- TABLE 124. TEXAS PANIC ROOM: COMPANY SNAPSHOT
- TABLE 125. TEXAS PANIC ROOM: SERVICE SEGMENTS
- TABLE 126. TEXAS PANIC ROOM: PRODUCT PORTFOLIO
- TABLE 127. PUZZLE EFFECT: KEY EXECUTIVES
- TABLE 128. PUZZLE EFFECT: COMPANY SNAPSHOT
- TABLE 129. PUZZLE EFFECT: SERVICE SEGMENTS
- TABLE 130. PUZZLE EFFECT: PRODUCT PORTFOLIO
- TABLE 131. PUZZLE EFFECT: KEY STRATERGIES
- TABLE 132. XP FACTORY PLC: KEY EXECUTIVES
- TABLE 133. XP FACTORY PLC: COMPANY SNAPSHOT
- TABLE 134. XP FACTORY PLC: SERVICE SEGMENTS
- TABLE 135. XP FACTORY PLC: PRODUCT PORTFOLIO
- TABLE 136. XP FACTORY PLC: KEY STRATERGIES
LIST OF FIGURES
- FIGURE 01. ESCAPE ROOM MARKET, 2022-2032
- FIGURE 02. SEGMENTATION OF ESCAPE ROOM MARKET, 2022-2032
- FIGURE 03. ESCAPE ROOM MARKET,2022-2032
- FIGURE 04. TOP INVESTMENT POCKETS IN ESCAPE ROOM MARKET (2023-2032)
- FIGURE 05. MODERATE BARGAINING POWER OF SUPPLIERS
- FIGURE 06. MODERATE THREAT OF NEW ENTRANTS
- FIGURE 07. HIGH THREAT OF SUBSTITUTES
- FIGURE 08. MODERATE TO HIGH INTENSITY OF RIVALRY
- FIGURE 09. MODERATE BARGAINING POWER OF BUYERS
- FIGURE 10. GLOBAL ESCAPE ROOM MARKET:DRIVERS, RESTRAINTS AND OPPORTUNITIES
- FIGURE 11. REGIONAL MARKET SHARE ANALYSIS OF NORTH AMERICA ESCAPE ROOM MARKET BY KEY PLAYERS, 2021 (%)
- FIGURE 12. ESCAPE ROOM MARKET, BY TYPE, 2022(%)
- FIGURE 13. COMPARATIVE SHARE ANALYSIS OF ESCAPE ROOM MARKET FOR SMALL THEME ROOM (2 TO 4 PERSON), BY COUNTRY 2022 AND 2032(%)
- FIGURE 14. COMPARATIVE SHARE ANALYSIS OF ESCAPE ROOM MARKET FOR MEDIUM THEME ROOM (5 TO 8 PERSON), BY COUNTRY 2022 AND 2032(%)
- FIGURE 15. COMPARATIVE SHARE ANALYSIS OF ESCAPE ROOM MARKET FOR BIG THEME ROOM (9 TO 12 PERSON), BY COUNTRY 2022 AND 2032(%)
- FIGURE 16. ESCAPE ROOM MARKET, BY END USER, 2022(%)
- FIGURE 17. COMPARATIVE SHARE ANALYSIS OF ESCAPE ROOM MARKET FOR FRIENDS, BY COUNTRY 2022 AND 2032(%)
- FIGURE 18. COMPARATIVE SHARE ANALYSIS OF ESCAPE ROOM MARKET FOR CORPORATE GROUPS, BY COUNTRY 2022 AND 2032(%)
- FIGURE 19. COMPARATIVE SHARE ANALYSIS OF ESCAPE ROOM MARKET FOR INDIVIDUALS, BY COUNTRY 2022 AND 2032(%)
- FIGURE 20. COMPARATIVE SHARE ANALYSIS OF ESCAPE ROOM MARKET FOR FAMILIES, BY COUNTRY 2022 AND 2032(%)
- FIGURE 21. COMPARATIVE SHARE ANALYSIS OF ESCAPE ROOM MARKET FOR COUPLES, BY COUNTRY 2022 AND 2032(%)
- FIGURE 22. ESCAPE ROOM MARKET BY REGION, 2022
- FIGURE 23. U.S. ESCAPE ROOM MARKET, 2022-2032 ($MILLION)
- FIGURE 24. CANADA ESCAPE ROOM MARKET, 2022-2032 ($MILLION)
- FIGURE 25. MEXICO ESCAPE ROOM MARKET, 2022-2032 ($MILLION)
- FIGURE 26. GERMANY ESCAPE ROOM MARKET, 2022-2032 ($MILLION)
- FIGURE 27. UK ESCAPE ROOM MARKET, 2022-2032 ($MILLION)
- FIGURE 28. FRANCE ESCAPE ROOM MARKET, 2022-2032 ($MILLION)
- FIGURE 29. ITALY ESCAPE ROOM MARKET, 2022-2032 ($MILLION)
- FIGURE 30. SPAIN ESCAPE ROOM MARKET, 2022-2032 ($MILLION)
- FIGURE 31. NETHERLANDS ESCAPE ROOM MARKET, 2022-2032 ($MILLION)
- FIGURE 32. RUSSIA ESCAPE ROOM MARKET, 2022-2032 ($MILLION)
- FIGURE 33. POLAND ESCAPE ROOM MARKET, 2022-2032 ($MILLION)
- FIGURE 34. REST OF EUROPE ESCAPE ROOM MARKET, 2022-2032 ($MILLION)
- FIGURE 35. CHINA ESCAPE ROOM MARKET, 2022-2032 ($MILLION)
- FIGURE 36. JAPAN ESCAPE ROOM MARKET, 2022-2032 ($MILLION)
- FIGURE 37. INDIA ESCAPE ROOM MARKET, 2022-2032 ($MILLION)
- FIGURE 38. AUSTRALIA ESCAPE ROOM MARKET, 2022-2032 ($MILLION)
- FIGURE 39. SOUTH KOREA ESCAPE ROOM MARKET, 2022-2032 ($MILLION)
- FIGURE 40. REST OF ASIA-PACIFIC ESCAPE ROOM MARKET, 2022-2032 ($MILLION)
- FIGURE 41. BRAZIL ESCAPE ROOM MARKET, 2022-2032 ($MILLION)
- FIGURE 42. SAUDI ARABIA ESCAPE ROOM MARKET, 2022-2032 ($MILLION)
- FIGURE 43. SOUTH AFRICA ESCAPE ROOM MARKET, 2022-2032 ($MILLION)
- FIGURE 44. UAE ESCAPE ROOM MARKET, 2022-2032 ($MILLION)
- FIGURE 45. ARGENTINA ESCAPE ROOM MARKET, 2022-2032 ($MILLION)
- FIGURE 46. REST OF LAMEA ESCAPE ROOM MARKET, 2022-2032 ($MILLION)
- FIGURE 47. TOP WINNING STRATEGIES, BY YEAR
- FIGURE 48. TOP WINNING STRATEGIES, BY DEVELOPMENT
- FIGURE 49. TOP WINNING STRATEGIES, BY COMPANY
- FIGURE 50. PRODUCT MAPPING OF TOP 10 PLAYERS
- FIGURE 51. COMPETITIVE DASHBOARD
- FIGURE 52. COMPETITIVE HEATMAP: ESCAPE ROOM MARKET
- FIGURE 53. TOP PLAYER POSITIONING, 2022
- FIGURE 54. XP FACTORY PLC: NET SALES, 2019-2021 ($MILLION)
- FIGURE 55. XP FACTORY PLC: REVENUE SHARE BY REGION, 2021 (%)
- FIGURE 56. XP FACTORY PLC: REVENUE SHARE BY SEGMENT, 2021 (%)
According to a new report published by Allied Market Research, titled, "Escape Room Market," The escape room market was valued at $7.9 billion in 2022, and is estimated to reach $31 billion by 2032, growing at a CAGR of 14.8% from 2023 to 2032.
An escape room is a type of immersive adventure game in which participants are confined in a customized room and must figure out a series of riddles and mysteries to escape within a certain amount of time. Escape rooms have grown in popularity as a type of recreation, collaborative activities activity, and even educational tool in recent years. Escape rooms are frequently timed, ranging from 30 minutes to an hour. If the players do not escape within the time limit, they will lose the game. They win the game if they solve all the problems and escape before time runs out.
The main drivers for the global escape room market are rapid growth in interest in adventure leisure activities, as well as demand from young participants. Young people tend to explore places that are not as explored. The increase in need for adventure activities, a rise in disposable income, and the availability of travel packages are also key drivers. The growth of the adventure tourism market is expected to bring new lucrative opportunities owing to rising marketing activities and governmental initiatives, as well as increased consumer interest in travel trends on social media.
The availability of escape room packages at a low price influences individuals and groups to opt for escape room tours. The adoption of simulators and virtual reality in an escape room, as well as continuous innovation with the introduction of artificial intelligence in different themes and concepts, provides an opportunity for growth. Increased government support for activities for adventure tourism, increase in investment by the respective authorities, and the growing trend of adventure sports on holidays are among the main factors expected to accelerate growth worldwide over the forecast period.
The escape room market is segmented into type, end user, and region. By type, the market is classified into small theme room (2 to 4 people), medium theme room (5 to 8 people), and big theme room (9 to 12 people). By end user, the market is classified into friends, corporate groups, individuals, families, and couples. Region-wise, the market is analyzed across North America (the U.S., Canada, and Mexico), Europe (Germany, UK, France, Spain, Italy, the Netherlands, Russia, Poland, and the rest of Europe), Asia-Pacific (China, Japan, India, Australia, South Korea, and the rest of Asia-Pacific), and LAMEA (Brazil, Saudi Arabia, South Africa, UAE, Argentina, and rest of LAMEA).
Players operating in the global escape room market have adopted various developmental strategies to expand their escape room market share, increase profitability, and remain competitive in the market. Key players profiled in this report include Breakout Operations, LLC, All In Adventures, LLC, Escape The Room, The Great Escape Room, Paniq Entertainment LLC, Epic Escape Game, Great Room Escape, Maze Rooms Corp., The Escape Game, LLC, The Escape Game, LLC, 60 Out Escape Rooms, Texas Panic Room, Puzzle Effect, Escapology LLC, and XP Factory Plc.
Key Benefits For Stakeholders
- This report provides a quantitative analysis of the market segments, current trends, estimations, and dynamics of the escape room market analysis from 2022 to 2032 to identify the prevailing escape room market opportunities.
- The market research is offered along with information related to key drivers, restraints, and opportunities.
- Porter's five forces analysis highlights the potency of buyers and suppliers to enable stakeholders make profit-oriented business decisions and strengthen their supplier-buyer network.
- In-depth analysis of the escape room market segmentation assists to determine the prevailing market opportunities.
- Major countries in each region are mapped according to their revenue contribution to the global market.
- Market player positioning facilitates benchmarking and provides a clear understanding of the present position of the market players.
- The report includes the analysis of the regional as well as global escape room market trends, key players, market segments, application areas, and market growth strategies.
Key Market Segments
By Type
- Small Theme Room (2 to 4 person)
- Medium Theme Room (5 to 8 person)
- Big Theme Room (9 to 12 person)
By End User
- Friends
- Corporate groups
- Individuals
- Families
- Couples
By Region
- North America
- U.S.
- Canada
- Mexico
- Europe
- Germany
- UK
- France
- Italy
- Spain
- Netherlands
- Russia
- Poland
- Rest of Europe
- Asia-Pacific
- China
- Japan
- India
- Australia
- South Korea
- Rest of Asia-Pacific
- LAMEA
- Brazil
- Saudi Arabia
- South Africa
- UAE
- Argentina
- Rest of LAMEA
Key Market Players:
- 60 Out Escape Rooms
- All In Adventures, LLC
- Amazing Escape Room, LLC
- Breakout Operations, LLC
- Epic Escape Game
- Escape The Room
- Escapology LLC
- Great Room Escape
- Maze Rooms Corp.
- Paniq Entertainment LLC
- Puzzle Effect
- Texas Panic Room
- The Escape Game, LLC
- The Great Escape Room
- XP Factory Plc
TABLE OF CONTENTS
CHAPTER 1: INTRODUCTION
- 1.1. Report description
- 1.2. Key market segments
- 1.3. Key benefits to the stakeholders
- 1.4. Research Methodology
- 1.4.1. Primary research
- 1.4.2. Secondary research
- 1.4.3. Analyst tools and models
CHAPTER 2: EXECUTIVE SUMMARY
- 2.1. CXO Perspective
CHAPTER 3: MARKET OVERVIEW
- 3.1. Market definition and scope
- 3.2. Key findings
- 3.2.1. Top impacting factors
- 3.2.2. Top investment pockets
- 3.3. Porter's five forces analysis
- 3.3.1. Moderate bargaining power of suppliers
- 3.3.2. Moderate threat of new entrants
- 3.3.3. High threat of substitutes
- 3.3.4. Moderate to high intensity of rivalry
- 3.3.5. Moderate bargaining power of buyers
- 3.4. Market dynamics
- 3.4.1. Drivers
- 3.4.1.1. Growth in popularity of escape rooms as a form of entertainment and social activity
- 3.4.1.2. Increase in usage of escape room by corporate group
- 3.4.1.3. Development of new and innovative escape room themes
- 3.4.1. Drivers
- 3.4.2. Restraints
- 3.4.2.1. Limited capacity and scalability for escape room businesses
- 3.4.2.2. Increase in popularity of e-sports among youth
- 3.4.3. Opportunities
- 3.4.3.1. Expansion of escape room facilities into new markets and locations
- 3.5. COVID-19 Impact Analysis on the market
- 3.6. Market Share Analysis
CHAPTER 4: ESCAPE ROOM MARKET, BY TYPE
- 4.1. Overview
- 4.1.1. Market size and forecast
- 4.2. Small Theme Room (2 to 4 person)
- 4.2.1. Key market trends, growth factors and opportunities
- 4.2.2. Market size and forecast, by region
- 4.2.3. Market share analysis by country
- 4.3. Medium Theme Room (5 to 8 person)
- 4.3.1. Key market trends, growth factors and opportunities
- 4.3.2. Market size and forecast, by region
- 4.3.3. Market share analysis by country
- 4.4. Big Theme Room (9 to 12 person)
- 4.4.1. Key market trends, growth factors and opportunities
- 4.4.2. Market size and forecast, by region
- 4.4.3. Market share analysis by country
CHAPTER 5: ESCAPE ROOM MARKET, BY END USER
- 5.1. Overview
- 5.1.1. Market size and forecast
- 5.2. Friends
- 5.2.1. Key market trends, growth factors and opportunities
- 5.2.2. Market size and forecast, by region
- 5.2.3. Market share analysis by country
- 5.3. Corporate groups
- 5.3.1. Key market trends, growth factors and opportunities
- 5.3.2. Market size and forecast, by region
- 5.3.3. Market share analysis by country
- 5.4. Individuals
- 5.4.1. Key market trends, growth factors and opportunities
- 5.4.2. Market size and forecast, by region
- 5.4.3. Market share analysis by country
- 5.5. Families
- 5.5.1. Key market trends, growth factors and opportunities
- 5.5.2. Market size and forecast, by region
- 5.5.3. Market share analysis by country
- 5.6. Couples
- 5.6.1. Key market trends, growth factors and opportunities
- 5.6.2. Market size and forecast, by region
- 5.6.3. Market share analysis by country
CHAPTER 6: ESCAPE ROOM MARKET, BY REGION
- 6.1. Overview
- 6.1.1. Market size and forecast By Region
- 6.2. North America
- 6.2.1. Key trends and opportunities
- 6.2.2. Market size and forecast, by Type
- 6.2.3. Market size and forecast, by End User
- 6.2.4. Market size and forecast, by country
- 6.2.4.1. U.S.
- 6.2.4.1.1. Key market trends, growth factors and opportunities
- 6.2.4.1.2. Market size and forecast, by Type
- 6.2.4.1.3. Market size and forecast, by End User
- 6.2.4.2. Canada
- 6.2.4.2.1. Key market trends, growth factors and opportunities
- 6.2.4.2.2. Market size and forecast, by Type
- 6.2.4.2.3. Market size and forecast, by End User
- 6.2.4.3. Mexico
- 6.2.4.3.1. Key market trends, growth factors and opportunities
- 6.2.4.3.2. Market size and forecast, by Type
- 6.2.4.3.3. Market size and forecast, by End User
- 6.3. Europe
- 6.3.1. Key trends and opportunities
- 6.3.2. Market size and forecast, by Type
- 6.3.3. Market size and forecast, by End User
- 6.3.4. Market size and forecast, by country
- 6.3.4.1. Germany
- 6.3.4.1.1. Key market trends, growth factors and opportunities
- 6.3.4.1.2. Market size and forecast, by Type
- 6.3.4.1.3. Market size and forecast, by End User
- 6.3.4.2. UK
- 6.3.4.2.1. Key market trends, growth factors and opportunities
- 6.3.4.2.2. Market size and forecast, by Type
- 6.3.4.2.3. Market size and forecast, by End User
- 6.3.4.3. France
- 6.3.4.3.1. Key market trends, growth factors and opportunities
- 6.3.4.3.2. Market size and forecast, by Type
- 6.3.4.3.3. Market size and forecast, by End User
- 6.3.4.4. Italy
- 6.3.4.4.1. Key market trends, growth factors and opportunities
- 6.3.4.4.2. Market size and forecast, by Type
- 6.3.4.4.3. Market size and forecast, by End User
- 6.3.4.5. Spain
- 6.3.4.5.1. Key market trends, growth factors and opportunities
- 6.3.4.5.2. Market size and forecast, by Type
- 6.3.4.5.3. Market size and forecast, by End User
- 6.3.4.6. Netherlands
- 6.3.4.6.1. Key market trends, growth factors and opportunities
- 6.3.4.6.2. Market size and forecast, by Type
- 6.3.4.6.3. Market size and forecast, by End User
- 6.3.4.7. Russia
- 6.3.4.7.1. Key market trends, growth factors and opportunities
- 6.3.4.7.2. Market size and forecast, by Type
- 6.3.4.7.3. Market size and forecast, by End User
- 6.3.4.8. Poland
- 6.3.4.8.1. Key market trends, growth factors and opportunities
- 6.3.4.8.2. Market size and forecast, by Type
- 6.3.4.8.3. Market size and forecast, by End User
- 6.3.4.9. Rest of Europe
- 6.3.4.9.1. Key market trends, growth factors and opportunities
- 6.3.4.9.2. Market size and forecast, by Type
- 6.3.4.9.3. Market size and forecast, by End User
- 6.4. Asia-Pacific
- 6.4.1. Key trends and opportunities
- 6.4.2. Market size and forecast, by Type
- 6.4.3. Market size and forecast, by End User
- 6.4.4. Market size and forecast, by country
- 6.4.4.1. China
- 6.4.4.1.1. Key market trends, growth factors and opportunities
- 6.4.4.1.2. Market size and forecast, by Type
- 6.4.4.1.3. Market size and forecast, by End User
- 6.4.4.2. Japan
- 6.4.4.2.1. Key market trends, growth factors and opportunities
- 6.4.4.2.2. Market size and forecast, by Type
- 6.4.4.2.3. Market size and forecast, by End User
- 6.4.4.3. India
- 6.4.4.3.1. Key market trends, growth factors and opportunities
- 6.4.4.3.2. Market size and forecast, by Type
- 6.4.4.3.3. Market size and forecast, by End User
- 6.4.4.4. Australia
- 6.4.4.4.1. Key market trends, growth factors and opportunities
- 6.4.4.4.2. Market size and forecast, by Type
- 6.4.4.4.3. Market size and forecast, by End User
- 6.4.4.5. South Korea
- 6.4.4.5.1. Key market trends, growth factors and opportunities
- 6.4.4.5.2. Market size and forecast, by Type
- 6.4.4.5.3. Market size and forecast, by End User
- 6.4.4.6. Rest of Asia-Pacific
- 6.4.4.6.1. Key market trends, growth factors and opportunities
- 6.4.4.6.2. Market size and forecast, by Type
- 6.4.4.6.3. Market size and forecast, by End User
- 6.5. LAMEA
- 6.5.1. Key trends and opportunities
- 6.5.2. Market size and forecast, by Type
- 6.5.3. Market size and forecast, by End User
- 6.5.4. Market size and forecast, by country
- 6.5.4.1. Brazil
- 6.5.4.1.1. Key market trends, growth factors and opportunities
- 6.5.4.1.2. Market size and forecast, by Type
- 6.5.4.1.3. Market size and forecast, by End User
- 6.5.4.2. Saudi Arabia
- 6.5.4.2.1. Key market trends, growth factors and opportunities
- 6.5.4.2.2. Market size and forecast, by Type
- 6.5.4.2.3. Market size and forecast, by End User
- 6.5.4.3. South Africa
- 6.5.4.3.1. Key market trends, growth factors and opportunities
- 6.5.4.3.2. Market size and forecast, by Type
- 6.5.4.3.3. Market size and forecast, by End User
- 6.5.4.4. UAE
- 6.5.4.4.1. Key market trends, growth factors and opportunities
- 6.5.4.4.2. Market size and forecast, by Type
- 6.5.4.4.3. Market size and forecast, by End User
- 6.5.4.5. Argentina
- 6.5.4.5.1. Key market trends, growth factors and opportunities
- 6.5.4.5.2. Market size and forecast, by Type
- 6.5.4.5.3. Market size and forecast, by End User
- 6.5.4.6. Rest of LAMEA
- 6.5.4.6.1. Key market trends, growth factors and opportunities
- 6.5.4.6.2. Market size and forecast, by Type
- 6.5.4.6.3. Market size and forecast, by End User
CHAPTER 7: COMPETITIVE LANDSCAPE
- 7.1. Introduction
- 7.2. Top winning strategies
- 7.3. Product Mapping of Top 10 Player
- 7.4. Competitive Dashboard
- 7.5. Competitive Heatmap
- 7.6. Top player positioning, 2022
CHAPTER 8: COMPANY PROFILES
- 8.1. Breakout Operations, LLC
- 8.1.1. Company overview
- 8.1.2. Key Executives
- 8.1.3. Company snapshot
- 8.1.4. Operating business segments
- 8.1.5. Product portfolio
- 8.2. All In Adventures, LLC
- 8.2.1. Company overview
- 8.2.2. Key Executives
- 8.2.3. Company snapshot
- 8.2.4. Operating business segments
- 8.2.5. Product portfolio
- 8.3. Escapology LLC
- 8.3.1. Company overview
- 8.3.2. Key Executives
- 8.3.3. Company snapshot
- 8.3.4. Operating business segments
- 8.3.5. Product portfolio
- 8.3.6. Key strategic moves and developments
- 8.4. Escape The Room
- 8.4.1. Company overview
- 8.4.2. Key Executives
- 8.4.3. Company snapshot
- 8.4.4. Operating business segments
- 8.4.5. Product portfolio
- 8.5. The Great Escape Room
- 8.5.1. Company overview
- 8.5.2. Key Executives
- 8.5.3. Company snapshot
- 8.5.4. Operating business segments
- 8.5.5. Product portfolio
- 8.6. Paniq Entertainment LLC
- 8.6.1. Company overview
- 8.6.2. Key Executives
- 8.6.3. Company snapshot
- 8.6.4. Operating business segments
- 8.6.5. Product portfolio
- 8.6.6. Key strategic moves and developments
- 8.7. Epic Escape Game
- 8.7.1. Company overview
- 8.7.2. Key Executives
- 8.7.3. Company snapshot
- 8.7.4. Operating business segments
- 8.7.5. Product portfolio
- 8.8. Great Room Escape
- 8.8.1. Company overview
- 8.8.2. Key Executives
- 8.8.3. Company snapshot
- 8.8.4. Operating business segments
- 8.8.5. Product portfolio
- 8.9. Maze Rooms Corp.
- 8.9.1. Company overview
- 8.9.2. Key Executives
- 8.9.3. Company snapshot
- 8.9.4. Operating business segments
- 8.9.5. Product portfolio
- 8.10. The Escape Game, LLC
- 8.10.1. Company overview
- 8.10.2. Key Executives
- 8.10.3. Company snapshot
- 8.10.4. Operating business segments
- 8.10.5. Product portfolio
- 8.10.6. Key strategic moves and developments
- 8.11. Amazing Escape Room, LLC
- 8.11.1. Company overview
- 8.11.2. Key Executives
- 8.11.3. Company snapshot
- 8.11.4. Operating business segments
- 8.11.5. Product portfolio
- 8.12. 60 Out Escape Rooms
- 8.12.1. Company overview
- 8.12.2. Key Executives
- 8.12.3. Company snapshot
- 8.12.4. Operating business segments
- 8.12.5. Product portfolio
- 8.13. Texas Panic Room
- 8.13.1. Company overview
- 8.13.2. Key Executives
- 8.13.3. Company snapshot
- 8.13.4. Operating business segments
- 8.13.5. Product portfolio
- 8.14. Puzzle Effect
- 8.14.1. Company overview
- 8.14.2. Key Executives
- 8.14.3. Company snapshot
- 8.14.4. Operating business segments
- 8.14.5. Product portfolio
- 8.14.6. Key strategic moves and developments
- 8.15. XP Factory Plc
- 8.15.1. Company overview
- 8.15.2. Key Executives
- 8.15.3. Company snapshot
- 8.15.4. Operating business segments
- 8.15.5. Product portfolio
- 8.15.6. Business performance
- 8.15.7. Key strategic moves and developments