|
|
市場調査レポート
商品コード
1344322
ESCO(Energy Service Company)市場:顧客タイプ別:世界の機会分析と産業予測、2023年~2032年Electric Service Companies (ESCOs) Market By Customer Type (Residential, Commercial, Industrial): Global Opportunity Analysis and Industry Forecast, 2023-2032 |
||||||
|
|
|||||||
|
|||||||


| ESCO(Energy Service Company)市場:顧客タイプ別:世界の機会分析と産業予測、2023年~2032年 |
|
出版日: 2023年06月01日
発行: Allied Market Research
ページ情報: 英文 191 Pages
納期: 2~3営業日
|

- 全表示
- 概要
- 図表
- 目次
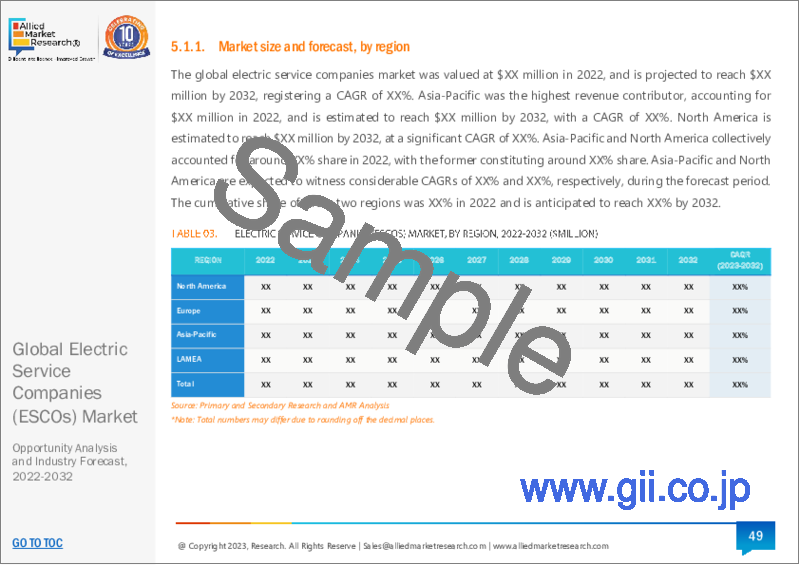
ESCO(Energy Service Company)市場は2022年に302億米ドルと評価され、2023年から2032年にかけてCAGR 7.2%で成長し、2032年には598億米ドルに達すると予測されています。

ESCO(Energy Service Company)とは、電気サービスや省エネサービスの設計、開発、提供に従事する事業体を指します。本レポートは、特に市場の現在の動向と将来の潜在的成長機会を中心に取り上げています。住宅、商業、産業といった様々な顧客セグメントを掘り下げ、各カテゴリーに関する包括的な洞察を提供しています。また、北米、欧州、アジア太平洋、ラテンアメリカ・中東・アフリカなど、さまざまな地域におけるESCOの現在の市場動向についても検証しています。さらに、政府の規制と政策を分析することで、将来の成長機会を示唆しており、ひいてはESCOの消費者受容を高めることができます。商業セクターはESCOプロジェクトにおいて重要なプレーヤーであり、主に大規模な公共開発プロジェクトやインフラ活動に従事する顧客が関与しています。しかし、パンデミック時には、商業部門は大きな課題に直面しました。封鎖措置により、企業は生き残りと固定費対策に注力し、さらなる開発計画の推進を断念しました。その結果、商業セクターのESCOプロジェクトは延期または中止され、市場の抑制要因となっています。
しかし、経済が徐々に再開・回復するにつれて、商業部門は前向きな成長を見せており、これがESCO市場の推進力となっています。商業施設は、その運営上の需要を効果的に満たすために、より高度な電気サポートを必要とします。多くの商業施設では現在、事業戦略の一環として照明や電気システムの改修やアップグレードが行われています。こうした改修やアップグレードの目的は、エネルギーコストの節約と二酸化炭素排出量の削減であり、持続可能性の目標に沿ったものです。景気回復、商業ビルの電気インフラ改善の必要性、省エネイニシアチブの増加といった複合的要因が、ESCO市場の商業セグメントの成長にプラスに働くと予想されます。企業が効率性と持続可能性を追求する中で、ESCOはエネルギー関連の目標達成を支援する上で重要な役割を果たしています。
欧州では、ドイツ、イタリア、フランス、スペインなどの国々で、温室効果ガスの排出を削減し、全体的なエネルギー性能を向上させることで、個人やグループのエネルギー消費を最適化するためのさまざまなエネルギーサービスやソリューションを提供するESCOの存在が確立されています。住宅分野では、欧州の重要な側面であるエネルギー効率の高い冷暖房システムの設置を通じて、住宅の断熱サービスを提供しています。イタリアにおけるESCO市場の成長は、エネルギー効率を促進する政府の取り組みや政策によって牽引されています。ESCOは、エネルギーサービスを提供し、エネルギー効率を促進し、顧客のエネルギー消費量と二酸化炭素排出量の削減を支援することで、低炭素経済への移行に貢献しています。ESCOは、国や欧州のエネルギー・気候目標を達成する上で重要な役割を担っています。ESCOはさらに、ソーラーパネルやヒートポンプなどの再生可能エネルギーソリューションを提供し、エネルギーの無駄を省き、光熱費を削減し、より快適な住環境を実現するために住宅所有者を支援しています。
目次
第1章 イントロダクション
第2章 エグゼクティブサマリー
第3章 市場概要
- 市場の定義と範囲
- 主な調査結果
- 影響要因
- 主な投資機会
- ポーターのファイブフォース分析
- 市場力学
- 促進要因
- サービスの認知度と証明された優位性
- 市場成長を後押しする政府の政策
- 技術の進歩
- 抑制要因
- 法的枠組みがないことによる信頼の低さ
- 機会
- 研修の実施と熟練労働力の構築
- 促進要因
- COVID-19:市場への影響分析
- 規制ガイドライン
- 特許情勢
- バリューチェーン分析
第4章 ESCO(Energy Service Company)市場:顧客タイプ別
- 概要
- 住宅
- 商業
- 工業
第5章 ESCO(Energy Service Company)市場:地域別
- 概要
- 北米
- 米国
- カナダ
- メキシコ
- 欧州
- ドイツ
- 英国
- フランス
- イタリア
- スペイン
- その他欧州
- アジア太平洋
- 中国
- 日本
- インド
- 韓国
- オーストラリア
- その他アジア太平洋地域
- ラテンアメリカ・中東・アフリカ
- ブラジル
- サウジアラビア
- 南アフリカ
- その他ラテンアメリカ・中東・アフリカ
第6章 競合情勢
- イントロダクション
- 主要成功戦略
- 主要10社の製品マッピング
- 競合ダッシュボード
- 競合ヒートマップ
- 主要企業のポジショニング、2022年
第7章 企業プロファイル
- Alpiq Holding Ltd.
- Eaton Corporation
- Enel X S.r.l.
- General Electric
- Honeywell International Inc.
- Johnson Controls International
- Orsted A/S
- Schneider Electric SE.
- Siemens
- Veolia Environment S.A.
LIST OF TABLES
- TABLE 01. GLOBAL ELECTRIC SERVICE COMPANIES (ESCOS) MARKET, BY CUSTOMER TYPE, 2022-2032 ($MILLION)
- TABLE 02. ELECTRIC SERVICE COMPANIES (ESCOS) MARKET FOR RESIDENTIAL, BY REGION, 2022-2032 ($MILLION)
- TABLE 03. ELECTRIC SERVICE COMPANIES (ESCOS) MARKET FOR COMMERCIAL, BY REGION, 2022-2032 ($MILLION)
- TABLE 04. ELECTRIC SERVICE COMPANIES (ESCOS) MARKET FOR INDUSTRIAL, BY REGION, 2022-2032 ($MILLION)
- TABLE 05. ELECTRIC SERVICE COMPANIES (ESCOS) MARKET, BY REGION, 2022-2032 ($MILLION)
- TABLE 06. NORTH AMERICA ELECTRIC SERVICE COMPANIES (ESCOS) MARKET, BY CUSTOMER TYPE, 2022-2032 ($MILLION)
- TABLE 07. NORTH AMERICA ELECTRIC SERVICE COMPANIES (ESCOS) MARKET, BY COUNTRY, 2022-2032 ($MILLION)
- TABLE 08. U.S. ELECTRIC SERVICE COMPANIES (ESCOS) MARKET, BY CUSTOMER TYPE, 2022-2032 ($MILLION)
- TABLE 09. CANADA ELECTRIC SERVICE COMPANIES (ESCOS) MARKET, BY CUSTOMER TYPE, 2022-2032 ($MILLION)
- TABLE 10. MEXICO ELECTRIC SERVICE COMPANIES (ESCOS) MARKET, BY CUSTOMER TYPE, 2022-2032 ($MILLION)
- TABLE 11. EUROPE ELECTRIC SERVICE COMPANIES (ESCOS) MARKET, BY CUSTOMER TYPE, 2022-2032 ($MILLION)
- TABLE 12. EUROPE ELECTRIC SERVICE COMPANIES (ESCOS) MARKET, BY COUNTRY, 2022-2032 ($MILLION)
- TABLE 13. GERMANY ELECTRIC SERVICE COMPANIES (ESCOS) MARKET, BY CUSTOMER TYPE, 2022-2032 ($MILLION)
- TABLE 14. UK ELECTRIC SERVICE COMPANIES (ESCOS) MARKET, BY CUSTOMER TYPE, 2022-2032 ($MILLION)
- TABLE 15. FRANCE ELECTRIC SERVICE COMPANIES (ESCOS) MARKET, BY CUSTOMER TYPE, 2022-2032 ($MILLION)
- TABLE 16. ITALY ELECTRIC SERVICE COMPANIES (ESCOS) MARKET, BY CUSTOMER TYPE, 2022-2032 ($MILLION)
- TABLE 17. SPAIN ELECTRIC SERVICE COMPANIES (ESCOS) MARKET, BY CUSTOMER TYPE, 2022-2032 ($MILLION)
- TABLE 18. REST OF EUROPE ELECTRIC SERVICE COMPANIES (ESCOS) MARKET, BY CUSTOMER TYPE, 2022-2032 ($MILLION)
- TABLE 19. ASIA-PACIFIC ELECTRIC SERVICE COMPANIES (ESCOS) MARKET, BY CUSTOMER TYPE, 2022-2032 ($MILLION)
- TABLE 20. ASIA-PACIFIC ELECTRIC SERVICE COMPANIES (ESCOS) MARKET, BY COUNTRY, 2022-2032 ($MILLION)
- TABLE 21. CHINA ELECTRIC SERVICE COMPANIES (ESCOS) MARKET, BY CUSTOMER TYPE, 2022-2032 ($MILLION)
- TABLE 22. JAPAN ELECTRIC SERVICE COMPANIES (ESCOS) MARKET, BY CUSTOMER TYPE, 2022-2032 ($MILLION)
- TABLE 23. INDIA ELECTRIC SERVICE COMPANIES (ESCOS) MARKET, BY CUSTOMER TYPE, 2022-2032 ($MILLION)
- TABLE 24. SOUTH KOREA ELECTRIC SERVICE COMPANIES (ESCOS) MARKET, BY CUSTOMER TYPE, 2022-2032 ($MILLION)
- TABLE 25. AUSTRALIA ELECTRIC SERVICE COMPANIES (ESCOS) MARKET, BY CUSTOMER TYPE, 2022-2032 ($MILLION)
- TABLE 26. REST OF ASIA-PACIFIC ELECTRIC SERVICE COMPANIES (ESCOS) MARKET, BY CUSTOMER TYPE, 2022-2032 ($MILLION)
- TABLE 27. LAMEA ELECTRIC SERVICE COMPANIES (ESCOS) MARKET, BY CUSTOMER TYPE, 2022-2032 ($MILLION)
- TABLE 28. LAMEA ELECTRIC SERVICE COMPANIES (ESCOS) MARKET, BY COUNTRY, 2022-2032 ($MILLION)
- TABLE 29. BRAZIL ELECTRIC SERVICE COMPANIES (ESCOS) MARKET, BY CUSTOMER TYPE, 2022-2032 ($MILLION)
- TABLE 30. SAUDI ARABIA ELECTRIC SERVICE COMPANIES (ESCOS) MARKET, BY CUSTOMER TYPE, 2022-2032 ($MILLION)
- TABLE 31. SOUTH AFRICA ELECTRIC SERVICE COMPANIES (ESCOS) MARKET, BY CUSTOMER TYPE, 2022-2032 ($MILLION)
- TABLE 32. REST OF LAMEA ELECTRIC SERVICE COMPANIES (ESCOS) MARKET, BY CUSTOMER TYPE, 2022-2032 ($MILLION)
- TABLE 33. ALPIQ HOLDING LTD.: KEY EXECUTIVES
- TABLE 34. ALPIQ HOLDING LTD.: COMPANY SNAPSHOT
- TABLE 35. ALPIQ HOLDING LTD.: PRODUCT SEGMENTS
- TABLE 36. ALPIQ HOLDING LTD.: PRODUCT PORTFOLIO
- TABLE 37. EATON CORPORATION: KEY EXECUTIVES
- TABLE 38. EATON CORPORATION: COMPANY SNAPSHOT
- TABLE 39. EATON CORPORATION: PRODUCT SEGMENTS
- TABLE 40. EATON CORPORATION: PRODUCT PORTFOLIO
- TABLE 41. EATON CORPORATION: KEY STRATERGIES
- TABLE 42. ENEL X S.R.L.: KEY EXECUTIVES
- TABLE 43. ENEL X S.R.L.: COMPANY SNAPSHOT
- TABLE 44. ENEL X S.R.L.: SERVICE SEGMENTS
- TABLE 45. ENEL X S.R.L.: PRODUCT PORTFOLIO
- TABLE 46. GENERAL ELECTRIC: KEY EXECUTIVES
- TABLE 47. GENERAL ELECTRIC: COMPANY SNAPSHOT
- TABLE 48. GENERAL ELECTRIC: SERVICE SEGMENTS
- TABLE 49. GENERAL ELECTRIC: PRODUCT PORTFOLIO
- TABLE 50. HONEYWELL INTERNATIONAL INC.: KEY EXECUTIVES
- TABLE 51. HONEYWELL INTERNATIONAL INC.: COMPANY SNAPSHOT
- TABLE 52. HONEYWELL INTERNATIONAL INC.: PRODUCT SEGMENTS
- TABLE 53. HONEYWELL INTERNATIONAL INC.: PRODUCT PORTFOLIO
- TABLE 54. HONEYWELL INTERNATIONAL INC.: KEY STRATERGIES
- TABLE 55. JOHNSON CONTROLS INTERNATIONAL: KEY EXECUTIVES
- TABLE 56. JOHNSON CONTROLS INTERNATIONAL: COMPANY SNAPSHOT
- TABLE 57. JOHNSON CONTROLS INTERNATIONAL: SERVICE SEGMENTS
- TABLE 58. JOHNSON CONTROLS INTERNATIONAL: PRODUCT PORTFOLIO
- TABLE 59. JOHNSON CONTROLS INTERNATIONAL: KEY STRATERGIES
- TABLE 60. ORSTED A/S: KEY EXECUTIVES
- TABLE 61. ORSTED A/S: COMPANY SNAPSHOT
- TABLE 62. ORSTED A/S: SERVICE SEGMENTS
- TABLE 63. ORSTED A/S: PRODUCT PORTFOLIO
- TABLE 64. SCHNEIDER ELECTRIC SE.: KEY EXECUTIVES
- TABLE 65. SCHNEIDER ELECTRIC SE.: COMPANY SNAPSHOT
- TABLE 66. SCHNEIDER ELECTRIC SE.: PRODUCT SEGMENTS
- TABLE 67. SCHNEIDER ELECTRIC SE.: PRODUCT PORTFOLIO
- TABLE 68. SIEMENS: KEY EXECUTIVES
- TABLE 69. SIEMENS: COMPANY SNAPSHOT
- TABLE 70. SIEMENS: PRODUCT SEGMENTS
- TABLE 71. SIEMENS: PRODUCT PORTFOLIO
- TABLE 72. SIEMENS: KEY STRATERGIES
- TABLE 73. VEOLIA ENVIRONMENT S.A.: KEY EXECUTIVES
- TABLE 74. VEOLIA ENVIRONMENT S.A.: COMPANY SNAPSHOT
- TABLE 75. VEOLIA ENVIRONMENT S.A.: PRODUCT SEGMENTS
- TABLE 76. VEOLIA ENVIRONMENT S.A.: PRODUCT PORTFOLIO
LIST OF FIGURES
- FIGURE 01. ELECTRIC SERVICE COMPANIES (ESCOS) MARKET, 2022-2032
- FIGURE 02. SEGMENTATION OF ELECTRIC SERVICE COMPANIES (ESCOS) MARKET, 2022-2032
- FIGURE 03. TOP INVESTMENT POCKETS IN ELECTRIC SERVICE COMPANIES (ESCOS) MARKET (2023-2032)
- FIGURE 04. LOW BARGAINING POWER OF SUPPLIERS
- FIGURE 05. LOW THREAT OF NEW ENTRANTS
- FIGURE 06. LOW THREAT OF SUBSTITUTES
- FIGURE 07. LOW INTENSITY OF RIVALRY
- FIGURE 08. LOW BARGAINING POWER OF BUYERS
- FIGURE 09. DRIVERS, RESTRAINTS AND OPPORTUNITIES: GLOBALELECTRIC SERVICE COMPANIES (ESCOS) MARKET
- FIGURE 10. REGULATORY GUIDELINES: ELECTRIC SERVICE COMPANIES (ESCOS) MARKET
- FIGURE 11. PATENT ANALYSIS BY COMPANY
- FIGURE 12. PATENT ANALYSIS BY COUNTRY
- FIGURE 12. ELECTRIC SERVICE COMPANIES (ESCOS) MARKET, BY CUSTOMER TYPE, 2022(%)
- FIGURE 13. COMPARATIVE SHARE ANALYSIS OF ELECTRIC SERVICE COMPANIES (ESCOS) MARKET FOR RESIDENTIAL, BY COUNTRY 2022 AND 2032(%)
- FIGURE 14. COMPARATIVE SHARE ANALYSIS OF ELECTRIC SERVICE COMPANIES (ESCOS) MARKET FOR COMMERCIAL, BY COUNTRY 2022 AND 2032(%)
- FIGURE 15. COMPARATIVE SHARE ANALYSIS OF ELECTRIC SERVICE COMPANIES (ESCOS) MARKET FOR INDUSTRIAL, BY COUNTRY 2022 AND 2032(%)
- FIGURE 16. ELECTRIC SERVICE COMPANIES (ESCOS) MARKET BY REGION, 2022
- FIGURE 17. U.S. ELECTRIC SERVICE COMPANIES (ESCOS) MARKET, 2022-2032 ($MILLION)
- FIGURE 18. CANADA ELECTRIC SERVICE COMPANIES (ESCOS) MARKET, 2022-2032 ($MILLION)
- FIGURE 19. MEXICO ELECTRIC SERVICE COMPANIES (ESCOS) MARKET, 2022-2032 ($MILLION)
- FIGURE 20. GERMANY ELECTRIC SERVICE COMPANIES (ESCOS) MARKET, 2022-2032 ($MILLION)
- FIGURE 21. UK ELECTRIC SERVICE COMPANIES (ESCOS) MARKET, 2022-2032 ($MILLION)
- FIGURE 22. FRANCE ELECTRIC SERVICE COMPANIES (ESCOS) MARKET, 2022-2032 ($MILLION)
- FIGURE 23. ITALY ELECTRIC SERVICE COMPANIES (ESCOS) MARKET, 2022-2032 ($MILLION)
- FIGURE 24. SPAIN ELECTRIC SERVICE COMPANIES (ESCOS) MARKET, 2022-2032 ($MILLION)
- FIGURE 25. REST OF EUROPE ELECTRIC SERVICE COMPANIES (ESCOS) MARKET, 2022-2032 ($MILLION)
- FIGURE 26. CHINA ELECTRIC SERVICE COMPANIES (ESCOS) MARKET, 2022-2032 ($MILLION)
- FIGURE 27. JAPAN ELECTRIC SERVICE COMPANIES (ESCOS) MARKET, 2022-2032 ($MILLION)
- FIGURE 28. INDIA ELECTRIC SERVICE COMPANIES (ESCOS) MARKET, 2022-2032 ($MILLION)
- FIGURE 29. SOUTH KOREA ELECTRIC SERVICE COMPANIES (ESCOS) MARKET, 2022-2032 ($MILLION)
- FIGURE 30. AUSTRALIA ELECTRIC SERVICE COMPANIES (ESCOS) MARKET, 2022-2032 ($MILLION)
- FIGURE 31. REST OF ASIA-PACIFIC ELECTRIC SERVICE COMPANIES (ESCOS) MARKET, 2022-2032 ($MILLION)
- FIGURE 32. BRAZIL ELECTRIC SERVICE COMPANIES (ESCOS) MARKET, 2022-2032 ($MILLION)
- FIGURE 33. SAUDI ARABIA ELECTRIC SERVICE COMPANIES (ESCOS) MARKET, 2022-2032 ($MILLION)
- FIGURE 34. SOUTH AFRICA ELECTRIC SERVICE COMPANIES (ESCOS) MARKET, 2022-2032 ($MILLION)
- FIGURE 35. REST OF LAMEA ELECTRIC SERVICE COMPANIES (ESCOS) MARKET, 2022-2032 ($MILLION)
- FIGURE 36. TOP WINNING STRATEGIES, BY YEAR
- FIGURE 37. TOP WINNING STRATEGIES, BY DEVELOPMENT
- FIGURE 38. TOP WINNING STRATEGIES, BY COMPANY
- FIGURE 39. PRODUCT MAPPING OF TOP 10 PLAYERS
- FIGURE 40. COMPETITIVE DASHBOARD
- FIGURE 41. COMPETITIVE HEATMAP: ELECTRIC SERVICE COMPANIES (ESCOS) MARKET
- FIGURE 42. TOP PLAYER POSITIONING, 2022
- FIGURE 43. ALPIQ HOLDING LTD.: NET REVENUE, 2020-2022 ($MILLION)
- FIGURE 44. EATON CORPORATION: NET SALES, 2020-2022 ($MILLION)
- FIGURE 45. EATON CORPORATION: RESEARCH & DEVELOPMENT EXPENDITURE, 2020-2022 ($MILLION)
- FIGURE 46. EATON CORPORATION: REVENUE SHARE BY REGION, 2021 (%)
- FIGURE 47. EATON CORPORATION: REVENUE SHARE BY SEGMENT, 2021 (%)
- FIGURE 48. GENERAL ELECTRIC: NET REVENUE, 2020-2022 ($MILLION)
- FIGURE 49. GENERAL ELECTRIC: REVENUE SHARE BY SEGMENT, 2022 (%)
- FIGURE 50. GENERAL ELECTRIC: REVENUE SHARE BY REGION, 2022 (%)
- FIGURE 51. HONEYWELL INTERNATIONAL INC.: RESEARCH & DEVELOPMENT EXPENDITURE, 2020-2022 ($MILLION)
- FIGURE 52. HONEYWELL INTERNATIONAL INC.: NET SALES, 2020-2022 ($MILLION)
- FIGURE 53. HONEYWELL INTERNATIONAL INC.: REVENUE SHARE BY SEGMENT, 2022 (%)
- FIGURE 54. HONEYWELL INTERNATIONAL INC.: REVENUE SHARE BY REGION, 2021 (%)
- FIGURE 55. JOHNSON CONTROLS INTERNATIONAL: NET SALES, 2020-2022 ($BILLION)
- FIGURE 56. JOHNSON CONTROLS INTERNATIONAL: REVENUE SHARE BY REGION, 2022 (%)
- FIGURE 57. JOHNSON CONTROLS INTERNATIONAL: REVENUE SHARE BY REGION, 2022 (%)
- FIGURE 58. ORSTED A/S: NET REVENUE, 2020-2022 ($MILLION)
- FIGURE 59. ORSTED A/S: REVENUE SHARE BY SEGMENT, 2022 (%)
- FIGURE 60. SCHNEIDER ELECTRIC SE.: NET REVENUE, 2020-2022 ($MILLION)
- FIGURE 61. SCHNEIDER ELECTRIC SE.: RESEARCH & DEVELOPMENT EXPENDITURE, 2020-2022 ($MILLION)
- FIGURE 62. SCHNEIDER ELECTRIC SE.: REVENUE SHARE BY SEGMENT, 2022 (%)
- FIGURE 63. SCHNEIDER ELECTRIC SE.: REVENUE SHARE BY REGION, 2022 (%)
- FIGURE 64. SIEMENS: NET REVENUE, 2020-2022 ($MILLION)
- FIGURE 65. SIEMENS: REVENUE SHARE BY SEGMENT, 2022 (%)
- FIGURE 66. SIEMENS: REVENUE SHARE BY REGION, 2022 (%)
- FIGURE 67. VEOLIA ENVIRONMENT S.A.: NET REVENUE, 2020-2022 ($MILLION)
According to a new report published by Allied Market Research, titled, "Electric Service Companies (ESCOs) Market," The electric service companies (ESCOs) market was valued at $30.2 billion in 2022 and is estimated to reach $59.8 billion by 2032, growing at a CAGR of 7.2% from 2023 to 2032.
Electric service companies (ESCOs) refer to entities that engage in the design, development, and provision of electric services or energy-saving services. The market report specifically centers around the present trends in the market as well as the potential growth opportunities in the future. The report delves into various customer segments, namely residential, commercial, and industrial, providing comprehensive insights into each category. In addition, it examines the current market trends of ESCOs across different regions, including North America, Europe, Asia-Pacific, and LAMEA. Furthermore, the report suggests future growth opportunities by analyzing government regulations and policies, which, in turn, can enhance consumer acceptance of ESCOs. The commercial sector has been a significant player in ESCO projects, mainly involving clients engaged in major public development projects and infrastructure activities. However, during the pandemic, the commercial sector faced significant challenges. Lockdown measures discouraged businesses from pursuing further development plans as they focused on survival and meet fixed costs. Consequently, ESCO projects in the commercial sector were delayed or canceled, acting as a restraining factor for the market.
However, as economies gradually reopen and recover, the commercial segment is showing positive growth, which will act as a driving force for the ESCO market. Commercial buildings require a higher level of electrical support to effectively meet their operational demands. Many commercial properties are currently undergoing lighting and electrical system renovations or upgrades as part of their business strategies. These retrofits or upgrades aim to save energy costs and reduce carbon footprints, aligning with sustainability goals. The combined factors of recovering economies, the need for improved electrical infrastructure in commercial buildings, and an increase in energy-saving initiatives are expected to positively contribute to the growth of the commercial segment in the ESCO market. As businesses strive for efficiency and sustainability, ESCOs play a crucial role in helping them achieve their energy-related objectives.
In Europe, the countries such as Germany, Italy, France, and Spain have a well-established presence of ESCOs offering a range of energy services and solutions for optimizing individual as well as group energy consumption by reducing greenhouse gas emissions and improving overall energy performance accordingly. For the residential sector, they offer home insulation services through the installation of energy-efficient heating and cooling systems, which is an important aspect of Europe. The growth of the ESCO market in Italy is driven by government initiatives and policies promoting energy efficiency. ESCOs contribute to the transition to a low-carbon economy by providing energy services, promoting energy efficiency and helping clients reduce energy consumption and carbon emissions. They are important players in achieving national and European energy and climate targets. They further offer renewable energy solutions such as solar panels and heat pumps and, in turn, help homeowners in reducing energy waste, lowering utility bills, and creating more comfortable living environments.
In addition, they offer products and services to Commercial customers such as businesses, offices, hotels, and other commercial establishments. Implementing energy-efficient measures, optimizing building operations, and achieving sustainability targets are the regular tasks of ESCOs. For industrial customers, ESCOs offer energy optimization, improvements in manufacturing processes, and required equipment upgrades/changes. They further work with industrial facilities and large-scale industries, which are targeted to identify energy-saving opportunities, requirements for any energy management solutions, and integration of renewable energy sources. Europe has a strong focus on energy efficiency and sustainability, and ESCOs play a vital role in supporting these objectives. ESCO projects in Europe often benefit from government policies and incentives that encourage energy efficiency investments and renewable energy adoption. Multiple policies have been implemented that support ESCO business such as financial incentives, tax benefits, and supportive regulatory frameworks. Moreover, they offer services such as providing energy monitoring services, data analysis, and ongoing maintenance services.
To understand the market, drivers, restraints, and opportunities are explained in the report. The major key players operating in the industry include Schneider Electric, General Electric, Siemens, Honeywell, Johnson Controls, Orsted, Eaton Corporation, Alpiq, Enel X, and Veolia. Furthermore, the key strategies adopted by the potential market leaders include expansion, mergers, and acquisition.
The ESCO market experienced a significant impact as a result of medium- and small-scale organizations redirecting their funds toward survival and fixed expenses during the pandemic. Numerous projects that were planned came to a standstill due to the substantial initial investment required to initiate them. Consequently, companies postponed or altogether abandoned these projects. However, the economic recovery has led to reinvestments in the projects coupled with several benefits and subsidies offered by governments across the world aimed at boosting industry growth.
Key Benefits For Stakeholders
- This report provides a quantitative analysis of the market segments, current trends, estimations, and dynamics of the electric service companies (escos) market analysis from 2022 to 2032 to identify the prevailing electric service companies (escos) market opportunities.
- The market research is offered along with information related to key drivers, restraints, and opportunities.
- Porter's five forces analysis highlights the potency of buyers and suppliers to enable stakeholders make profit-oriented business decisions and strengthen their supplier-buyer network.
- In-depth analysis of the electric service companies (escos) market segmentation assists to determine the prevailing market opportunities.
- Major countries in each region are mapped according to their revenue contribution to the global market.
- Market player positioning facilitates benchmarking and provides a clear understanding of the present position of the market players.
- The report includes the analysis of the regional as well as global electric service companies (escos) market trends, key players, market segments, application areas, and market growth strategies.
Key Market Segments
By Customer Type
- Commercial
- Residential
- Industrial
By Region
- North America
- U.S.
- Canada
- Mexico
- Europe
- Germany
- UK
- France
- Italy
- Spain
- Rest of Europe
- Asia-Pacific
- China
- Japan
- India
- South Korea
- Australia
- Rest of Asia-Pacific
- LAMEA
- Brazil
- Saudi Arabia
- South Africa
- Rest of LAMEA
Key Market Players:
- Alpiq Holding Ltd.
- Eaton Corporation
- Enel X S.r.l.
- General Electric
- Honeywell International Inc.
- Johnson Controls International
- Orsted A/S
- Schneider Electric SE.
- Siemens
- Veolia Environment S.A.
TABLE OF CONTENTS
CHAPTER 1: INTRODUCTION
- 1.1. Report description
- 1.2. Key market segments
- 1.3. Key benefits to the stakeholders
- 1.4. Research Methodology
- 1.4.1. Primary research
- 1.4.2. Secondary research
- 1.4.3. Analyst tools and models
CHAPTER 2: EXECUTIVE SUMMARY
- 2.1. CXO Perspective
CHAPTER 3: MARKET OVERVIEW
- 3.1. Market definition and scope
- 3.2. Key findings
- 3.2.1. Top impacting factors
- 3.2.2. Top investment pockets
- 3.3. Porter's five forces analysis
- 3.3.1. Low bargaining power of suppliers
- 3.3.2. Low threat of new entrants
- 3.3.3. Low threat of substitutes
- 3.3.4. Low intensity of rivalry
- 3.3.5. Low bargaining power of buyers
- 3.4. Market dynamics
- 3.4.1. Drivers
- 3.4.1.1. Awareness and proven advantages of the service
- 3.4.1.2. Government policies boosting the market growth
- 3.4.1.3. Technological advancements
- 3.4.1. Drivers
- 3.4.2. Restraints
- 3.4.2.1. Low trust due to the absence of legislative framework
- 3.4.3. Opportunities
- 3.4.3.1. Implementing training and building skilled workforce
- 3.5. COVID-19 Impact Analysis on the market
- 3.6. Regulatory Guidelines
- 3.7. Patent Landscape
- 3.8. Value Chain Analysis
CHAPTER 4: ELECTRIC SERVICE COMPANIES (ESCOS) MARKET, BY CUSTOMER TYPE
- 4.1. Overview
- 4.1.1. Market size and forecast
- 4.2. Residential
- 4.2.1. Key market trends, growth factors and opportunities
- 4.2.2. Market size and forecast, by region
- 4.2.3. Market share analysis by country
- 4.3. Commercial
- 4.3.1. Key market trends, growth factors and opportunities
- 4.3.2. Market size and forecast, by region
- 4.3.3. Market share analysis by country
- 4.4. Industrial
- 4.4.1. Key market trends, growth factors and opportunities
- 4.4.2. Market size and forecast, by region
- 4.4.3. Market share analysis by country
CHAPTER 5: ELECTRIC SERVICE COMPANIES (ESCOS) MARKET, BY REGION
- 5.1. Overview
- 5.1.1. Market size and forecast By Region
- 5.2. North America
- 5.2.1. Key trends and opportunities
- 5.2.2. Market size and forecast, by Customer Type
- 5.2.3. Market size and forecast, by country
- 5.2.3.1. U.S.
- 5.2.3.1.1. Key market trends, growth factors and opportunities
- 5.2.3.1.2. Market size and forecast, by Customer Type
- 5.2.3.2. Canada
- 5.2.3.2.1. Key market trends, growth factors and opportunities
- 5.2.3.2.2. Market size and forecast, by Customer Type
- 5.2.3.3. Mexico
- 5.2.3.3.1. Key market trends, growth factors and opportunities
- 5.2.3.3.2. Market size and forecast, by Customer Type
- 5.3. Europe
- 5.3.1. Key trends and opportunities
- 5.3.2. Market size and forecast, by Customer Type
- 5.3.3. Market size and forecast, by country
- 5.3.3.1. Germany
- 5.3.3.1.1. Key market trends, growth factors and opportunities
- 5.3.3.1.2. Market size and forecast, by Customer Type
- 5.3.3.2. UK
- 5.3.3.2.1. Key market trends, growth factors and opportunities
- 5.3.3.2.2. Market size and forecast, by Customer Type
- 5.3.3.3. France
- 5.3.3.3.1. Key market trends, growth factors and opportunities
- 5.3.3.3.2. Market size and forecast, by Customer Type
- 5.3.3.4. Italy
- 5.3.3.4.1. Key market trends, growth factors and opportunities
- 5.3.3.4.2. Market size and forecast, by Customer Type
- 5.3.3.5. Spain
- 5.3.3.5.1. Key market trends, growth factors and opportunities
- 5.3.3.5.2. Market size and forecast, by Customer Type
- 5.3.3.6. Rest of Europe
- 5.3.3.6.1. Key market trends, growth factors and opportunities
- 5.3.3.6.2. Market size and forecast, by Customer Type
- 5.4. Asia-Pacific
- 5.4.1. Key trends and opportunities
- 5.4.2. Market size and forecast, by Customer Type
- 5.4.3. Market size and forecast, by country
- 5.4.3.1. China
- 5.4.3.1.1. Key market trends, growth factors and opportunities
- 5.4.3.1.2. Market size and forecast, by Customer Type
- 5.4.3.2. Japan
- 5.4.3.2.1. Key market trends, growth factors and opportunities
- 5.4.3.2.2. Market size and forecast, by Customer Type
- 5.4.3.3. India
- 5.4.3.3.1. Key market trends, growth factors and opportunities
- 5.4.3.3.2. Market size and forecast, by Customer Type
- 5.4.3.4. South Korea
- 5.4.3.4.1. Key market trends, growth factors and opportunities
- 5.4.3.4.2. Market size and forecast, by Customer Type
- 5.4.3.5. Australia
- 5.4.3.5.1. Key market trends, growth factors and opportunities
- 5.4.3.5.2. Market size and forecast, by Customer Type
- 5.4.3.6. Rest of Asia-Pacific
- 5.4.3.6.1. Key market trends, growth factors and opportunities
- 5.4.3.6.2. Market size and forecast, by Customer Type
- 5.5. LAMEA
- 5.5.1. Key trends and opportunities
- 5.5.2. Market size and forecast, by Customer Type
- 5.5.3. Market size and forecast, by country
- 5.5.3.1. Brazil
- 5.5.3.1.1. Key market trends, growth factors and opportunities
- 5.5.3.1.2. Market size and forecast, by Customer Type
- 5.5.3.2. Saudi Arabia
- 5.5.3.2.1. Key market trends, growth factors and opportunities
- 5.5.3.2.2. Market size and forecast, by Customer Type
- 5.5.3.3. South Africa
- 5.5.3.3.1. Key market trends, growth factors and opportunities
- 5.5.3.3.2. Market size and forecast, by Customer Type
- 5.5.3.4. Rest of LAMEA
- 5.5.3.4.1. Key market trends, growth factors and opportunities
- 5.5.3.4.2. Market size and forecast, by Customer Type
CHAPTER 6: COMPETITIVE LANDSCAPE
- 6.1. Introduction
- 6.2. Top winning strategies
- 6.3. Product Mapping of Top 10 Player
- 6.4. Competitive Dashboard
- 6.5. Competitive Heatmap
- 6.6. Top player positioning, 2022
CHAPTER 7: COMPANY PROFILES
- 7.1. Alpiq Holding Ltd.
- 7.1.1. Company overview
- 7.1.2. Key Executives
- 7.1.3. Company snapshot
- 7.1.4. Operating business segments
- 7.1.5. Product portfolio
- 7.1.6. Business performance
- 7.2. Eaton Corporation
- 7.2.1. Company overview
- 7.2.2. Key Executives
- 7.2.3. Company snapshot
- 7.2.4. Operating business segments
- 7.2.5. Product portfolio
- 7.2.6. Business performance
- 7.2.7. Key strategic moves and developments
- 7.3. Enel X S.r.l.
- 7.3.1. Company overview
- 7.3.2. Key Executives
- 7.3.3. Company snapshot
- 7.3.4. Operating business segments
- 7.3.5. Product portfolio
- 7.4. General Electric
- 7.4.1. Company overview
- 7.4.2. Key Executives
- 7.4.3. Company snapshot
- 7.4.4. Operating business segments
- 7.4.5. Product portfolio
- 7.4.6. Business performance
- 7.5. Honeywell International Inc.
- 7.5.1. Company overview
- 7.5.2. Key Executives
- 7.5.3. Company snapshot
- 7.5.4. Operating business segments
- 7.5.5. Product portfolio
- 7.5.6. Business performance
- 7.5.7. Key strategic moves and developments
- 7.6. Johnson Controls International
- 7.6.1. Company overview
- 7.6.2. Key Executives
- 7.6.3. Company snapshot
- 7.6.4. Operating business segments
- 7.6.5. Product portfolio
- 7.6.6. Business performance
- 7.6.7. Key strategic moves and developments
- 7.7. Orsted A/S
- 7.7.1. Company overview
- 7.7.2. Key Executives
- 7.7.3. Company snapshot
- 7.7.4. Operating business segments
- 7.7.5. Product portfolio
- 7.7.6. Business performance
- 7.8. Schneider Electric SE.
- 7.8.1. Company overview
- 7.8.2. Key Executives
- 7.8.3. Company snapshot
- 7.8.4. Operating business segments
- 7.8.5. Product portfolio
- 7.8.6. Business performance
- 7.9. Siemens
- 7.9.1. Company overview
- 7.9.2. Key Executives
- 7.9.3. Company snapshot
- 7.9.4. Operating business segments
- 7.9.5. Product portfolio
- 7.9.6. Business performance
- 7.9.7. Key strategic moves and developments
- 7.10. Veolia Environment S.A.
- 7.10.1. Company overview
- 7.10.2. Key Executives
- 7.10.3. Company snapshot
- 7.10.4. Operating business segments
- 7.10.5. Product portfolio
- 7.10.6. Business performance