|
|
市場調査レポート
商品コード
1344303
衛星画像データサービス市場:センシング技術別、産業別、最終用途別:世界の機会分析と産業予測、2023-2032年Satellite Image Data Services Market By Sensing Technique, By Industry, By End-Use : Global Opportunity Analysis and Industry Forecast, 2023-2032 |
||||||
|
|
|||||||


| 衛星画像データサービス市場:センシング技術別、産業別、最終用途別:世界の機会分析と産業予測、2023-2032年 |
|
出版日: 2023年06月01日
発行: Allied Market Research
ページ情報: 英文 251 Pages
納期: 2~3営業日
|
- 全表示
- 概要
- 図表
- 目次
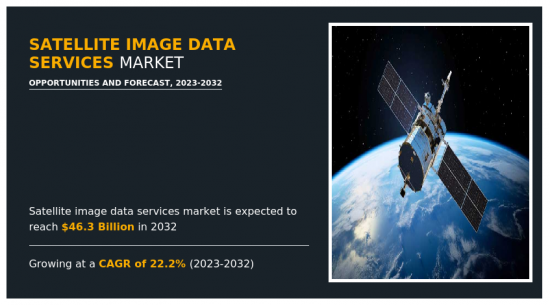
Allied Market Researchが発行した最新レポート「衛星画像データサービス市場」によると、様々な産業からの地理空間情報に対する需要の増加、地球観測衛星の需要の増加、政府の支援的イニシアティブや規制により、2023年から2032年にかけて22.2%の大幅な成長率を示すと見込まれています。
エンジニアリングとインフラ産業は、様々な業務をサポートするために衛星画像データに依存しています。衛星画像は、エンジニアリングおよびインフラストラクチャ分野におけるインフラストラクチャ・プロジェクトの計画、設計、建設、保守に不可欠です。衛星画像データは、エンジニアリングやインフラプロジェクトの効率性、正確性、持続可能性を高める。エンジニアやプランナーは、計画や設計の段階で、地形、土地被覆、既存のインフラネットワークを理解するために衛星画像データを使用します。この情報は、敷地の適合性を評価し、潜在的な制限を特定し、プロジェクトの設計を最適化するのに役立ちます。エンジニアは、衛星画像によって地形とその特徴を視覚化することで、道路、橋、建物、その他のインフラコンポーネントのレイアウトや建設について、十分な情報に基づいた決定を下すことができます。衛星画像は、建設段階における進捗状況の監視や追跡にも使用されます。建設が計画通りに進んでいることを確認し、効果的なプロジェクト管理を可能にします。例えば、2022年2月、インドのグルガオン首都圏開発局(GMDA)は、進行中のインフラ・プロジェクトを監視し、公共用地の侵入を特定するツールとして衛星画像を採用しました。衛星画像は都市の景観を包括的に把握できるため、当局はインフラ・プロジェクトの進捗状況を評価し、適時に完了させることができます。衛星画像を分析することで、当局は、現場での実際の進捗状況と提案されたスケジュールを比較し、遅れや問題に対処するために必要な措置を講じることができます。
政府部門には、政府機関、研究機関、公共部門が含まれ、都市計画、災害管理、環境監視、国家安全保障など様々な用途に衛星画像データサービスを活用しています。衛星画像データサービスは、政府部門において重要な役割を果たしており、様々な用途に貴重な情報と洞察を提供しています。政府は、土地管理、都市計画、インフラ整備、災害対応と復旧、環境監視、国家安全保障などの目的で衛星画像を活用しています。軍事分野では、潜在的脅威の監視やインテリジェンスの収集、軍事活動の追跡、敵軍の動向分析などに衛星画像が活用されています。
政府は衛星画像データを利用して、土地利用を効果的に監視・規制し、土地資源の適切な管理を確保し、土地利用政策を実施します。政府は、土地被覆の変化を特定し、無許可の侵入を正確に検出し、適切な土地利用計画措置を実施するために衛星画像データを採用します。自然災害の場合、衛星画像は被害の程度を評価し、被害を受けた地域を特定するのに役立ちます。政府は、救助活動の優先順位を決め、避難経路を確立し、救援活動を効率的に調整するためにこのデータを活用します。さらに、衛星画像データは国家安全保障において極めて重要な役割を果たし、各国政府の防衛や諜報活動に役立っています。衛星画像データは国境監視を可能にし、政府や軍が重要なインフラを監視し、潜在的な脅威を特定することを可能にします。したがって、これらの用途が政府部門における衛星画像データの需要を促進すると予想されます。
目次
第1章 イントロダクション
第2章 エグゼクティブサマリー
第3章 市場概要
- 市場の定義と範囲
- 主な調査結果
- 影響要因
- 主な投資機会
- ポーターのファイブフォース分析
- 市場力学
- 促進要因
- 様々な業界からの地理空間情報に対する需要の高まり
- 地球観測衛星の需要増加
- 政府の積極的な取り組みと規制
- 抑制要因
- 規制や法的課題
- 高コスト
- 機会
- 衛星画像データサービスにおけるAI、ML、クラウドコンピューティングの統合
- 世界な接続性とデータアクセシビリティの採用急増
- 促進要因
- COVID-19による市場への影響分析
第4章 衛星画像データサービス市場:センシング技術別
- 光学画像
- レーダー画像
第5章 衛星画像データサービス市場:産業別
- エネルギー・電力
- 防衛・情報
- エンジニアリングとインフラ
- 環境・農業
- 運輸・物流
- その他
第6章 衛星画像データサービス市場:最終用途別
- 商業
- 政府・軍関係
第7章 衛星画像データサービス市場:地域別
- 北米
- 米国
- カナダ
- メキシコ
- 欧州
- 英国
- ドイツ
- フランス
- ロシア
- その他欧州
- アジア太平洋
- 中国
- 日本
- インド
- 韓国
- その他アジア太平洋地域
- ラテンアメリカ
- ラテンアメリカ
- 中東
- アフリカ
第8章 競合情勢
- イントロダクション
- 主要成功戦略
- 主要10社の製品マッピング
- 競合ダッシュボード
- 競合ヒートマップ
- 主要企業のポジショニング、2022年
第9章 企業プロファイル
- Maxar Technologies
- Airbus
- Planet Labs PBC
- ICEYE
- LAND INFO Worldwide Mapping, LLC
- L3Harris Technologies, Inc.
- Satellite Imaging Corporation
- Ursa Space Systems, Inc.
- EAST VIEW GEOSPATIAL, INC.
- BlackSky
LIST OF TABLES
- TABLE 01. GLOBAL SATELLITE IMAGE DATA SERVICES MARKET, BY SENSING TECHNIQUE, 2022-2032 ($MILLION)
- TABLE 02. SATELLITE IMAGE DATA SERVICES MARKET FOR OPTICAL IMAGERY, BY REGION, 2022-2032 ($MILLION)
- TABLE 03. SATELLITE IMAGE DATA SERVICES MARKET FOR RADAR IMAGERY, BY REGION, 2022-2032 ($MILLION)
- TABLE 04. GLOBAL SATELLITE IMAGE DATA SERVICES MARKET, BY INDUSTRY, 2022-2032 ($MILLION)
- TABLE 05. SATELLITE IMAGE DATA SERVICES MARKET FOR ENERGY AND POWER, BY REGION, 2022-2032 ($MILLION)
- TABLE 06. SATELLITE IMAGE DATA SERVICES MARKET FOR DEFENSE AND INTELLIGENCE, BY REGION, 2022-2032 ($MILLION)
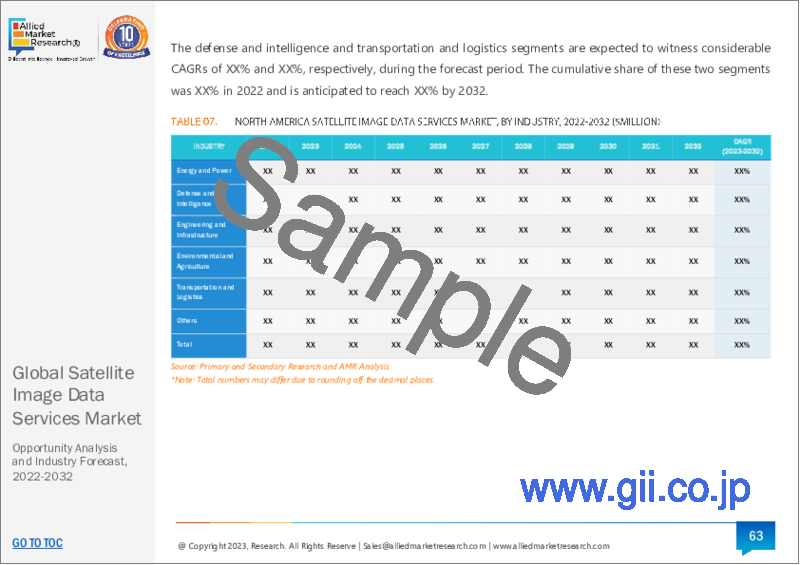
- TABLE 07. SATELLITE IMAGE DATA SERVICES MARKET FOR ENGINEERING AND INFRASTRUCTURE, BY REGION, 2022-2032 ($MILLION)
- TABLE 08. SATELLITE IMAGE DATA SERVICES MARKET FOR ENVIRONMENTAL AND AGRICULTURE, BY REGION, 2022-2032 ($MILLION)
- TABLE 09. SATELLITE IMAGE DATA SERVICES MARKET FOR TRANSPORTATION AND LOGISTICS, BY REGION, 2022-2032 ($MILLION)
- TABLE 10. SATELLITE IMAGE DATA SERVICES MARKET FOR OTHERS, BY REGION, 2022-2032 ($MILLION)
- TABLE 11. GLOBAL SATELLITE IMAGE DATA SERVICES MARKET, BY END-USE, 2022-2032 ($MILLION)
- TABLE 12. SATELLITE IMAGE DATA SERVICES MARKET FOR COMMERCIAL, BY REGION, 2022-2032 ($MILLION)
- TABLE 13. SATELLITE IMAGE DATA SERVICES MARKET FOR GOVERNMENT AND MILITARY, BY REGION, 2022-2032 ($MILLION)
- TABLE 14. SATELLITE IMAGE DATA SERVICES MARKET, BY REGION, 2022-2032 ($MILLION)
- TABLE 15. NORTH AMERICA SATELLITE IMAGE DATA SERVICES MARKET, BY SENSING TECHNIQUE, 2022-2032 ($MILLION)
- TABLE 16. NORTH AMERICA SATELLITE IMAGE DATA SERVICES MARKET, BY INDUSTRY, 2022-2032 ($MILLION)
- TABLE 17. NORTH AMERICA SATELLITE IMAGE DATA SERVICES MARKET, BY END-USE, 2022-2032 ($MILLION)
- TABLE 18. NORTH AMERICA SATELLITE IMAGE DATA SERVICES MARKET, BY COUNTRY, 2022-2032 ($MILLION)
- TABLE 19. U.S. SATELLITE IMAGE DATA SERVICES MARKET, BY SENSING TECHNIQUE, 2022-2032 ($MILLION)
- TABLE 20. U.S. SATELLITE IMAGE DATA SERVICES MARKET, BY INDUSTRY, 2022-2032 ($MILLION)
- TABLE 21. U.S. SATELLITE IMAGE DATA SERVICES MARKET, BY END-USE, 2022-2032 ($MILLION)
- TABLE 22. CANADA SATELLITE IMAGE DATA SERVICES MARKET, BY SENSING TECHNIQUE, 2022-2032 ($MILLION)
- TABLE 23. CANADA SATELLITE IMAGE DATA SERVICES MARKET, BY INDUSTRY, 2022-2032 ($MILLION)
- TABLE 24. CANADA SATELLITE IMAGE DATA SERVICES MARKET, BY END-USE, 2022-2032 ($MILLION)
- TABLE 25. MEXICO SATELLITE IMAGE DATA SERVICES MARKET, BY SENSING TECHNIQUE, 2022-2032 ($MILLION)
- TABLE 26. MEXICO SATELLITE IMAGE DATA SERVICES MARKET, BY INDUSTRY, 2022-2032 ($MILLION)
- TABLE 27. MEXICO SATELLITE IMAGE DATA SERVICES MARKET, BY END-USE, 2022-2032 ($MILLION)
- TABLE 28. EUROPE SATELLITE IMAGE DATA SERVICES MARKET, BY SENSING TECHNIQUE, 2022-2032 ($MILLION)
- TABLE 29. EUROPE SATELLITE IMAGE DATA SERVICES MARKET, BY INDUSTRY, 2022-2032 ($MILLION)
- TABLE 30. EUROPE SATELLITE IMAGE DATA SERVICES MARKET, BY END-USE, 2022-2032 ($MILLION)
- TABLE 31. EUROPE SATELLITE IMAGE DATA SERVICES MARKET, BY COUNTRY, 2022-2032 ($MILLION)
- TABLE 32. UK SATELLITE IMAGE DATA SERVICES MARKET, BY SENSING TECHNIQUE, 2022-2032 ($MILLION)
- TABLE 33. UK SATELLITE IMAGE DATA SERVICES MARKET, BY INDUSTRY, 2022-2032 ($MILLION)
- TABLE 34. UK SATELLITE IMAGE DATA SERVICES MARKET, BY END-USE, 2022-2032 ($MILLION)
- TABLE 35. GERMANY SATELLITE IMAGE DATA SERVICES MARKET, BY SENSING TECHNIQUE, 2022-2032 ($MILLION)
- TABLE 36. GERMANY SATELLITE IMAGE DATA SERVICES MARKET, BY INDUSTRY, 2022-2032 ($MILLION)
- TABLE 37. GERMANY SATELLITE IMAGE DATA SERVICES MARKET, BY END-USE, 2022-2032 ($MILLION)
- TABLE 38. FRANCE SATELLITE IMAGE DATA SERVICES MARKET, BY SENSING TECHNIQUE, 2022-2032 ($MILLION)
- TABLE 39. FRANCE SATELLITE IMAGE DATA SERVICES MARKET, BY INDUSTRY, 2022-2032 ($MILLION)
- TABLE 40. FRANCE SATELLITE IMAGE DATA SERVICES MARKET, BY END-USE, 2022-2032 ($MILLION)
- TABLE 41. RUSSIA SATELLITE IMAGE DATA SERVICES MARKET, BY SENSING TECHNIQUE, 2022-2032 ($MILLION)
- TABLE 42. RUSSIA SATELLITE IMAGE DATA SERVICES MARKET, BY INDUSTRY, 2022-2032 ($MILLION)
- TABLE 43. RUSSIA SATELLITE IMAGE DATA SERVICES MARKET, BY END-USE, 2022-2032 ($MILLION)
- TABLE 44. REST OF EUROPE SATELLITE IMAGE DATA SERVICES MARKET, BY SENSING TECHNIQUE, 2022-2032 ($MILLION)
- TABLE 45. REST OF EUROPE SATELLITE IMAGE DATA SERVICES MARKET, BY INDUSTRY, 2022-2032 ($MILLION)
- TABLE 46. REST OF EUROPE SATELLITE IMAGE DATA SERVICES MARKET, BY END-USE, 2022-2032 ($MILLION)
- TABLE 47. ASIA-PACIFIC SATELLITE IMAGE DATA SERVICES MARKET, BY SENSING TECHNIQUE, 2022-2032 ($MILLION)
- TABLE 48. ASIA-PACIFIC SATELLITE IMAGE DATA SERVICES MARKET, BY INDUSTRY, 2022-2032 ($MILLION)
- TABLE 49. ASIA-PACIFIC SATELLITE IMAGE DATA SERVICES MARKET, BY END-USE, 2022-2032 ($MILLION)
- TABLE 50. ASIA-PACIFIC SATELLITE IMAGE DATA SERVICES MARKET, BY COUNTRY, 2022-2032 ($MILLION)
- TABLE 51. CHINA SATELLITE IMAGE DATA SERVICES MARKET, BY SENSING TECHNIQUE, 2022-2032 ($MILLION)
- TABLE 52. CHINA SATELLITE IMAGE DATA SERVICES MARKET, BY INDUSTRY, 2022-2032 ($MILLION)
- TABLE 53. CHINA SATELLITE IMAGE DATA SERVICES MARKET, BY END-USE, 2022-2032 ($MILLION)
- TABLE 54. JAPAN SATELLITE IMAGE DATA SERVICES MARKET, BY SENSING TECHNIQUE, 2022-2032 ($MILLION)
- TABLE 55. JAPAN SATELLITE IMAGE DATA SERVICES MARKET, BY INDUSTRY, 2022-2032 ($MILLION)
- TABLE 56. JAPAN SATELLITE IMAGE DATA SERVICES MARKET, BY END-USE, 2022-2032 ($MILLION)
- TABLE 57. INDIA SATELLITE IMAGE DATA SERVICES MARKET, BY SENSING TECHNIQUE, 2022-2032 ($MILLION)
- TABLE 58. INDIA SATELLITE IMAGE DATA SERVICES MARKET, BY INDUSTRY, 2022-2032 ($MILLION)
- TABLE 59. INDIA SATELLITE IMAGE DATA SERVICES MARKET, BY END-USE, 2022-2032 ($MILLION)
- TABLE 60. SOUTH KOREA SATELLITE IMAGE DATA SERVICES MARKET, BY SENSING TECHNIQUE, 2022-2032 ($MILLION)
- TABLE 61. SOUTH KOREA SATELLITE IMAGE DATA SERVICES MARKET, BY INDUSTRY, 2022-2032 ($MILLION)
- TABLE 62. SOUTH KOREA SATELLITE IMAGE DATA SERVICES MARKET, BY END-USE, 2022-2032 ($MILLION)
- TABLE 63. REST OF ASIA-PACIFIC SATELLITE IMAGE DATA SERVICES MARKET, BY SENSING TECHNIQUE, 2022-2032 ($MILLION)
- TABLE 64. REST OF ASIA-PACIFIC SATELLITE IMAGE DATA SERVICES MARKET, BY INDUSTRY, 2022-2032 ($MILLION)
- TABLE 65. REST OF ASIA-PACIFIC SATELLITE IMAGE DATA SERVICES MARKET, BY END-USE, 2022-2032 ($MILLION)
- TABLE 66. LAMEA SATELLITE IMAGE DATA SERVICES MARKET, BY SENSING TECHNIQUE, 2022-2032 ($MILLION)
- TABLE 67. LAMEA SATELLITE IMAGE DATA SERVICES MARKET, BY INDUSTRY, 2022-2032 ($MILLION)
- TABLE 68. LAMEA SATELLITE IMAGE DATA SERVICES MARKET, BY END-USE, 2022-2032 ($MILLION)
- TABLE 69. LAMEA SATELLITE IMAGE DATA SERVICES MARKET, BY COUNTRY, 2022-2032 ($MILLION)
- TABLE 70. LATIN AMERICA SATELLITE IMAGE DATA SERVICES MARKET, BY SENSING TECHNIQUE, 2022-2032 ($MILLION)
- TABLE 71. LATIN AMERICA SATELLITE IMAGE DATA SERVICES MARKET, BY INDUSTRY, 2022-2032 ($MILLION)
- TABLE 72. LATIN AMERICA SATELLITE IMAGE DATA SERVICES MARKET, BY END-USE, 2022-2032 ($MILLION)
- TABLE 73. MIDDLE EAST SATELLITE IMAGE DATA SERVICES MARKET, BY SENSING TECHNIQUE, 2022-2032 ($MILLION)
- TABLE 74. MIDDLE EAST SATELLITE IMAGE DATA SERVICES MARKET, BY INDUSTRY, 2022-2032 ($MILLION)
- TABLE 75. MIDDLE EAST SATELLITE IMAGE DATA SERVICES MARKET, BY END-USE, 2022-2032 ($MILLION)
- TABLE 76. AFRICA SATELLITE IMAGE DATA SERVICES MARKET, BY SENSING TECHNIQUE, 2022-2032 ($MILLION)
- TABLE 77. AFRICA SATELLITE IMAGE DATA SERVICES MARKET, BY INDUSTRY, 2022-2032 ($MILLION)
- TABLE 78. AFRICA SATELLITE IMAGE DATA SERVICES MARKET, BY END-USE, 2022-2032 ($MILLION)
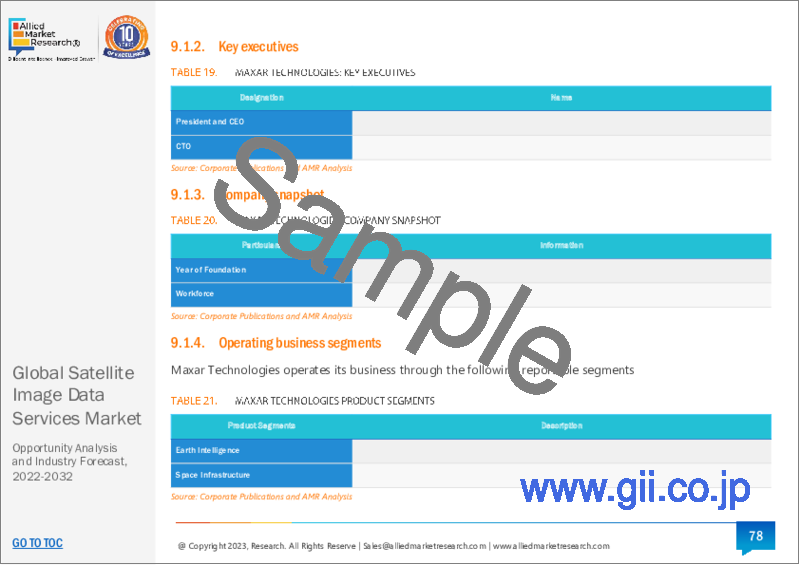
- TABLE 79. MAXAR TECHNOLOGIES: KEY EXECUTIVES
- TABLE 80. MAXAR TECHNOLOGIES: COMPANY SNAPSHOT
- TABLE 81. MAXAR TECHNOLOGIES: PRODUCT SEGMENTS
- TABLE 82. MAXAR TECHNOLOGIES: PRODUCT PORTFOLIO
- TABLE 83. MAXAR TECHNOLOGIES: KEY STRATERGIES
- TABLE 84. AIRBUS: KEY EXECUTIVES
- TABLE 85. AIRBUS: COMPANY SNAPSHOT
- TABLE 86. AIRBUS: PRODUCT SEGMENTS
- TABLE 87. AIRBUS: PRODUCT PORTFOLIO
- TABLE 88. AIRBUS: KEY STRATERGIES
- TABLE 89. PLANET LABS PBC: KEY EXECUTIVES
- TABLE 90. PLANET LABS PBC: COMPANY SNAPSHOT
- TABLE 91. PLANET LABS PBC: PRODUCT SEGMENTS
- TABLE 92. PLANET LABS PBC: SERVICE SEGMENTS
- TABLE 93. PLANET LABS PBC: PRODUCT PORTFOLIO
- TABLE 94. PLANET LABS PBC: KEY STRATERGIES
- TABLE 95. ICEYE: KEY EXECUTIVES
- TABLE 96. ICEYE: COMPANY SNAPSHOT
- TABLE 97. ICEYE: PRODUCT SEGMENTS
- TABLE 98. ICEYE: SERVICE SEGMENTS
- TABLE 99. ICEYE: PRODUCT PORTFOLIO
- TABLE 100. ICEYE: KEY STRATERGIES
- TABLE 101. LAND INFO WORLDWIDE MAPPING, LLC: KEY EXECUTIVES
- TABLE 102. LAND INFO WORLDWIDE MAPPING, LLC: COMPANY SNAPSHOT
- TABLE 103. LAND INFO WORLDWIDE MAPPING, LLC: PRODUCT SEGMENTS
- TABLE 104. LAND INFO WORLDWIDE MAPPING, LLC: SERVICE SEGMENTS
- TABLE 105. LAND INFO WORLDWIDE MAPPING, LLC: PRODUCT PORTFOLIO
- TABLE 106. LAND INFO WORLDWIDE MAPPING, LLC: KEY STRATERGIES
- TABLE 107. L3HARRIS TECHNOLOGIES, INC.: KEY EXECUTIVES
- TABLE 108. L3HARRIS TECHNOLOGIES, INC.: COMPANY SNAPSHOT
- TABLE 109. L3HARRIS TECHNOLOGIES, INC.: PRODUCT SEGMENTS
- TABLE 110. L3HARRIS TECHNOLOGIES, INC.: PRODUCT PORTFOLIO
- TABLE 111. L3HARRIS TECHNOLOGIES, INC.: KEY STRATERGIES
- TABLE 112. SATELLITE IMAGING CORPORATION: KEY EXECUTIVES
- TABLE 113. SATELLITE IMAGING CORPORATION: COMPANY SNAPSHOT
- TABLE 114. SATELLITE IMAGING CORPORATION: SERVICE SEGMENTS
- TABLE 115. SATELLITE IMAGING CORPORATION: PRODUCT PORTFOLIO
- TABLE 116. URSA SPACE SYSTEMS, INC.: KEY EXECUTIVES
- TABLE 117. URSA SPACE SYSTEMS, INC.: COMPANY SNAPSHOT
- TABLE 118. URSA SPACE SYSTEMS, INC.: SERVICE SEGMENTS
- TABLE 119. URSA SPACE SYSTEMS, INC.: PRODUCT PORTFOLIO
- TABLE 120. URSA SPACE SYSTEMS, INC.: KEY STRATERGIES
- TABLE 121. EAST VIEW GEOSPATIAL, INC.: KEY EXECUTIVES
- TABLE 122. EAST VIEW GEOSPATIAL, INC.: COMPANY SNAPSHOT
- TABLE 123. EAST VIEW GEOSPATIAL, INC.: PRODUCT SEGMENTS
- TABLE 124. EAST VIEW GEOSPATIAL, INC.: SERVICE SEGMENTS
- TABLE 125. EAST VIEW GEOSPATIAL, INC.: PRODUCT PORTFOLIO
- TABLE 126. EAST VIEW GEOSPATIAL, INC.: KEY STRATERGIES
- TABLE 127. BLACKSKY: KEY EXECUTIVES
- TABLE 128. BLACKSKY: COMPANY SNAPSHOT
- TABLE 129. BLACKSKY: PRODUCT SEGMENTS
- TABLE 130. BLACKSKY: PRODUCT PORTFOLIO
- TABLE 131. BLACKSKY: KEY STRATERGIES
LIST OF FIGURES
- FIGURE 01. SATELLITE IMAGE DATA SERVICES MARKET, 2022-2032
- FIGURE 02. SEGMENTATION OF SATELLITE IMAGE DATA SERVICES MARKET, 2022-2032
- FIGURE 03. TOP INVESTMENT POCKETS IN SATELLITE IMAGE DATA SERVICES MARKET (2023-2032)
- FIGURE 04. LOW BARGAINING POWER OF SUPPLIERS
- FIGURE 05. LOW BARGAINING POWER OF BUYERS
- FIGURE 06. LOW THREAT OF SUBSTITUTES
- FIGURE 07. LOW THREAT OF NEW ENTRANTS
- FIGURE 08. LOW INTENSITY OF RIVALRY
- FIGURE 09. DRIVERS, RESTRAINTS AND OPPORTUNITIES: GLOBALSATELLITE IMAGE DATA SERVICES MARKET
- FIGURE 10. SATELLITE IMAGE DATA SERVICES MARKET, BY SENSING TECHNIQUE, 2022(%)
- FIGURE 11. COMPARATIVE SHARE ANALYSIS OF SATELLITE IMAGE DATA SERVICES MARKET FOR OPTICAL IMAGERY, BY COUNTRY 2022 AND 2032(%)
- FIGURE 12. COMPARATIVE SHARE ANALYSIS OF SATELLITE IMAGE DATA SERVICES MARKET FOR RADAR IMAGERY, BY COUNTRY 2022 AND 2032(%)
- FIGURE 13. SATELLITE IMAGE DATA SERVICES MARKET, BY INDUSTRY, 2022(%)
- FIGURE 14. COMPARATIVE SHARE ANALYSIS OF SATELLITE IMAGE DATA SERVICES MARKET FOR ENERGY AND POWER, BY COUNTRY 2022 AND 2032(%)
- FIGURE 15. COMPARATIVE SHARE ANALYSIS OF SATELLITE IMAGE DATA SERVICES MARKET FOR DEFENSE AND INTELLIGENCE, BY COUNTRY 2022 AND 2032(%)
- FIGURE 16. COMPARATIVE SHARE ANALYSIS OF SATELLITE IMAGE DATA SERVICES MARKET FOR ENGINEERING AND INFRASTRUCTURE, BY COUNTRY 2022 AND 2032(%)
- FIGURE 17. COMPARATIVE SHARE ANALYSIS OF SATELLITE IMAGE DATA SERVICES MARKET FOR ENVIRONMENTAL AND AGRICULTURE, BY COUNTRY 2022 AND 2032(%)
- FIGURE 18. COMPARATIVE SHARE ANALYSIS OF SATELLITE IMAGE DATA SERVICES MARKET FOR TRANSPORTATION AND LOGISTICS, BY COUNTRY 2022 AND 2032(%)
- FIGURE 19. COMPARATIVE SHARE ANALYSIS OF SATELLITE IMAGE DATA SERVICES MARKET FOR OTHERS, BY COUNTRY 2022 AND 2032(%)
- FIGURE 20. SATELLITE IMAGE DATA SERVICES MARKET, BY END-USE, 2022(%)
- FIGURE 21. COMPARATIVE SHARE ANALYSIS OF SATELLITE IMAGE DATA SERVICES MARKET FOR COMMERCIAL, BY COUNTRY 2022 AND 2032(%)
- FIGURE 22. COMPARATIVE SHARE ANALYSIS OF SATELLITE IMAGE DATA SERVICES MARKET FOR GOVERNMENT AND MILITARY, BY COUNTRY 2022 AND 2032(%)
- FIGURE 23. SATELLITE IMAGE DATA SERVICES MARKET BY REGION, 2022
- FIGURE 24. U.S. SATELLITE IMAGE DATA SERVICES MARKET, 2022-2032 ($MILLION)
- FIGURE 25. CANADA SATELLITE IMAGE DATA SERVICES MARKET, 2022-2032 ($MILLION)
- FIGURE 26. MEXICO SATELLITE IMAGE DATA SERVICES MARKET, 2022-2032 ($MILLION)
- FIGURE 27. UK SATELLITE IMAGE DATA SERVICES MARKET, 2022-2032 ($MILLION)
- FIGURE 28. GERMANY SATELLITE IMAGE DATA SERVICES MARKET, 2022-2032 ($MILLION)
- FIGURE 29. FRANCE SATELLITE IMAGE DATA SERVICES MARKET, 2022-2032 ($MILLION)
- FIGURE 30. RUSSIA SATELLITE IMAGE DATA SERVICES MARKET, 2022-2032 ($MILLION)
- FIGURE 31. REST OF EUROPE SATELLITE IMAGE DATA SERVICES MARKET, 2022-2032 ($MILLION)
- FIGURE 32. CHINA SATELLITE IMAGE DATA SERVICES MARKET, 2022-2032 ($MILLION)
- FIGURE 33. JAPAN SATELLITE IMAGE DATA SERVICES MARKET, 2022-2032 ($MILLION)
- FIGURE 34. INDIA SATELLITE IMAGE DATA SERVICES MARKET, 2022-2032 ($MILLION)
- FIGURE 35. SOUTH KOREA SATELLITE IMAGE DATA SERVICES MARKET, 2022-2032 ($MILLION)
- FIGURE 36. REST OF ASIA-PACIFIC SATELLITE IMAGE DATA SERVICES MARKET, 2022-2032 ($MILLION)
- FIGURE 37. LATIN AMERICA SATELLITE IMAGE DATA SERVICES MARKET, 2022-2032 ($MILLION)
- FIGURE 38. MIDDLE EAST SATELLITE IMAGE DATA SERVICES MARKET, 2022-2032 ($MILLION)
- FIGURE 39. AFRICA SATELLITE IMAGE DATA SERVICES MARKET, 2022-2032 ($MILLION)
- FIGURE 40. TOP WINNING STRATEGIES, BY YEAR
- FIGURE 41. TOP WINNING STRATEGIES, BY DEVELOPMENT
- FIGURE 42. TOP WINNING STRATEGIES, BY COMPANY
- FIGURE 43. PRODUCT MAPPING OF TOP 10 PLAYERS
- FIGURE 44. COMPETITIVE DASHBOARD
- FIGURE 45. COMPETITIVE HEATMAP: SATELLITE IMAGE DATA SERVICES MARKET
- FIGURE 46. TOP PLAYER POSITIONING, 2022
- FIGURE 47. MAXAR TECHNOLOGIES: RESEARCH & DEVELOPMENT EXPENDITURE, 2020-2022 ($MILLION)
- FIGURE 48. MAXAR TECHNOLOGIES: NET SALES, 2020-2022 ($MILLION)
- FIGURE 49. MAXAR TECHNOLOGIES: REVENUE SHARE BY SEGMENT, 2021 (%)
- FIGURE 50. MAXAR TECHNOLOGIES: REVENUE SHARE BY REGION, 2021 (%)
- FIGURE 51. AIRBUS: RESEARCH & DEVELOPMENT EXPENDITURE, 2020-2022 ($MILLION)
- FIGURE 52. AIRBUS: NET SALES, 2020-2022 ($MILLION)
- FIGURE 53. AIRBUS: REVENUE SHARE BY SEGMENT, 2022 (%)
- FIGURE 54. AIRBUS: REVENUE SHARE BY REGION, 2021 (%)
- FIGURE 55. PLANET LABS PBC: RESEARCH & DEVELOPMENT EXPENDITURE, 2020-2022 ($MILLION)
- FIGURE 56. PLANET LABS PBC: NET SALES, 2020-2022 ($MILLION)
- FIGURE 57. PLANET LABS PBC: REVENUE SHARE BY REGION, 2022 (%)
- FIGURE 58. L3HARRIS TECHNOLOGIES, INC.: NET SALES, 2020-2022 ($MILLION)
- FIGURE 59. L3HARRIS TECHNOLOGIES, INC.: RESEARCH & DEVELOPMENT EXPENDITURE, 2020-2022 ($MILLION)
- FIGURE 60. L3HARRIS TECHNOLOGIES, INC.: REVENUE SHARE BY SEGMENT, 2022 (%)
- FIGURE 61. L3HARRIS TECHNOLOGIES, INC.: REVENUE SHARE BY REGION, 2022 (%)
- FIGURE 62. BLACKSKY: RESEARCH & DEVELOPMENT EXPENDITURE, 2020-2022 ($MILLION)
- FIGURE 63. BLACKSKY: NET SALES, 2020-2022 ($MILLION)
- FIGURE 64. BLACKSKY: REVENUE SHARE BY SEGMENT, 2022 (%)
- FIGURE 65. BLACKSKY: REVENUE SHARE BY REGION, 2022 (%)
The Satellite Image Data Services Market is likely to experience a significant growth rate of 22.2% from 2023-2032 owing to a rise in demand for geospatial information from various industries, an increase in demand for earth observation satellites, and supportive government initiatives and regulations - Allied Market Research
The engineering and infrastructure industry relies on satellite image data to support its various operations. Satellite imagery is essential in the planning, design, construction, and maintenance of infrastructure projects in the engineering and infrastructure sector. Satellite image data enhances the efficiency, accuracy, and sustainability of engineering and infrastructure projects. Engineers and planners use satellite image data to understand the terrain, land cover, and existing infrastructure networks during the planning and design stage. This information helps them assess the suitability of a site, identify any potential limitations, and optimize the design of the project. Engineers are able to make well-informed decisions about the layout and construction of roads, bridges, buildings, and other infrastructure components by visualizing the terrain and its features through satellite imagery. Satellite imagery is used to monitor and track progress during the construction phase. It ensures that the construction is progressing as planned and allows for effective project management. For instance, in February 2022, the Gurgaon Metropolitan Development Authority (GMDA) in India adopted satellite imagery as a tool to monitor ongoing infrastructure projects and identify encroachments on public land. Satellite images provide a comprehensive view of the city's landscape, allowing authorities to assess the progress of infrastructure projects and ensure their timely completion. By analyzing the satellite images, officials compare the actual progress on the ground with the proposed timelines and take necessary actions to address any delays or issues.
On the basis of end-use, the global satellite image data services market is segmented into commercial, and government and military. The commercial segment includes businesses and enterprises across various industries that utilize these services for their specific needs. It includes companies involved in agriculture, forestry, infrastructure development, insurance, telecommunications, transportation, logistics, energy, mining, and many other sectors. Satellite image data services have applications in diverse areas, including crop monitoring, land use planning, asset monitoring, site selection, infrastructure design, and construction, environmental impact assessment, risk assessment, and decision-making support. Numerous companies offer satellite imagery to businesses across industries to gather valuable insights, enhance operational efficiency, optimize resource allocation, and make informed decisions that lead to increased productivity, profitability, and sustainability. For instance, Maxar Technologies provides a suite of commercial satellite imagery to conserve resources, streamline operations, ensure regulatory compliance, and enhance safety measures. Such factors are expected to drive the growth of the segment in the market.
The government segment includes government agencies, research institutions, and public sector organizations, which utilize satellite image data services for various applications, including urban planning, disaster management, environmental monitoring, and national security. Satellite image data services play a crucial role in the government sector, providing valuable information and insights for various applications. Governments utilize satellite imagery for purposes such as land management, urban planning, infrastructure development, disaster response and recovery, environmental monitoring, and national security. Satellite imagery is utilized by the military to monitor and gather intelligence on potential threats, track military activities, and analyze the movements of enemy forces.
Governments utilize satellite image data to effectively monitor and regulate land use, ensure proper management of land resources, and enforce land-use policies. Governments adopt satellite image data to identify changes in land cover, detect unauthorized encroachments with accuracy, and implement appropriate land-use planning measures. In the case of natural disasters, satellite imagery becomes instrumental in assessing the extent of damage and identifying areas that have been affected. Governments utilize this data to prioritize rescue operations, establish evacuation routes, and coordinate relief efforts efficiently. Moreover, satellite image data plays a pivotal role in national security, aiding governments in defense and intelligence operations. It enables border surveillance, allowing government and military to monitor critical infrastructure and identify potential threats. Therefore, these applications are expected to drive the demand for satellite image data in the government sector.
The satellite image data services market is segmented on the basis of sensing technique, industry, and end-use, and region. Based on sensing technique, it is segmented into optical imagery, and radar imagery. On the basis of industry, it is classified into energy and power, defense and intelligence, engineering and infrastructure, environmental and agriculture, transportation and logistics, and others. By end-use, it is categorized into commercial, and government and military. By region, the market is analyzed across North America, Europe, Asia-Pacific, and LAMEA.
Some major companies operating in the market include: Maxar Technologies, ICEYE, Planet Labs PBC, Airbus, L3Harris Technologies, Inc., Ursa Space Systems, Inc., EAST VIEW GEOSPATIAL, INC., BlackSky, LAND INFO, Worldwide Mapping, LLC, and Satellite Imaging Corporation
Key Benefits For Stakeholders
- This report provides a quantitative analysis of the market segments, current trends, estimations, and dynamics of the satellite image data services market analysis from 2022 to 2032 to identify the prevailing satellite image data services market opportunities.
- The market research is offered along with information related to key drivers, restraints, and opportunities.
- Porter's five forces analysis highlights the potency of buyers and suppliers to enable stakeholders make profit-oriented business decisions and strengthen their supplier-buyer network.
- In-depth analysis of the satellite image data services market segmentation assists to determine the prevailing market opportunities.
- Major countries in each region are mapped according to their revenue contribution to the global market.
- Market player positioning facilitates benchmarking and provides a clear understanding of the present position of the market players.
- The report includes the analysis of the regional as well as global satellite image data services market trends, key players, market segments, application areas, and market growth strategies.
Key Market Segments
By Sensing Technique
- Optical Imagery
- Radar Imagery
By Industry
- Energy and Power
- Defense and Intelligence
- Engineering and Infrastructure
- Environmental and Agriculture
- Transportation and Logistics
- Others
By End-Use
- Commercial
- Government and Military
By Region
- North America
- U.S.
- Canada
- Mexico
- Europe
- UK
- Germany
- France
- Russia
- Rest of Europe
- Asia-Pacific
- China
- Japan
- India
- South Korea
- Rest of Asia-Pacific
- LAMEA
- Latin America
- Middle East
- Africa
Key Market Players:
- Airbus
- BlackSky
- EAST VIEW GEOSPATIAL, INC.
- ICEYE
- L3Harris Technologies, Inc.
- LAND INFO Worldwide Mapping, LLC
- Maxar Technologies
- Planet Labs PBC
- Satellite Imaging Corporation
- Ursa Space Systems, Inc.
TABLE OF CONTENTS
CHAPTER 1: INTRODUCTION
- 1.1. Report description
- 1.2. Key market segments
- 1.3. Key benefits to the stakeholders
- 1.4. Research Methodology
- 1.4.1. Primary research
- 1.4.2. Secondary research
- 1.4.3. Analyst tools and models
CHAPTER 2: EXECUTIVE SUMMARY
- 2.1. CXO Perspective
CHAPTER 3: MARKET OVERVIEW
- 3.1. Market definition and scope
- 3.2. Key findings
- 3.2.1. Top impacting factors
- 3.2.2. Top investment pockets
- 3.3. Porter's five forces analysis
- 3.3.1. Bargaining power of suppliers
- 3.3.2. Bargaining power of buyers
- 3.3.3. Threat of substitutes
- 3.3.4. Threat of new entrants
- 3.3.5. Intensity of rivalry
- 3.4. Market dynamics
- 3.4.1. Drivers
- 3.4.1.1. Rise in demand for geospatial information from various industries
- 3.4.1.2. Increase in demand for earth observation satellites
- 3.4.1.3. Supportive government initiatives and regulations
- 3.4.1. Drivers
- 3.4.2. Restraints
- 3.4.2.1. Regulatory and legal challenges
- 3.4.2.2. High cost
- 3.4.3. Opportunities
- 3.4.3.1. Integration of AI, ML, and Cloud Computing in satellite image data services
- 3.4.3.2. Surge in adoption of global connectivity and data accessibility
- 3.5. COVID-19 Impact Analysis on the market
CHAPTER 4: SATELLITE IMAGE DATA SERVICES MARKET, BY SENSING TECHNIQUE
- 4.1. Overview
- 4.1.1. Market size and forecast
- 4.2. Optical Imagery
- 4.2.1. Key market trends, growth factors and opportunities
- 4.2.2. Market size and forecast, by region
- 4.2.3. Market share analysis by country
- 4.3. Radar Imagery
- 4.3.1. Key market trends, growth factors and opportunities
- 4.3.2. Market size and forecast, by region
- 4.3.3. Market share analysis by country
CHAPTER 5: SATELLITE IMAGE DATA SERVICES MARKET, BY INDUSTRY
- 5.1. Overview
- 5.1.1. Market size and forecast
- 5.2. Energy and Power
- 5.2.1. Key market trends, growth factors and opportunities
- 5.2.2. Market size and forecast, by region
- 5.2.3. Market share analysis by country
- 5.3. Defense and Intelligence
- 5.3.1. Key market trends, growth factors and opportunities
- 5.3.2. Market size and forecast, by region
- 5.3.3. Market share analysis by country
- 5.4. Engineering and Infrastructure
- 5.4.1. Key market trends, growth factors and opportunities
- 5.4.2. Market size and forecast, by region
- 5.4.3. Market share analysis by country
- 5.5. Environmental and Agriculture
- 5.5.1. Key market trends, growth factors and opportunities
- 5.5.2. Market size and forecast, by region
- 5.5.3. Market share analysis by country
- 5.6. Transportation and Logistics
- 5.6.1. Key market trends, growth factors and opportunities
- 5.6.2. Market size and forecast, by region
- 5.6.3. Market share analysis by country
- 5.7. Others
- 5.7.1. Key market trends, growth factors and opportunities
- 5.7.2. Market size and forecast, by region
- 5.7.3. Market share analysis by country
CHAPTER 6: SATELLITE IMAGE DATA SERVICES MARKET, BY END-USE
- 6.1. Overview
- 6.1.1. Market size and forecast
- 6.2. Commercial
- 6.2.1. Key market trends, growth factors and opportunities
- 6.2.2. Market size and forecast, by region
- 6.2.3. Market share analysis by country
- 6.3. Government and Military
- 6.3.1. Key market trends, growth factors and opportunities
- 6.3.2. Market size and forecast, by region
- 6.3.3. Market share analysis by country
CHAPTER 7: SATELLITE IMAGE DATA SERVICES MARKET, BY REGION
- 7.1. Overview
- 7.1.1. Market size and forecast By Region
- 7.2. North America
- 7.2.1. Key trends and opportunities
- 7.2.2. Market size and forecast, by Sensing Technique
- 7.2.3. Market size and forecast, by Industry
- 7.2.4. Market size and forecast, by End-Use
- 7.2.5. Market size and forecast, by country
- 7.2.5.1. U.S.
- 7.2.5.1.1. Key market trends, growth factors and opportunities
- 7.2.5.1.2. Market size and forecast, by Sensing Technique
- 7.2.5.1.3. Market size and forecast, by Industry
- 7.2.5.1.4. Market size and forecast, by End-Use
- 7.2.5.2. Canada
- 7.2.5.2.1. Key market trends, growth factors and opportunities
- 7.2.5.2.2. Market size and forecast, by Sensing Technique
- 7.2.5.2.3. Market size and forecast, by Industry
- 7.2.5.2.4. Market size and forecast, by End-Use
- 7.2.5.3. Mexico
- 7.2.5.3.1. Key market trends, growth factors and opportunities
- 7.2.5.3.2. Market size and forecast, by Sensing Technique
- 7.2.5.3.3. Market size and forecast, by Industry
- 7.2.5.3.4. Market size and forecast, by End-Use
- 7.3. Europe
- 7.3.1. Key trends and opportunities
- 7.3.2. Market size and forecast, by Sensing Technique
- 7.3.3. Market size and forecast, by Industry
- 7.3.4. Market size and forecast, by End-Use
- 7.3.5. Market size and forecast, by country
- 7.3.5.1. UK
- 7.3.5.1.1. Key market trends, growth factors and opportunities
- 7.3.5.1.2. Market size and forecast, by Sensing Technique
- 7.3.5.1.3. Market size and forecast, by Industry
- 7.3.5.1.4. Market size and forecast, by End-Use
- 7.3.5.2. Germany
- 7.3.5.2.1. Key market trends, growth factors and opportunities
- 7.3.5.2.2. Market size and forecast, by Sensing Technique
- 7.3.5.2.3. Market size and forecast, by Industry
- 7.3.5.2.4. Market size and forecast, by End-Use
- 7.3.5.3. France
- 7.3.5.3.1. Key market trends, growth factors and opportunities
- 7.3.5.3.2. Market size and forecast, by Sensing Technique
- 7.3.5.3.3. Market size and forecast, by Industry
- 7.3.5.3.4. Market size and forecast, by End-Use
- 7.3.5.4. Russia
- 7.3.5.4.1. Key market trends, growth factors and opportunities
- 7.3.5.4.2. Market size and forecast, by Sensing Technique
- 7.3.5.4.3. Market size and forecast, by Industry
- 7.3.5.4.4. Market size and forecast, by End-Use
- 7.3.5.5. Rest of Europe
- 7.3.5.5.1. Key market trends, growth factors and opportunities
- 7.3.5.5.2. Market size and forecast, by Sensing Technique
- 7.3.5.5.3. Market size and forecast, by Industry
- 7.3.5.5.4. Market size and forecast, by End-Use
- 7.4. Asia-Pacific
- 7.4.1. Key trends and opportunities
- 7.4.2. Market size and forecast, by Sensing Technique
- 7.4.3. Market size and forecast, by Industry
- 7.4.4. Market size and forecast, by End-Use
- 7.4.5. Market size and forecast, by country
- 7.4.5.1. China
- 7.4.5.1.1. Key market trends, growth factors and opportunities
- 7.4.5.1.2. Market size and forecast, by Sensing Technique
- 7.4.5.1.3. Market size and forecast, by Industry
- 7.4.5.1.4. Market size and forecast, by End-Use
- 7.4.5.2. Japan
- 7.4.5.2.1. Key market trends, growth factors and opportunities
- 7.4.5.2.2. Market size and forecast, by Sensing Technique
- 7.4.5.2.3. Market size and forecast, by Industry
- 7.4.5.2.4. Market size and forecast, by End-Use
- 7.4.5.3. India
- 7.4.5.3.1. Key market trends, growth factors and opportunities
- 7.4.5.3.2. Market size and forecast, by Sensing Technique
- 7.4.5.3.3. Market size and forecast, by Industry
- 7.4.5.3.4. Market size and forecast, by End-Use
- 7.4.5.4. South Korea
- 7.4.5.4.1. Key market trends, growth factors and opportunities
- 7.4.5.4.2. Market size and forecast, by Sensing Technique
- 7.4.5.4.3. Market size and forecast, by Industry
- 7.4.5.4.4. Market size and forecast, by End-Use
- 7.4.5.5. Rest of Asia-Pacific
- 7.4.5.5.1. Key market trends, growth factors and opportunities
- 7.4.5.5.2. Market size and forecast, by Sensing Technique
- 7.4.5.5.3. Market size and forecast, by Industry
- 7.4.5.5.4. Market size and forecast, by End-Use
- 7.5. LAMEA
- 7.5.1. Key trends and opportunities
- 7.5.2. Market size and forecast, by Sensing Technique
- 7.5.3. Market size and forecast, by Industry
- 7.5.4. Market size and forecast, by End-Use
- 7.5.5. Market size and forecast, by country
- 7.5.5.1. Latin America
- 7.5.5.1.1. Key market trends, growth factors and opportunities
- 7.5.5.1.2. Market size and forecast, by Sensing Technique
- 7.5.5.1.3. Market size and forecast, by Industry
- 7.5.5.1.4. Market size and forecast, by End-Use
- 7.5.5.2. Middle East
- 7.5.5.2.1. Key market trends, growth factors and opportunities
- 7.5.5.2.2. Market size and forecast, by Sensing Technique
- 7.5.5.2.3. Market size and forecast, by Industry
- 7.5.5.2.4. Market size and forecast, by End-Use
- 7.5.5.3. Africa
- 7.5.5.3.1. Key market trends, growth factors and opportunities
- 7.5.5.3.2. Market size and forecast, by Sensing Technique
- 7.5.5.3.3. Market size and forecast, by Industry
- 7.5.5.3.4. Market size and forecast, by End-Use
CHAPTER 8: COMPETITIVE LANDSCAPE
- 8.1. Introduction
- 8.2. Top winning strategies
- 8.3. Product Mapping of Top 10 Player
- 8.4. Competitive Dashboard
- 8.5. Competitive Heatmap
- 8.6. Top player positioning, 2022
CHAPTER 9: COMPANY PROFILES
- 9.1. Maxar Technologies
- 9.1.1. Company overview
- 9.1.2. Key Executives
- 9.1.3. Company snapshot
- 9.1.4. Operating business segments
- 9.1.5. Product portfolio
- 9.1.6. Business performance
- 9.1.7. Key strategic moves and developments
- 9.2. Airbus
- 9.2.1. Company overview
- 9.2.2. Key Executives
- 9.2.3. Company snapshot
- 9.2.4. Operating business segments
- 9.2.5. Product portfolio
- 9.2.6. Business performance
- 9.2.7. Key strategic moves and developments
- 9.3. Planet Labs PBC
- 9.3.1. Company overview
- 9.3.2. Key Executives
- 9.3.3. Company snapshot
- 9.3.4. Operating business segments
- 9.3.5. Product portfolio
- 9.3.6. Business performance
- 9.3.7. Key strategic moves and developments
- 9.4. ICEYE
- 9.4.1. Company overview
- 9.4.2. Key Executives
- 9.4.3. Company snapshot
- 9.4.4. Operating business segments
- 9.4.5. Product portfolio
- 9.4.6. Key strategic moves and developments
- 9.5. LAND INFO Worldwide Mapping, LLC
- 9.5.1. Company overview
- 9.5.2. Key Executives
- 9.5.3. Company snapshot
- 9.5.4. Operating business segments
- 9.5.5. Product portfolio
- 9.5.6. Key strategic moves and developments
- 9.6. L3Harris Technologies, Inc.
- 9.6.1. Company overview
- 9.6.2. Key Executives
- 9.6.3. Company snapshot
- 9.6.4. Operating business segments
- 9.6.5. Product portfolio
- 9.6.6. Business performance
- 9.6.7. Key strategic moves and developments
- 9.7. Satellite Imaging Corporation
- 9.7.1. Company overview
- 9.7.2. Key Executives
- 9.7.3. Company snapshot
- 9.7.4. Operating business segments
- 9.7.5. Product portfolio
- 9.8. Ursa Space Systems, Inc.
- 9.8.1. Company overview
- 9.8.2. Key Executives
- 9.8.3. Company snapshot
- 9.8.4. Operating business segments
- 9.8.5. Product portfolio
- 9.8.6. Key strategic moves and developments
- 9.9. EAST VIEW GEOSPATIAL, INC.
- 9.9.1. Company overview
- 9.9.2. Key Executives
- 9.9.3. Company snapshot
- 9.9.4. Operating business segments
- 9.9.5. Product portfolio
- 9.9.6. Key strategic moves and developments
- 9.10. BlackSky
- 9.10.1. Company overview
- 9.10.2. Key Executives
- 9.10.3. Company snapshot
- 9.10.4. Operating business segments
- 9.10.5. Product portfolio
- 9.10.6. Business performance
- 9.10.7. Key strategic moves and developments