|
|
市場調査レポート
商品コード
1411750
欧州の農業用衛星画像市場 (2023-2028年):分析・予測Europe Satellite Imaging for Agriculture Market: Analysis and Forecast, 2023-2028 |
||||||
|
|||||||
カスタマイズ可能
|
|||||||

| 欧州の農業用衛星画像市場 (2023-2028年):分析・予測 |
|
出版日: 2024年01月22日
発行: BIS Research
ページ情報: 英文 129 Pages
納期: 1~5営業日
|

全表示
- 概要
- 図表
- 目次
英国を除く欧州の農業用衛星画像の市場規模は、2023年の6,550万米ドルから、予測期間中は7.51%のCAGRで推移し、2028年には9,412万米ドルの規模に成長すると予測されています。
同市場は、より良い農業や持続可能な農業に対する需要の高まりにより、成長の態勢を整えています。
| 主要市場統計 | |
|---|---|
| 予測期間 | 2023-2028年 |
| 2023年評価 | 6,550万米ドル |
| 2028年予測 | 9,412万米ドル |
| CAGR | 7.51% |
欧州の農業用衛星画像市場は、欧州各国の農業部門における先端技術の採用が加速していることを背景に、現在大幅な成長を遂げています。欧州諸国は農業の生産性および持続可能性の重視が特に顕著であり、作物の正確なモニタリング、土壌の健康状態の評価、灌漑と施肥の最適化のための貴重なツールとして衛星画像の導入が進んでいます。この技術は、病害虫の早期発見、資源配分の最適化、正確な作物収量予測を容易にします。同市場には数多くの衛星画像サービスプロバイダーが存在し、リモートセンシングやAIなどの最先端技術の統合による恩恵を受けています。欧州が持続可能な農業と精密農業の実践を優先し続ける中、農業用衛星画像市場は大きな成長を遂げ、地域全体の農業生産性向上と環境保全に貢献する態勢を整えています。
当レポートでは、欧州の農業用衛星画像の市場を調査し、市場概要、市場成長への各種影響因子の分析、エコシステム、進行中のプログラム、市場規模の推移・予測、各種区分・主要国別の詳細分析、競合情勢、主要企業の分析などをまとめています。
市場の分類
セグメンテーション1:用途別
- 作物ヘルスモニタリング
- 土壌マッピング
- 林業
- その他
セグメンテーション2:エンドユーザー別
- 農業関連企業
- 政府・非政府機関
- 研究機関
- その他
セグメンテーション3:製品別
- データ収集
- 処理
- アナリティクス
- 統合配信プラットフォーム
セグメンテーション4:国別
- ドイツ
- フランス
- イタリア
- オランダ
- スイス
- ベルギー
- スペイン
- その他
目次
エグゼクティブサマリー
調査範囲
第1章 市場
- 業界の展望
- 市場の定義
- 現在の動向
- エコシステム/進行中のプログラム
- 事業力学
- 事業促進要因
- 事業上の課題
- 市場戦略と展開
- 事業機会
- スタートアップの情勢
- エコシステムにおける主要なスタートアップ企業
- 資金調達分析
- デジタル農業用途のアクティブ衛星とその技術
- ロシア・ウクライナ危機が市場に与える影響
第2章 地域
- 農業用衛星画像:地域別
- 欧州
- 市場
- 用途
- 製品
- 欧州(国別)
第3章 市場:競合ベンチマーキング・企業プロファイル
- 競合ベンチマーキング
- 市場シェア分析
- 企業プロファイル
- Airbus
- European Space Imaging
- Gamaya
- ICEYE
- Open Cosmos Ltd
- Syngenta
- 農業用衛星画像市場における主要な新興企業
- SpaceSense
第4章 調査手法
List of Figures
- Figure 1: Operational Stock of Active Agriculture Satellites for Digital Applications, 2000-2022
- Figure 2: Satellite Imaging for Agriculture Market, $Million, 2022-2028
- Figure 3: Market Dynamics of the Satellite Imaging for Agriculture Market
- Figure 4: Satellite Imaging for Agriculture Market (by Application), $Million, 2022-2028
- Figure 5: Satellite Imaging for Agriculture Market (by End User), $Million, 2022-2028
- Figure 6: Satellite Imaging for Agriculture Market (by Product), $Million, 2022-2028
- Figure 7: Satellite Imaging for Agriculture Market (by Region), $Million, 2022
- Figure 8: Features of the EOS SAT-1 Satellite
- Figure 9: European Union (EU) Farm and Farmland by Land Size Class, 2018
- Figure 10: Share of Key Market Strategies and Developments, January 2019-April 2023
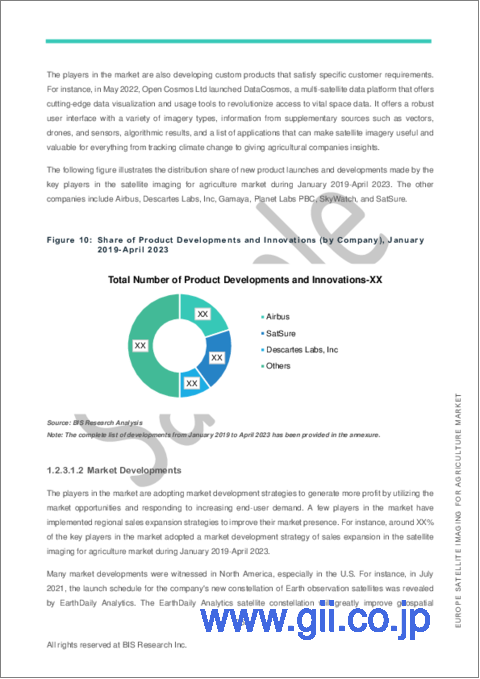
- Figure 11: Share of Product Developments and Innovations (by Company), January 2019-April 2023
- Figure 12: Share of Market Developments (by Company), January 2019-April 2023
- Figure 13: Share of Mergers and Acquisitions (by Company), January 2019-April 2023
- Figure 14: Share of Partnerships, Collaborations, and Joint Ventures (by Company), January 2019-April 2023
- Figure 15: Total Investment and Number of Funding Deals in the Satellite Imaging for Agriculture Market, 2017-2022
- Figure 16: Country-Wise Funding Share in the Satellite Imaging for Agriculture Market, 2017-2022
- Figure 17: Top Investors in the Satellite Imaging for Agriculture Market, 2017-2022
- Figure 18: Farm Size, Number of Farms, and State of Digitalization in Europe
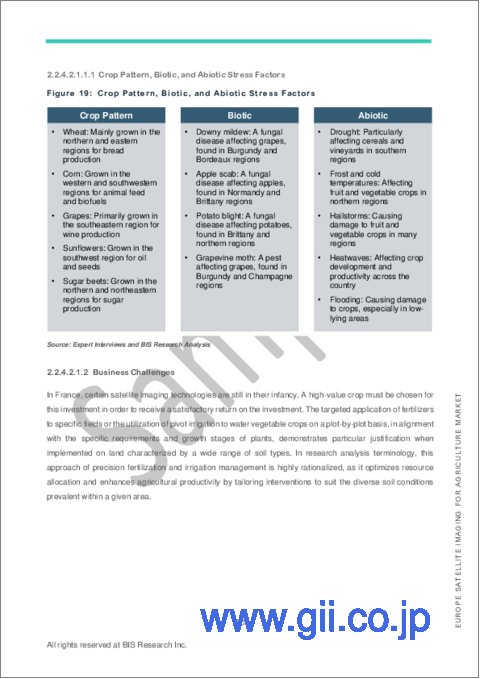
- Figure 19: Crop Pattern, Biotic, and Abiotic Stress Factors
- Figure 20: Farm Size, Number of Farms, and State of Digitalization in Italy
- Figure 21: Crop Pattern, Biotic, and Abiotic Stress Factors
- Figure 22: Farm Size, Number of Farms, and State of Digitalization in France
- Figure 23: Crop Pattern, Biotic, and Abiotic Stress Factors
- Figure 24: Farm Size, Number of Farms, and State of Digitalization in the Netherlands
- Figure 25: Crop Pattern, Biotic, and Abiotic Stress Factors
- Figure 26: Farm Size, Number of Farms, and State of Digitalization in Germany
- Figure 27: Crop Pattern, Biotic, and Abiotic Stress Factors
- Figure 28: Farm Size, Number of Farms, and State of Digitalization in Switzerland
- Figure 29: Crop Pattern, Biotic, and Abiotic Stress Factors
- Figure 30: Farm Size, Number of Farms, and State of Digitalization in Belgium
- Figure 31: Crop Pattern, Biotic, and Abiotic Stress Factors
- Figure 32: Farm Size, Number of Farms, and State of Digitalization in Spain
- Figure 33: Crop Pattern, Biotic, and Abiotic Stress Factors
- Figure 34: Farm Size, Number of Farms, and State of Digitalization in Rest-of-Europe
- Figure 35: Crop Pattern, Biotic, and Abiotic Stress Factors
- Figure 36: Competitive Benchmarking Matrix for Key Satellite Imaging for Agriculture Providers
- Figure 37: Market Share Analysis of Satellite Imaging for Agriculture Market, 2021
- Figure 38: Satellite Imaging for Agriculture Market: Research Methodology
- Figure 39: Data Triangulation
- Figure 40: Top-Down and Bottom-Up Approach
- Figure 41: Assumptions and Limitations
List of Tables
- Table 1: Key Consortiums, Associations, and Regulatory Bodies in the Satellite Imaging for Agriculture Market
- Table 2: Government Initiatives
- Table 3: Benefits of Satellite Imaging vs. Drone
- Table 4: Free Satellite Imagery Sources
- Table 5: Key Startups in the Satellite Imaging for Agriculture Market, 2019-2023
- Table 6: Top Funding by the Start-ups in the Satellite Imaging for Agriculture Market, 2022
- Table 7: Active Agriculture Satellites Technical Information
- Table 8: Satellite Imaging for Agriculture Market (by Region), $Million, 2022-2028
- Table 9: Europe Satellite Imaging for Agriculture Market (by Application), $Million, 2022-2028
- Table 10: Europe Satellite Imaging for Agriculture Market (by End User), $Million, 2022-2028
- Table 11: Europe Satellite Imaging for Agriculture Market (by Product), $Million, 2022-2028
- Table 12: Europe Satellite Imaging for Agriculture (by Country), $Million, 2022-2028
- Table 13: Italy Satellite Imaging for Agriculture Market (by Application), $Million, 2022-2028
- Table 14: Italy Satellite Imaging for Agriculture Market (by End User), $Million, 2022-2028
- Table 15: Italy Satellite Imaging for Agriculture Market (by Product), $Million, 2022-2028
- Table 16: France Satellite Imaging for Agriculture Market (by Application), $Million, 2022-2028
- Table 17: France Satellite Imaging for Agriculture Market (by End User), $Million, 2022-2028
- Table 18: France Satellite Imaging for Agriculture Market (by Product), $Million, 2022-2028
- Table 19: Netherlands Satellite Imaging for Agriculture Market (by Application), $Million, 2022-2028
- Table 20: Netherlands Satellite Imaging for Agriculture Market (by End User), $Million, 2022-2028
- Table 21: Netherlands Satellite Imaging for Agriculture Market (by Product), $Million, 2022-2028
- Table 22: Germany Satellite Imaging for Agriculture Market (by Application), $Million, 2022-2028
- Table 23: Germany Satellite Imaging for Agriculture Market (by End User), $Million, 2022-2028
- Table 24: Germany Satellite Imaging for Agriculture Market (by Product), $Million, 2022-2028
- Table 25: Switzerland Satellite Imaging for Agriculture Market (by Application), $Million, 2022-2028
- Table 26: Switzerland Satellite Imaging for Agriculture Market (by End User), $Million, 2022-2028
- Table 27: Switzerland Satellite Imaging for Agriculture Market (by Product), $Million, 2022-2028
- Table 28: Belgium Satellite Imaging for Agriculture Market (by Application), $Thousand, 2022-2028
- Table 29: Belgium Satellite Imaging for Agriculture Market (by End User), $Thousand, 2022-2028
- Table 30: Belgium Satellite Imaging for Agriculture Market (by Product), $Thousand, 2022-2028
- Table 31: Spain Satellite Imaging for Agriculture Market (by Application), $Million, 2022-2028
- Table 32: Spain Satellite Imaging for Agriculture Market (by End User), $Million, 2022-2028
- Table 33: Spain Satellite Imaging for Agriculture Market (by Product), $Million, 2022-2028
- Table 34: Rest-of-Europe Satellite Imaging for Agriculture Market (by Application), $Million, 2022-2028
- Table 35: Rest-of-Europe Satellite Imaging for Agriculture Market (by End User), $Million, 2022-2028
- Table 36: Rest-of-Europe Satellite Imaging for Agriculture Market (by Product), $Million, 2022-2028
- Table 37: Airbus: Product Portfolio
- Table 38: Airbus: Product Development
- Table 39: Airbus: Partnership, Joint Venture, Collaboration, and Alliance
- Table 40: European Space Imaging: Product Portfolio
- Table 41: European Space Imaging: Partnership, Joint Venture, Collaboration, and Alliance
- Table 42: Gamaya: Product Portfolio
- Table 43: Gamaya: Product Development
- Table 44: ICEYE: Product Portfolio
- Table 45: ICEYE: Market Development
- Table 46: Open Cosmos Ltd: Product Portfolio
- Table 47: Open Cosmos Ltd: Product Development
- Table 48: Open Cosmos Ltd: Partnership, Joint Venture, Collaboration, and Alliance
- Table 49: Syngenta: Pricing and Product Portfolio
- Table 50: Syngenta: Market Developments
- Table 51: Syngenta: Product Developments
- Table 52: SpaceSense: Product Portfolio
- Table 53: SpaceSense: Partnership, Joint Venture, Collaboration, and Alliance
“The Europe Satellite Imaging for Agriculture Market (excluding U.K.) Expected to Reach $94.12 Million by 2028.”
Introduction to Europe Satellite Imaging for Agriculture Market
The Europe satellite imaging for agriculture market (excluding U.K.) was valued at $65.5 million in 2023, and it is expected to grow with a CAGR of 7.51% during the forecast period 2023-2028 to reach $94.12 million by 2028. The satellite imaging for agriculture technology market is poised for growth due to the rising demand for improved and sustainable agricultural practices.
| KEY MARKET STATISTICS | |
|---|---|
| Forecast Period | 2023 - 2028 |
| 2023 Evaluation | $65.5 Million |
| 2028 Forecast | $94.12 Million |
| CAGR | 7.51% |
Market Introduction
The Europe Satellite Imaging for Agriculture Market is currently undergoing substantial growth, driven by the escalating adoption of advanced technologies within the agricultural sector across European nations. Renowned for their emphasis on agricultural productivity and sustainability, European countries are increasingly embracing satellite imaging as a valuable tool for precise crop monitoring, soil health assessment, and the optimization of irrigation and fertilization practices. This technology facilitates early detection of pests and diseases, resource allocation optimization, and accurate crop yield predictions. The market enjoys the presence of numerous satellite imaging service providers and benefits from the integration of cutting-edge technologies like remote sensing and artificial intelligence, streamlining data analysis and generating actionable insights. As Europe continues to prioritize sustainable agriculture and precision farming practices, the satellite imaging for agriculture market is poised for significant growth, contributing to enhanced agricultural productivity and environmental preservation throughout the region.
Market Segmentation:
Segmentation 1: by Application
- Crop Health Monitoring
- Soil Mapping
- Forestry
- Others
Segmentation 2: by End User
- Agribusinesses
- Government and Non-Government Agencies
- Research Institutes
- Others
Segmentation 3: by Product
- Data Acquisition
- Processing
- Analytics
- Integrated Delivery Platform
Segmentation 4: by Country
- Germany
- France
- Italy
- Netherlands
- Switzerland
- Belgium
- Spain
- Rest-of-Europe
How Can This Report Add Value to an Organization?
Product/Innovation Strategy: The product segment helps the reader understand the different technologies used for satellite imaging for agriculture and their potential. Moreover, the study gives the reader a detailed understanding of the different solutions provided by the satellite imaging technology providers, such as imaging, processing, and analyzing. Compared to conventional agricultural methods, satellite imaging technology enables more exact targeting of planting, soil mapping, and forestry, allowing farmers to save money by maximizing the use of their inputs.
Growth/Marketing Strategy: The Europe satellite imaging for agriculture market has seen major development by key players operating in the market, such as business expansion, partnership, collaboration, and joint venture. The favored strategy for the companies has been partnerships, collaborations, and joint ventures to strengthen their position in the Europe satellite imaging for agriculture market.
Competitive Strategy: Key players in the Europe satellite imaging for agriculture market analyzed and profiled in the study involve satellite imaging technology-based product manufacturers, including market segments covered by distinct product kinds, applications served, and regional presence, as well as the influence of important market tactics employed. Moreover, a detailed competitive benchmarking of the players operating in the Europe satellite imaging for agriculture market has been done to help the reader understand how players stack against each other, presenting a clear market landscape. Additionally, comprehensive competitive strategies such as partnerships, agreements, and collaborations will aid the reader in understanding the untapped revenue pockets in the market.
Key Market Players and Competition Synopsis
The companies that are profiled have been selected based on inputs gathered from primary experts and analyzing company coverage, product portfolio, and market penetration.
Key Companies Profiled:
|
|
Table of Contents
Executive Summary
Scope of the Study
1. Markets
- 1.1. Industry Outlook
- 1.1.1. Market Definition
- 1.1.2. Ongoing Trends
- 1.1.2.1. Development of Small Satellite Constellations
- 1.1.2.2. Integration with other technologies
- 1.1.3. Ecosystem/Ongoing Programs
- 1.1.3.1. Consortiums, Associations, and Regulatory Bodies
- 1.1.3.2. Government Initiatives and Impacts
- 1.2. Business Dynamics
- 1.2.1. Business Drivers
- 1.2.1.1. Increasing Requirements from Insurance Sector
- 1.2.1.2. Increasing Farm Consolidation
- 1.2.1.3. High Benefits over Other Remote Sensing Technology and Infield Monitoring Technology
- 1.2.1.4. Need for Sustainable Agriculture Practices
- 1.2.2. Business Challenges
- 1.2.2.1. Technical Challenges in Obtaining and Analyzing Satellite Imagery
- 1.2.2.1.1. Hindrance Due to Cloud Cover
- 1.2.2.1.2. Hindrance due to Spatial and Temporal Resolution
- 1.2.2.2. Limited Awareness and Understanding across Developing Countries
- 1.2.2.3. Geopolitical Issues
- 1.2.2.1. Technical Challenges in Obtaining and Analyzing Satellite Imagery
- 1.2.3. Market Strategies and Developments
- 1.2.3.1. Business Strategies
- 1.2.3.1.1. Product Developments
- 1.2.3.1.2. Market Developments
- 1.2.3.2. Corporate Strategies
- 1.2.3.2.1. Mergers and Acquisitions
- 1.2.3.2.2. Partnerships, Collaborations, and Joint Ventures
- 1.2.3.2.3. Snapshot of Corporate Strategies Adopted by the Key Players in the Market
- 1.2.3.3. Case Study
- 1.2.3.3.1. Airbus in Yield Optimization
- 1.2.3.3.2. Planet Labs PBC in Irrigation Intelligence
- 1.2.3.3.3. EOS Data Analytics,Inc in Precision Agriculture
- 1.2.3.1. Business Strategies
- 1.2.4. Business Opportunities
- 1.2.4.1. Rising Threat of Climate Risk
- 1.2.4.2. Artificial Intelligence (AI) and Machine Learning (ML) in Action
- 1.2.4.3. Tapping Small Holding Farmer with Affordable Solutions
- 1.2.1. Business Drivers
- 1.3. Start-Up Landscape
- 1.3.1. Key Start-Ups in the Ecosystem
- 1.3.2. Funding Analysis
- 1.3.2.1. Total Investment and Number of Funding Deals
- 1.3.2.2. Top Funding Deals by the Start-ups
- 1.3.2.3. Funding Analysis (by Country)
- 1.3.2.4. Top Investors
- 1.4. Active Satellites for Digital Agriculture Application and their Technicalities
- 1.5. Impact of Russia-Ukraine Crisis on the Satellite Imaging for Agriculture Market
2. Region
- 2.1. Satellite Imaging for Agriculture Market - by Region
- 2.2. Europe
- 2.2.1. Markets
- 2.2.1.1. Key Providers in Europe
- 2.2.1.2. Buyer Attributes
- 2.2.1.2.1. Farm Size, Number of Farms, and State of Digitalization
- 2.2.1.2.2. Crop Pattern, Biotic, and Abiotic Stress Factors
- 2.2.1.3. Business Challenges
- 2.2.1.4. Business Drivers
- 2.2.2. Applications
- 2.2.2.1. Europe Satellite Imaging for Agriculture Market (by Application)
- 2.2.2.2. Europe Satellite Imaging for Agriculture Market (by End User)
- 2.2.3. Products
- 2.2.3.1. Europe Satellite Imaging for Agriculture Market (by Product)
- 2.2.4. Europe (by Country)
- 2.2.4.1. Italy
- 2.2.4.1.1. Markets
- 2.2.4.1.1.1. Buyer Attributes
- 2.2.4.1.1.1.1. Farm Size, Number of Farms, and State of Digitalization
- 2.2.4.1.1.1.2. Crop Pattern, Biotic, and Abiotic Stress Factors
- 2.2.4.1.1.2. Business Challenges
- 2.2.4.1.1.3. Business Drivers
- 2.2.4.1.2. Application
- 2.2.4.1.2.1. Italy Satellite Imaging for Agriculture Market (by Application)
- 2.2.4.1.2.2. Italy Satellite Imaging for Agriculture Market (by End User)
- 2.2.4.1.3. Product
- 2.2.4.1.3.1. Italy Satellite Imaging for Agriculture Market (by Product)
- 2.2.4.1.1. Markets
- 2.2.4.2. France
- 2.2.4.2.1. Markets
- 2.2.4.2.1.1. Buyer Attributes
- 2.2.4.2.1.1.1. Farm Size, Number of Farms, and State of Digitalization
- 2.2.4.2.1.1.2. Crop Pattern, Biotic, and Abiotic Stress Factors
- 2.2.4.2.1.2. Business Challenges
- 2.2.4.2.1.3. Business Drivers
- 2.2.4.2.2. Application
- 2.2.4.2.2.1. France Satellite Imaging for Agriculture Market (by Application)
- 2.2.4.2.2.2. France Satellite Imaging for Agriculture Market (by End User)
- 2.2.4.2.3. Product
- 2.2.4.2.3.1. France Satellite Imaging for Agriculture Market (by Product)
- 2.2.4.2.1. Markets
- 2.2.4.3. Netherlands
- 2.2.4.3.1. Markets
- 2.2.4.3.1.1. Buyer Attributes
- 2.2.4.3.1.1.1. Farm Size, Number of Farms, and State of Digitalization
- 2.2.4.3.1.1.2. Crop Pattern, Biotic, and Abiotic Stress Factors
- 2.2.4.3.1.2. Business Challenges
- 2.2.4.3.1.3. Business Drivers
- 2.2.4.3.2. Application
- 2.2.4.3.2.1. Netherlands Satellite Imaging for Agriculture Market (by Application)
- 2.2.4.3.2.2. Netherlands Satellite Imaging for Agriculture Market (by End User)
- 2.2.4.3.3. Product
- 2.2.4.3.3.1. Netherlands Satellite Imaging for Agriculture Market (by Product)
- 2.2.4.3.1. Markets
- 2.2.4.4. Germany
- 2.2.4.4.1. Markets
- 2.2.4.4.1.1. Buyer Attributes
- 2.2.4.4.1.1.1. Farm Size, Number of Farms, and State of Digitalization
- 2.2.4.4.1.1.2. Crop Pattern, Biotic, and Abiotic Stress Factors
- 2.2.4.4.1.2. Business Challenges
- 2.2.4.4.1.3. Business Drivers
- 2.2.4.4.2. Application
- 2.2.4.4.2.1. Germany Satellite Imaging for Agriculture Market (by Application)
- 2.2.4.4.2.2. Germany Satellite Imaging for Agriculture Market (by End User)
- 2.2.4.4.3. Product
- 2.2.4.4.3.1. Germany Satellite Imaging for Agriculture Market (by Product)
- 2.2.4.4.1. Markets
- 2.2.4.5. Switzerland
- 2.2.4.5.1. Markets
- 2.2.4.5.1.1. Buyer Attributes
- 2.2.4.5.1.1.1. Farm Size, Number of Farms, and State of Digitalization
- 2.2.4.5.1.1.2. Crop Pattern, Biotic, and Abiotic Stress Factors
- 2.2.4.5.1.2. Business Challenges
- 2.2.4.5.1.3. Business Drivers
- 2.2.4.5.2. Application
- 2.2.4.5.2.1. Switzerland Satellite Imaging for Agriculture Market (by Application)
- 2.2.4.5.2.2. Switzerland Satellite Imaging for Agriculture Market (by End User)
- 2.2.4.5.3. Product
- 2.2.4.5.3.1. Switzerland Satellite Imaging for Agriculture Market (by Product)
- 2.2.4.5.1. Markets
- 2.2.4.6. Belgium
- 2.2.4.6.1. Markets
- 2.2.4.6.1.1. Buyer Attributes
- 2.2.4.6.1.1.1. Farm Size, Number of Farms, and State of Digitalization
- 2.2.4.6.1.1.2. Crop Pattern, Biotic, and Abiotic Stress Factors
- 2.2.4.6.1.2. Business Challenges
- 2.2.4.6.1.3. Business Drivers
- 2.2.4.6.2. Application
- 2.2.4.6.2.1. Belgium Satellite Imaging for Agriculture Market (by Application)
- 2.2.4.6.2.2. Belgium Satellite Imaging for Agriculture Market (by End User)
- 2.2.4.6.3. Product
- 2.2.4.6.3.1. Belgium Satellite Imaging for Agriculture Market (by Product)
- 2.2.4.6.1. Markets
- 2.2.4.7. Spain
- 2.2.4.7.1. Markets
- 2.2.4.7.1.1. Buyer Attributes
- 2.2.4.7.1.1.1. Farm Size, Number of Farms, and State of Digitalization
- 2.2.4.7.1.1.2. Crop Pattern, Biotic, and Abiotic Stress Factors
- 2.2.4.7.1.2. Business Challenges
- 2.2.4.7.1.3. Business Drivers
- 2.2.4.7.2. Application
- 2.2.4.7.2.1. Spain Satellite Imaging for Agriculture Market (by Application)
- 2.2.4.7.2.2. Spain Satellite Imaging for Agriculture Market (by End User)
- 2.2.4.7.3. Product
- 2.2.4.7.3.1. Spain Satellite Imaging for Agriculture Market (by Product)
- 2.2.4.7.1. Markets
- 2.2.4.8. Rest-of-Europe
- 2.2.4.8.1. Markets
- 2.2.4.8.1.1. Buyer Attributes
- 2.2.4.8.1.1.1. Farm Size, Number of Farms, and State of Digitalization
- 2.2.4.8.1.1.2. Crop Pattern, Biotic, and Abiotic Stress Factors
- 2.2.4.8.1.2. Business Challenges
- 2.2.4.8.1.3. Business Drivers
- 2.2.4.8.2. Application
- 2.2.4.8.2.1. Rest-of-Europe Satellite Imaging for Agriculture Market (by Application)
- 2.2.4.8.2.2. Rest-of-Europe Satellite Imaging for Agriculture Market (by End User)
- 2.2.4.8.3. Product
- 2.2.4.8.3.1. Rest-of-Europe Satellite Imaging for Agriculture Market (by Product)
- 2.2.4.8.1. Markets
- 2.2.4.1. Italy
- 2.2.1. Markets
3. Markets - Competitive Benchmarking & Company Profiles
- 3.1. Competitive Benchmarking
- 3.2. Market Share Analysis
- 3.3. Company Profiles
- 3.3.1. Airbus
- 3.3.1.1. Company Overview
- 3.3.1.1.1. Role of Airbus in the Satellite Imaging for Agriculture Market
- 3.3.1.1.2. Product Portfolio
- 3.3.1.2. Business Strategies
- 3.3.1.2.1. Product Development
- 3.3.1.3. Corporate Strategies
- 3.3.1.3.1. Partnership, Joint Venture, Collaboration and Alliance
- 3.3.1.4. Customer Profile
- 3.3.1.4.1. Target Customer Segment
- 3.3.1.4.2. Key Clients
- 3.3.1.5. Analyst View
- 3.3.1.5.1. Regional Growth
- 3.3.1.1. Company Overview
- 3.3.2. European Space Imaging
- 3.3.2.1. Company Overview
- 3.3.2.1.1. Role of European Space Imaging in the Satellite Imaging for Agriculture Market
- 3.3.2.1.2. Product Portfolio
- 3.3.2.2. Corporate Strategies
- 3.3.2.2.1. Partnership, Joint Venture, Collaboration and Alliance
- 3.3.2.3. Customer Profile
- 3.3.2.3.1. Target Customer Segment
- 3.3.2.4. Analyst View
- 3.3.2.4.1. Regional Growth
- 3.3.2.1. Company Overview
- 3.3.3. Gamaya
- 3.3.3.1. Company Overview
- 3.3.3.1.1. Role of Gamaya in the Satellite Imaging for Agriculture Market
- 3.3.3.1.2. Product Portfolio
- 3.3.3.2. Business Strategies
- 3.3.3.2.1. Product Development
- 3.3.3.3. Customer Profile
- 3.3.3.3.1. Target Customer Segment
- 3.3.3.4. Analyst View
- 3.3.3.4.1. Regional Growth
- 3.3.3.1. Company Overview
- 3.3.4. ICEYE
- 3.3.4.1. Company Overview
- 3.3.4.1.1. Role of ICEYE in the Satellite Imaging for Agriculture Market
- 3.3.4.1.2. Product Portfolio
- 3.3.4.2. Business Strategies
- 3.3.4.2.1. Market Development
- 3.3.4.3. Customer Profile
- 3.3.4.3.1. Target Customer Segment
- 3.3.4.3.2. Key Clients
- 3.3.4.4. Analyst View
- 3.3.4.4.1. Regional Growth
- 3.3.4.1. Company Overview
- 3.3.5. Open Cosmos Ltd
- 3.3.5.1. Company Overview
- 3.3.5.1.1. Role of Open Cosmos Ltd in the Satellite Imaging for Agriculture Market
- 3.3.5.1.2. Product Portfolio
- 3.3.5.2. Business Strategies
- 3.3.5.2.1. Product Development
- 3.3.5.3. Corporate Strategies
- 3.3.5.3.1. Partnership, Joint Venture, Collaboration and Alliance
- 3.3.5.4. Customer Profile
- 3.3.5.4.1. Target Customer Segment
- 3.3.5.5. Analyst View
- 3.3.5.5.1. Regional Growth
- 3.3.5.1. Company Overview
- 3.3.6. Syngenta
- 3.3.6.1. Company Overview
- 3.3.6.2. Role of Syngenta in Satellite Imaging for Agriculture Market
- 3.3.6.3. Product Portfolio
- 3.3.6.4. Business Strategies
- 3.3.6.4.1. Market Developments
- 3.3.6.4.2. Product Developments
- 3.3.6.5. Customer Profile
- 3.3.6.5.1. Target Customers
- 3.3.6.6. Analyst View
- 3.3.1. Airbus
- 3.4. Key Start-Ups in the Satellite Imaging for Agriculture Market
- 3.4.1. SpaceSense
- 3.4.1.1. Company Overview
- 3.4.1.1.1. Role of SpaceSense in the Satellite Imaging for Agriculture Market
- 3.4.1.1.2. Product Portfolio
- 3.4.1.2. Corporate Strategies
- 3.4.1.2.1. Partnership, Joint Venture, Collaboration and Alliance
- 3.4.1.3. Customer Profile
- 3.4.1.3.1. Target Customer Segment
- 3.4.1.3.2. Key Clients
- 3.4.1.4. Analyst View
- 3.4.1.4.1. Regional Growth
- 3.4.1.1. Company Overview
- 3.4.1. SpaceSense
4. Research Methodology
- 4.1. Primary Data Sources
- 4.2. Secondary Data Sources
- 4.3. Market Estimation and Forecast
