|
|
市場調査レポート
商品コード
1428484
アジア太平洋の農業用衛星画像市場の分析・予測 (2023-2028年)Asia-Pacific Satellite Imaging for Agriculture Market: Analysis and Forecast, 2023-2028 |
||||||
|
|||||||
カスタマイズ可能
|
|||||||

| アジア太平洋の農業用衛星画像市場の分析・予測 (2023-2028年) |
|
出版日: 2024年02月20日
発行: BIS Research
ページ情報: 英文 110 Pages
納期: 1~5営業日
|

全表示
- 概要
- 図表
- 目次
アジア太平洋地域の農業用衛星画像市場のイントロダクション
| 主要市場統計 | |
|---|---|
| 予測期間 | 2023-2028 |
| 2023年評価 | 5,350万米ドル |
| 2028年予測 | 7,900万米ドル |
| CAGR | 8.11% |
中国を除くアジア太平洋地域の農業用衛星画像の市場規模は、2023年の5,350万米ドルから、予測期間中は8.11%のCAGRで推移し、2028年には7,900万米ドルの規模に成長すると予測されています。農業用衛星画像市場は、改善された持続可能な農業慣行に対する需要の高まりにより、成長の態勢を示しています。
アジア太平洋地域の農業用衛星画像市場は、農業分野での衛星技術の採用の増加により大きな成長を遂げています。衛星画像は、作物の健康状態、土壌水分レベル、植生分析に関する貴重な洞察を提供し、農家が作物管理や資源配分に関して情報に基づいた意思決定を行うことを可能にします。アジア太平洋地域には広大な農業地帯があり、食糧安全保障への需要が高まっているため、高度なモニタリングや精密農業技術へのニーズが高まっています。さらに、農業における衛星技術の利用を促進する政府の取り組みや、技術プロバイダーと農業ステークホルダーの協力関係が、市場の成長をさらに後押ししています。アジア太平洋諸国が農業のデジタルトランスフォーメーションを受け入れる中で、衛星画像市場は、地域全体の生産性、持続可能性、作物収量を改善する有望な機会を示しています。
当レポートでは、アジア太平洋地域の農業用衛星画像の市場を調査し、市場概要、市場成長への各種影響因子の分析、エコシステム、進行中のプログラム、技術動向、市場規模の推移・予測、各種区分・主要国別の詳細分析、主要企業の分析などをまとめています。
市場の分類
セグメンテーション1:用途別
- 作物健康モニタリング
- 土壌マッピング
- 林業
- その他
セグメンテーション2:エンドユーザー別
- 農業関連企業
- 政府・非政府機関
- 研究機関
- その他
セグメンテーション3:製品別
- データ収集
- 処理
- アナリティクス
- 統合配信プラットフォーム
セグメンテーション4:国別
- 日本
- インド
- 韓国
- オーストラリア・ニュージーランド
- その他
目次
エグゼクティブサマリー
調査範囲
第1章 市場
- 業界の展望
- 市場の定義
- 現在の動向
- エコシステム/進行中のプログラム
- 事業力学
- 事業促進要因
- 事業上の課題
- 市場戦略と展開
- 事業機会
- スタートアップの情勢
- デジタル農業のためのアクティブ衛星とその技術
- ロシア・ウクライナ危機が農業用衛星画像市場に与える影響
第2章 地域
- 農業用衛星画像- 地域別
- 中国
- 市場
- 用途
- 製品
- アジア太平洋
- 市場
- 用途
- 製品
- アジア太平洋(国別)
第3章 市場:競合ベンチマーキングと企業プロファイル
- 競合ベンチマーキング
- 市場シェア分析
- 企業プロファイル
- NaraSpace Inc
- SatSure
- Synspective
第4章 調査手法
List of Figures
- Figure 1: Global Operational Stock of Active Agriculture Satellites for Digital Applications, 2000-2022
- Figure 2: Asia-Pacific Satellite Imaging for Agriculture Market, $Million, 2022-2028
- Figure 3: Market Dynamics of the Satellite Imaging for Agriculture Market
- Figure 4: Asia-Pacific Satellite Imaging for Agriculture Market (by Application), $Million, 2022-2028
- Figure 5: Asia-Pacific Satellite Imaging for Agriculture Market (by End User), $Million, 2022-2028
- Figure 6: Asia-Pacific Satellite Imaging for Agriculture Market (by Product), $Million, 2022-2028
- Figure 7: Satellite Imaging for Agriculture Market (by Region), $Million, 2022
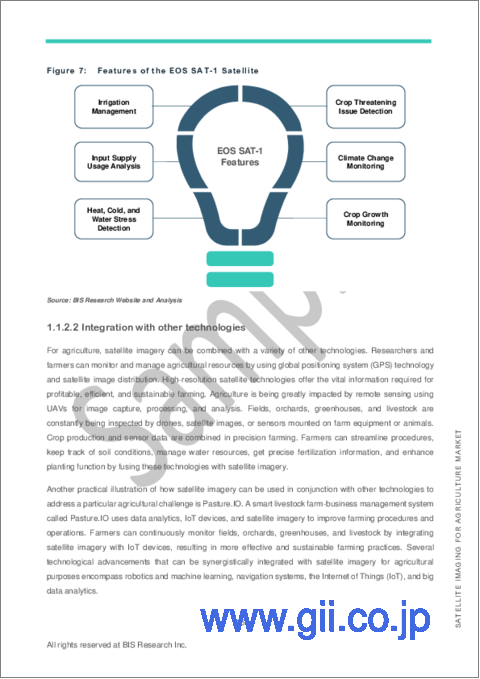
- Figure 8: Features of the EOS SAT-1 Satellite
- Figure 9: European Union (EU) Farm and Farmland by Land Size Class, 2018
- Figure 10: Share of Key Market Strategies and Developments, January 2019-April 2023
- Figure 11: Share of Product Developments and Innovations (by Company), January 2019-April 2023
- Figure 12: Share of Market Developments (by Company), January 2019-April 2023
- Figure 13: Share of Mergers and Acquisitions (by Company), January 2019-April 2023
- Figure 14: Share of Partnerships, Collaborations, and Joint Ventures (by Company), January 2019-April 2023
- Figure 15: Total Investment and Number of Funding Deals in the Satellite Imaging for Agriculture Market, 2017-2022
- Figure 16: Country-Wise Funding Share in the Satellite Imaging for Agriculture Market, 2017-2022
- Figure 17: Top Investors in the Satellite Imaging for Agriculture Market, 2017-2022
- Figure 18: Farm Size, Number of Farms, and State of Digitalization in China
- Figure 19: Crop Pattern, Biotic, and Abiotic Stress Factors
- Figure 20: Farm Size, Number of Farms, and State of Digitalization in Asia-Pacific
- Figure 21: Crop Pattern, Biotic, and Abiotic Stress Factors
- Figure 22: Farm Size, Number of Farms, and State of Digitalization in Japan
- Figure 23: Crop Pattern, Biotic, and Abiotic Stress Factors
- Figure 24: Farm Size, Number of Farms, and State of Digitalization in Australia and New Zealand
- Figure 25: Crop Pattern, Biotic, and Abiotic Stress Factors
- Figure 26: Farm Size, Number of Farms, and State of Digitalization in South Korea
- Figure 27: Crop Pattern, Biotic, and Abiotic Stress Factors
- Figure 28: Farm Size, Number of Farms, and State of Digitalization in India
- Figure 29: Crop Pattern, Biotic, and Abiotic Stress Factors
- Figure 30: Farm Size, Number of Farms, and State of Digitalization in Rest-of-Asia-Pacific
- Figure 31: Crop Pattern, Biotic, and Abiotic Stress Factors
- Figure 32: Competitive Benchmarking Matrix for Key Satellite Imaging for Agriculture Providers
- Figure 33: Market Share Analysis of Satellite Imaging for Agriculture Market, 2021
- Figure 34: Satellite Imaging for Agriculture Market: Research Methodology
- Figure 35: Data Triangulation
- Figure 36: Top-Down and Bottom-Up Approach
- Figure 37: Assumptions and Limitations
List of Tables
- Table 1: Key Consortiums, Associations, and Regulatory Bodies in the Satellite Imaging for Agriculture Market
- Table 2: Government Initiatives
- Table 3: Benefits of Satellite Imaging vs. Drone
- Table 4: Free Satellite Imagery Sources
- Table 5: Key Startups in the Satellite Imaging for Agriculture Market, 2019-2023
- Table 6: Top Funding by the Start-ups in the Satellite Imaging for Agriculture Market, 2022
- Table 7: Active Agriculture Satellites Technical Information
- Table 8: Satellite Imaging for Agriculture Market (by Region), $Million, 2022-2028
- Table 9: China Satellite Imaging for Agriculture Market (by Application), $Million, 2022-2028
- Table 10: China Satellite Imaging for Agriculture Market (by End User), $Million, 2022-2028
- Table 11: China Satellite Imaging for Agriculture Market (by Product), $Million, 2022-2028
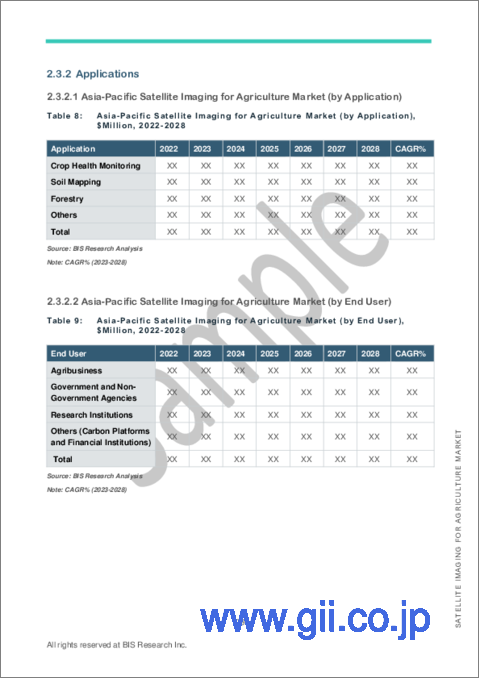
- Table 12: Asia-Pacific Satellite Imaging for Agriculture Market (by Application), $Million, 2022-2028
- Table 13: Asia-Pacific Satellite Imaging for Agriculture Market (by End User), $Million, 2022-2028
- Table 14: Asia-Pacific Satellite Imaging for Agriculture Market (by Product), $Million, 2022-2028
- Table 15: Asia-Pacific Satellite Imaging for Agriculture (by Country), $Million, 2022-2028
- Table 16: Japan Satellite Imaging for Agriculture Market (by Application), $Million, 2022-2028
- Table 17: Japan Satellite Imaging for Agriculture Market (by End User), $Million, 2022-2028
- Table 18: Japan Satellite Imaging for Agriculture Market (by Product), $Million, 2022-2028
- Table 19: Australia and New Zealand Satellite Imaging for Agriculture Market (by Application), $Million, 2022-2028
- Table 20: Australia and New Zealand Satellite Imaging for Agriculture Market (by End User), $Million, 2022-2028
- Table 21: Australia and New Zealand Satellite Imaging for Agriculture Market (by Product), $Million, 2022-2028
- Table 22: South Korea Satellite Imaging for Agriculture Market (by Application), $Million, 2022-2028
- Table 23: South Korea Satellite Imaging for Agriculture Market (by End User), $Thousand, 2022-2028
- Table 24: South Korea Satellite Imaging for Agriculture Market (by Product), $Million, 2022-2028
- Table 25: India Satellite Imaging for Agriculture Market (by Application), $Million, 2022-2028
- Table 26: India Satellite Imaging for Agriculture Market (by End User), $Million, 2022-2028
- Table 27: India Satellite Imaging for Agriculture Market (by Product), $Million, 2022-2028
- Table 28: Rest-of-Asia-Pacific Satellite Imaging for Agriculture Market (by Application), $Million, 2022-2028
- Table 29: Rest-of-Asia-Pacific Satellite Imaging for Agriculture Market (by End User), $Million, 2022-2028
- Table 30: Rest-of-Asia-Pacific Satellite Imaging for Agriculture Market (by Product), $Million, 2022-2028
- Table 31: NaraSpace Inc: Product Portfolio
- Table 32: NaraSpace Inc: Partnership, Joint Venture, Collaboration, and Alliance
- Table 33: SatSure: Product Portfolio
- Table 34: SatSure: Product Development
- Table 35: SatSure: Merger and Acquisition
- Table 36: SatSure: Partnership, Joint Venture, Collaboration, and Alliance
- Table 37: Synspective: Product Portfolio
- Table 38: Synspective: Partnership, Joint Venture, Collaboration, and Alliance
The Asia-Pacific Satellite Imaging for Agriculture Market (excluding China) Expected to Reach $79.0 Million by 2028
Introduction to Asia-Pacific Satellite Imaging for Agriculture Market
| KEY MARKET STATISTICS | |
|---|---|
| Forecast Period | 2023 - 2028 |
| 2023 Evaluation | $53.5 Million |
| 2028 Forecast | $79.0 Million |
| CAGR | 8.11% |
The Asia-Pacific satellite imaging for agriculture market (excluding China) was valued at $53.5 million in 2023, and it is expected to grow with a CAGR of 8.11% during the forecast period 2023-2028 to reach $79.0 million by 2028. The satellite imaging for agriculture technology market is poised for growth due to the rising demand for improved and sustainable agricultural practices.
Market Introduction
The Asia-Pacific (APAC) satellite imaging for agriculture market is witnessing significant growth driven by the increasing adoption of satellite technology in the agriculture sector. Satellite imaging provides valuable insights into crop health, soil moisture levels, and vegetation analysis, enabling farmers to make informed decisions regarding crop management and resource allocation. With the region's vast agricultural landscape and the growing demand for food security, there is a rising need for advanced monitoring and precision farming techniques. Additionally, government initiatives promoting the use of satellite technology in agriculture and collaborations between technology providers and agricultural stakeholders further boost market growth. As APAC countries embrace digital transformation in agriculture, the satellite imaging market presents promising opportunities for improving productivity, sustainability, and crop yield across the region.
Market Segmentation:
Segmentation 1: by Application
- Crop Health Monitoring
- Soil Mapping
- Forestry
- Others
Segmentation 2: by End User
- Agribusinesses
- Government and Non-Government Agencies
- Research Institutes
- Others
Segmentation 3: by Product
- Data Acquisition
- Processing
- Analytics
- Integrated Delivery Platform
Segmentation 4: by Country
- Japan
- India
- South Korea
- Australia and New Zealand
- Rest-of-Asia-Pacific
How Can This Report Add Value to an Organization?
Product/Innovation Strategy: The product segment helps the reader understand the different technologies used for satellite imaging for agriculture and their potential. Moreover, the study gives the reader a detailed understanding of the different solutions provided by the satellite imaging technology providers, such as imaging, processing, and analyzing. Compared to conventional agricultural methods, satellite imaging technology enables more exact targeting of planting, soil mapping, and forestry, allowing farmers to save money by maximizing the use of their inputs.
Growth/Marketing Strategy: The APAC satellite imaging for agriculture market has seen major development by key players operating in the market, such as business expansion, partnership, collaboration, and joint venture. The favored strategy for the companies has been partnerships, collaborations, and joint ventures to strengthen their position in the APAC satellite imaging for agriculture market.
Competitive Strategy: Key players in the APAC satellite imaging for agriculture market analyzed and profiled in the study involve satellite imaging technology-based product manufacturers, including market segments covered by distinct product kinds, applications served, and regional presence, as well as the influence of important market tactics employed. Moreover, a detailed competitive benchmarking of the players operating in the APAC satellite imaging for agriculture market has been done to help the reader understand how players stack against each other, presenting a clear market landscape. Additionally, comprehensive competitive strategies such as partnerships, agreements, and collaborations will aid the reader in understanding the untapped revenue pockets in the market.
Key Market Players and Competition Synopsis
The companies that are profiled have been selected based on inputs gathered from primary experts and analyzing company coverage, product portfolio, and market penetration.
Some prominent names established in this market are:
- NaraSpace Inc
- SatSure
- Synspective
Table of Contents
Executive Summary
Scope of the Study
1 Markets
- 1.1 Industry Outlook
- 1.1.1 Market Definition
- 1.1.2 Ongoing Trends
- 1.1.2.1 Development of Small Satellite Constellations
- 1.1.2.2 Integration with other technologies
- 1.1.3 Ecosystem/Ongoing Programs
- 1.1.3.1 Consortiums, Associations, and Regulatory Bodies
- 1.1.3.2 Government Initiatives and Impacts
- 1.2 Business Dynamics
- 1.2.1 Business Drivers
- 1.2.1.1 Increasing Requirements from Insurance Sector
- 1.2.1.2 Increasing Farm Consolidation
- 1.2.1.3 High Benefits over Other Remote Sensing Technology and Infield Monitoring Technology
- 1.2.1.4 Need for Sustainable Agriculture Practices
- 1.2.2 Business Challenges
- 1.2.2.1 Technical Challenges in Obtaining and Analyzing Satellite Imagery
- 1.2.2.1.1 Hindrance Due to Cloud Cover
- 1.2.2.1.2 Hindrance due to Spatial and Temporal Resolution
- 1.2.2.2 Limited Awareness and Understanding across Developing Countries
- 1.2.2.3 Geopolitical Issues
- 1.2.2.1 Technical Challenges in Obtaining and Analyzing Satellite Imagery
- 1.2.3 Market Strategies and Developments
- 1.2.3.1 Business Strategies
- 1.2.3.1.1 Product Developments
- 1.2.3.1.2 Market Developments
- 1.2.3.2 Corporate Strategies
- 1.2.3.2.1 Mergers and Acquisitions
- 1.2.3.2.2 Partnerships, Collaborations, and Joint Ventures
- 1.2.3.2.3 Snapshot of Corporate Strategies Adopted by the Key Players in the Market
- 1.2.3.3 Case Study
- 1.2.3.3.1 Airbus in Yield Optimization
- 1.2.3.3.2 Planet Labs PBC in Irrigation Intelligence
- 1.2.3.3.3 EOS Data Analytics,Inc in Precision Agriculture
- 1.2.3.1 Business Strategies
- 1.2.4 Business Opportunities
- 1.2.4.1 Rising Threat of Climate Risk
- 1.2.4.2 Artificial Intelligence (AI) and Machine Learning (ML) in Action
- 1.2.4.3 Tapping Small Holding Farmer with Affordable Solutions
- 1.2.1 Business Drivers
- 1.3 Start-Up Landscape
- 1.3.1 Key Start-Ups in the Ecosystem
- 1.3.2 Funding Analysis
- 1.3.2.1 Total Investment and Number of Funding Deals
- 1.3.2.2 Top Funding Deals by the Start-ups
- 1.3.2.3 Funding Analysis (by Country)
- 1.3.2.4 Top Investors
- 1.4 Active Satellites for Digital Agriculture Application and their Technicalities
- 1.5 Impact of Russia-Ukraine Crisis on the Satellite Imaging for Agriculture Market
2 Region
- 2.1 Satellite Imaging for Agriculture Market - by Region
- 2.2 China
- 2.2.1 Markets
- 2.2.1.1 Buyer Attributes
- 2.2.1.1.1 Farm Size, Number of Farms, and State of Digitalization
- 2.2.1.1.2 Crop Pattern, Biotic, and Abiotic Stress Factors
- 2.2.1.2 Business Challenges
- 2.2.1.3 Business Drivers
- 2.2.1.1 Buyer Attributes
- 2.2.2 Applications
- 2.2.2.1 China Satellite Imaging for Agriculture Market (by Application)
- 2.2.2.2 China Satellite Imaging for Agriculture Market (by End User)
- 2.2.3 Products
- 2.2.3.1 China Satellite Imaging for Agriculture Market (by Product)
- 2.2.1 Markets
- 2.3 Asia-Pacific
- 2.3.1 Markets
- 2.3.1.1 Key Providers in Asia-Pacific
- 2.3.1.2 Buyer Attributes
- 2.3.1.2.1 Farm Size, Number of Farms, and State of Digitalization
- 2.3.1.2.2 Crop Pattern, Biotic, and Abiotic Stress Factors
- 2.3.1.3 Business Challenges
- 2.3.1.4 Business Drivers
- 2.3.2 Applications
- 2.3.2.1 Asia-Pacific Satellite Imaging for Agriculture Market (by Application)
- 2.3.2.2 Asia-Pacific Satellite Imaging for Agriculture Market (by End User)
- 2.3.3 Products
- 2.3.3.1 Asia-Pacific Satellite Imaging for Agriculture Market (by Product)
- 2.3.4 Asia-Pacific (by Country)
- 2.3.4.1 Japan
- 2.3.4.1.1 Markets
- 2.3.4.1.1.1 Buyer Attributes
- 2.3.4.1.1.1.1 Farm Size, Number of Farms, and State of Digitalization
- 2.3.4.1.1.1.2 Crop Pattern, Biotic, and Abiotic Stress Factors
- 2.3.4.1.1.2 Business Challenges
- 2.3.4.1.1.3 Business Drivers
- 2.3.4.1.2 Application
- 2.3.4.1.2.1 Japan Satellite Imaging for Agriculture Market (by Application)
- 2.3.4.1.2.2 Japan Satellite Imaging for Agriculture Market (by End User)
- 2.3.4.1.3 Product
- 2.3.4.1.3.1 Japan Satellite Imaging for Agriculture Market (by Product)
- 2.3.4.1.1 Markets
- 2.3.4.2 Australia and New Zealand
- 2.3.4.2.1 Markets
- 2.3.4.2.1.1 Buyer Attributes
- 2.3.4.2.1.1.1 Farm Size, Number of Farms, and State of Digitalization
- 2.3.4.2.1.1.2 Crop Pattern, Biotic, and Abiotic Stress Factors
- 2.3.4.2.1.2 Business Challenges
- 2.3.4.2.1.3 Business Drivers
- 2.3.4.2.2 Application
- 2.3.4.2.2.1 Australia and New Zealand Satellite Imaging for Agriculture Market (by Application)
- 2.3.4.2.2.2 Australia and New Zealand Satellite Imaging for Agriculture Market (by End User)
- 2.3.4.2.3 Product
- 2.3.4.2.3.1 Australia and New Zealand Satellite Imaging for Agriculture Market (by Product)
- 2.3.4.2.1 Markets
- 2.3.4.3 South Korea
- 2.3.4.3.1 Markets
- 2.3.4.3.1.1 Buyer Attributes
- 2.3.4.3.1.1.1 Farm Size, Number of Farms, and State of Digitalization
- 2.3.4.3.1.1.2 Crop Pattern, Biotic, and Abiotic Stress Factors
- 2.3.4.3.1.2 Business Challenges
- 2.3.4.3.1.3 Business Drivers
- 2.3.4.3.2 Application
- 2.3.4.3.2.1 South Korea Satellite Imaging for Agriculture Market (by Application)
- 2.3.4.3.2.2 South Korea Satellite Imaging for Agriculture Market (by End User)
- 2.3.4.3.3 Product
- 2.3.4.3.3.1 South Korea Satellite Imaging for Agriculture Market (by Product)
- 2.3.4.3.1 Markets
- 2.3.4.4 India
- 2.3.4.4.1 Markets
- 2.3.4.4.1.1 Buyer Attributes
- 2.3.4.4.1.1.1 Farm Size, Number of Farms, and State of Digitalization
- 2.3.4.4.1.1.2 Crop Pattern, Biotic, and Abiotic Stress Factors
- 2.3.4.4.1.2 Business Challenges
- 2.3.4.4.1.3 Business Drivers
- 2.3.4.4.2 Application
- 2.3.4.4.2.1 India Satellite Imaging for Agriculture Market (by Application)
- 2.3.4.4.2.2 India Satellite Imaging for Agriculture Market (by End User)
- 2.3.4.4.3 Product
- 2.3.4.4.3.1 India Satellite Imaging for Agriculture Market (by Product)
- 2.3.4.4.1 Markets
- 2.3.4.5 Rest-of-Asia-Pacific
- 2.3.4.5.1 Markets
- 2.3.4.5.1.1 Buyer Attributes
- 2.3.4.5.1.1.1 Farm Size, Number of Farms, and State of Digitalization
- 2.3.4.5.1.1.2 Crop Pattern, Biotic, and Abiotic Stress Factors
- 2.3.4.5.1.2 Business Challenges
- 2.3.4.5.1.3 Business Drivers
- 2.3.4.5.2 Application
- 2.3.4.5.2.1 Rest-of-Asia-Pacific Satellite Imaging for Agriculture Market (by Application)
- 2.3.4.5.2.2 Rest-of-Asia-Pacific Satellite Imaging for Agriculture Market (by End User)
- 2.3.4.5.3 Product
- 2.3.4.5.3.1 Rest-of-Asia-Pacific Satellite Imaging for Agriculture Market (by Product)
- 2.3.4.5.1 Markets
- 2.3.4.1 Japan
- 2.3.1 Markets
3 Markets - Competitive Benchmarking & Company Profiles
- 3.1 Competitive Benchmarking
- 3.2 Market Share Analysis
- 3.3 Company Profiles
- 3.3.1 NaraSpace Inc
- 3.3.1.1 Company Overview
- 3.3.1.1.1 Role of NaraSpace Inc in the Satellite Imaging for Agriculture Market
- 3.3.1.1.2 Product Portfolio
- 3.3.1.2 Corporate Strategies
- 3.3.1.2.1 Partnership, Joint Venture, Collaboration and Alliance
- 3.3.1.3 Customer Profile
- 3.3.1.3.1 Target Customer Segment
- 3.3.1.4 Analyst View
- 3.3.1.4.1 Regional Growth
- 3.3.1.1 Company Overview
- 3.3.2 SatSure
- 3.3.2.1 Company Overview
- 3.3.2.1.1 Role of SatSure in the Satellite Imaging for Agriculture Market
- 3.3.2.1.2 Product Portfolio
- 3.3.2.2 Business Strategies
- 3.3.2.2.1 Product Development
- 3.3.2.3 Corporate Strategies
- 3.3.2.3.1 Merger and Acquisition
- 3.3.2.3.2 Partnership, Joint Venture, Collaboration and Alliance
- 3.3.2.4 Customer Profile
- 3.3.2.4.1 Target Customer Segment
- 3.3.2.5 Analyst View
- 3.3.2.5.1 Regional Growth
- 3.3.2.1 Company Overview
- 3.3.3 Synspective
- 3.3.3.1 Company Overview
- 3.3.3.1.1 Role of Synspective in the Satellite Imaging for Agriculture Market
- 3.3.3.1.2 Product Portfolio
- 3.3.3.2 Corporate Strategies
- 3.3.3.2.1 Partnership, Joint Venture, Collaboration and Alliance
- 3.3.3.3 Customer Profile
- 3.3.3.3.1 Target Customer Segment
- 3.3.3.3.2 Key Clients
- 3.3.3.4 Analyst View
- 3.3.3.4.1 Regional Growth
- 3.3.3.1 Company Overview
- 3.3.1 NaraSpace Inc
4 Research Methodology
- 4.1 Primary Data Sources
- 4.2 Secondary Data Sources
- 4.3 Market Estimation and Forecast

